

Bailouts, QE and Stimulus
Bailouts, QE and Stimulus
The $300 billion pop in the Fed's balance sheet isn't QE and it's not stimulus

Less than two weeks ago, the main debate in financial markets was whether the Federal Reserve would raise 25 or 50 basis points at its meeting tomorrow.
Market participants also fretted over the Fed’s terminal rate – peak rates for the hiking cycle – with some pundits calling for Fed Funds north of 6%, up from 4.75% currently, to bring inflation back down to target.
Meanwhile, others speculated the central bank might be engineering a rare soft landing, where inflation glides painlessly back to target without the economy slipping into recession. Some went even further, calling for “no landing,” a never-seen-before mythical scenario where growth remains robust even as inflation pressures magically vanish.
Hope springs eternal: It’s truly shocking the surreal scenarios investors embrace after years of near-zero rates followed by two years of record-setting fiscal largesse in 2020-21.
Today, the main debate appears to be whether the Fed will hike rates at all this week and when, and by how much, the Fed might be forced to cut rates over the next 12 months:
Source: Bloomberg
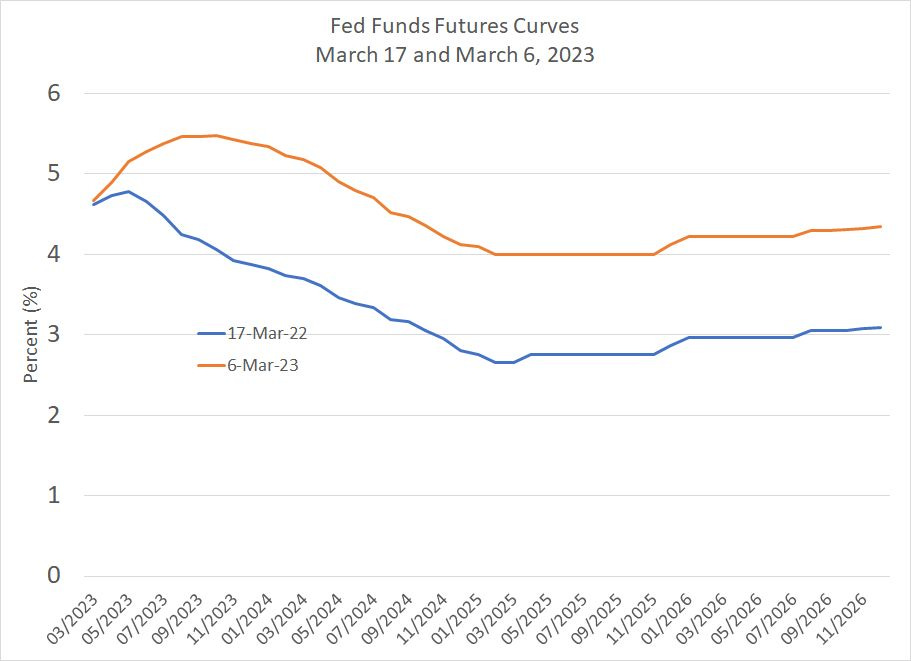
This chart summarizes expectations for Fed policy priced into the Fed Funds futures market on Monday, March 6th and Friday March 17th.
Two weeks ago, the market expected the Fed to boost rates to a peak near 5.5% by this summer and to maintain rates over 5% through April 2024. At the peak of hawkishness, on Wednesday March 8th, Fed funds futures were fully pricing in a 25-basis point hike this week and 71.2% probability of a 50-basis point hike.
As of Friday, however, markets were back to just a 60% chance of 25 basis hike this week; indeed, there’s even a 13% probability price baked into futures the Fed NEVER hikes again this cycle.
Even more important, the consensus now sees 75 basis points of cuts from current levels to below 4% by November of this year, and a full 100 basis points (1.00%) by the time the FOMC meets on January 31, 2024.
Of course, as I explained in last week’s issue of The Free Market Speculator, “Accidents, the Yield Curve and Recession,” the main driver of the dramatic repricing of Fed policy path over the past two weeks is the collapse of SVB Financial and Signature Bank and the government’s subsequent efforts to stabilize the situation.
And that brings me to this:
Pavlov’s 3-Part Pattern
Equity markets seem to believe what’s happening is just a repeat of the 3-stage pattern we’ve experienced several times since the global financial crisis of 2007-09.
The cycle goes something like this:
1. The Fed hikes and tries to reduce the size of its balance sheet to remove “extreme” policy accommodation put in place 15 years ago in 2008-09.
2. After a time, something bad happens, usually a big sell-off in the stock market, the bond market, instability in one industry group or another, or some weakening in the economic data that threatens recession.
3. In response to #2, the Fed postpones planned rate hikes, cuts rates or, if the shock is big enough, restarts QE.
The collapse of SVB Financial and Signature, and the near collapse of First Republic Bank FRC 0.00%↑ certainly constitute something “bad” happening. It’s only natural to believe the flurry of new policies aimed at assuaging fears swirling about the financial system would mark a move to the third stage.
After all, it’s been only a little over a week since the FDIC took control of SVB Financial and we already have a brand-new bailout and associated government acronym to track – the Bank Term Funding Program or “BTFP” for short.
And, just last Thursday, with the encouragement of the federal government, a consortium of 11 of the nation’s largest financial institutions agreed to deposit $30 billion at struggling California-based First Republic for an initial term of 120 days.
Aimed at forestalling a potential run on FRC by its depositors, and project confidence in the health of the banking system, investors initially cheered the move with shares roughly doubling from lows under $20 to a peak Thursday afternoon of $40.
On Friday, however, the stock fell to $23.03, giving back most of its post-bailout pop and last night the stock closed under $13, down 90% so far this year.
Of course, signs of policymaker panic aren’t unique to the US. Just last week, the Swiss government agreed to provide a $54 billion backstop to ailing Credit Suisse, which did little to forestall a collapse in shares. Last weekend the government was forced to broker a deal for UBS to acquire Credit Suisse in a $3.2 billion deal that included significant government guarantees and a complete wipe-out of more than $17 billion worth of Credit Suisse additional Tier 1 bondholders.
So, for equity market investors, the post financial crisis playbook when you reach stage 3 of the cycle I just outlined, is simple – you buy stocks and, in particular, you buy growth stocks and the Nasdaq with both hands.
You can see that tendency right here:
Source: Bloomberg
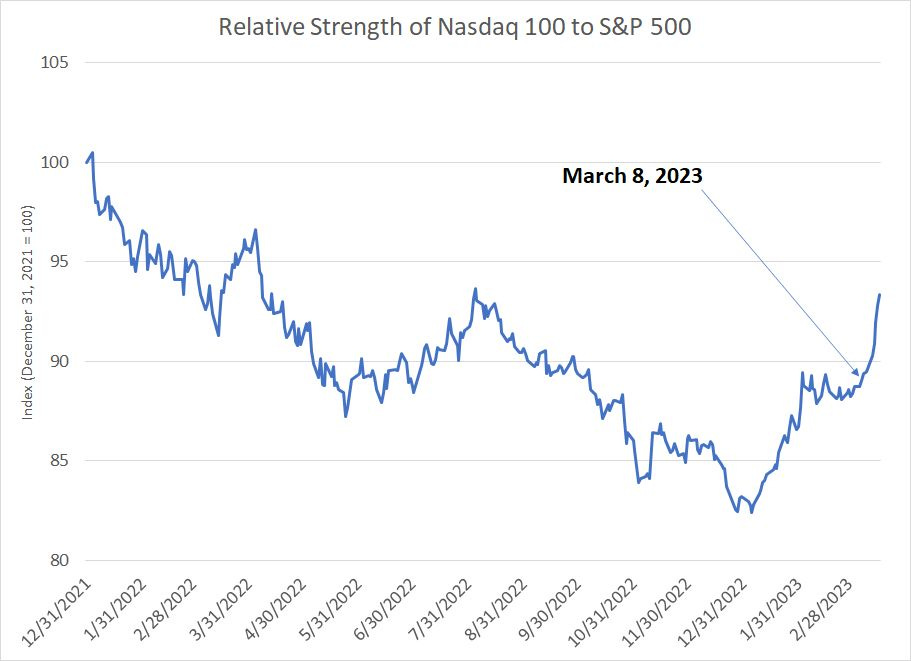
This chart shows the relative strength of the Nasdaq 100 QQQ 0.00%↑ to the S&P 500 since the end of 2021 where a rising line indicates strength for the Nasdaq against the broader market.
As you can see, the Nasdaq has jumped since March 8th, the date Silicon Valley Bank’s struggles began to make headlines, relative to the broader market. Indeed, since the close on March 7th, the Nasdaq 100 has rallied over 3.4% while the S&P 500 is down about 1%.
You see, like Pavlov’s dogs, investors have become accustomed to this pattern and the most profitable response.
In late 2018, the market collapsed as the Fed was raising rates, so the central bank first paused planned hikes, then cut rates in the summer of 2019 – the Nasdaq 100 soared almost 40% in 2019, besting the S&P 500 by around 8 percentage points.
Then, of course, in 2020 the Fed went full-panic in response to the economy-chilling impact of COVID lockdowns and unleashed its monetary bazooka -- the Nasdaq soared almost 49% in 2020 and the super-growth play, ARK Innovation ETF ARKK 0.00%↑ , sky-rocketed 153%, while the S&P 500 was up just 18.4%.
Is it really any wonder that, over the past week, amid all the talk of rate cuts, a new round of quantitative easing and federal bailouts, equity investors have run for the Nasdaq and ARKK once again?
However, while the market’s knee-jerk reaction to all this news isn’t a huge surprise given the experience of the past 15 years, there are some serious signs the post-crisis stock market playbook has been shredded.
Let’s start with this:
This isn’t QE...
Every Thursday afternoon, the Federal Reserve releases its H.4 report which details the central bank’s holdings of Treasury and mortgage-backed securities.
Quantitative easing (QE) is a process by which the Fed makes large-scale purchases of government and mortgage bonds to drive down rates – when total assets held by the Fed reported in H.4 rise, that’s a sign QE is in progress.
So here’s a chart showing the Fed’s total assets:
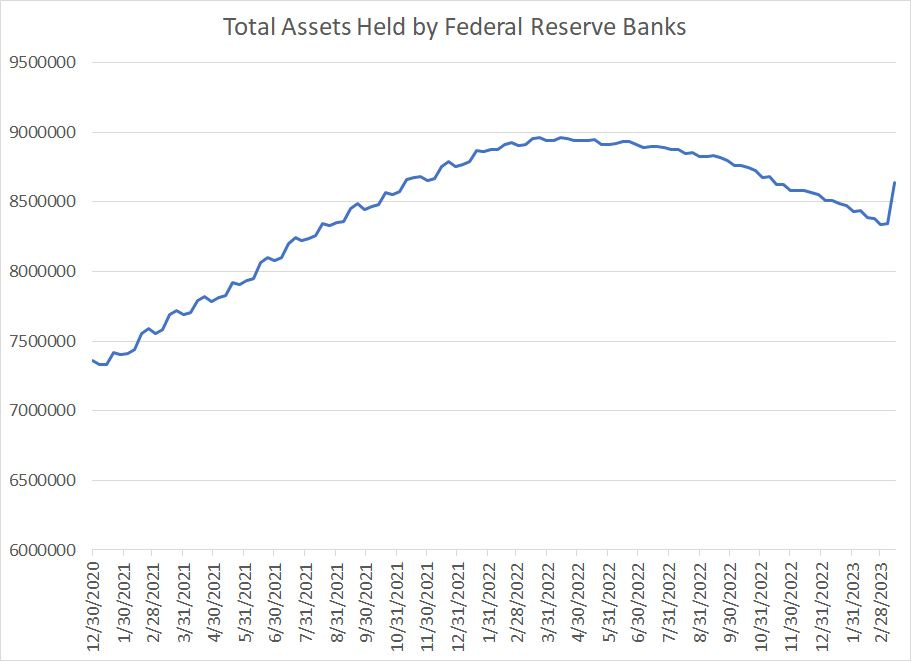
As you can see, the Fed’s assets hit an all-time peak of about $8.96 trillion less than a year ago on April 13, 2022. Between the end of February 2020 and last April’s peak, the Fed purchased a total of roughly $4.8 trillion as part of its COVID-era QE program, more than doubling the size of its balance sheet.
The Fed then began quantitative tightening last year and, from the peak last April to the low on March 1st of this year, total assets held by the Fed contracted by about $625 billion dollars.
However, look at what’s happened in just the last week: The Fed’s total assets soared by $300 billion, reversing almost half the decline since last April’s peak in a single week.
So, does the big jump in Fed assets last week mean the Fed is firing up its famous money printer and is it the all-clear to buy risk assets and the Nasdaq?
The answer is a resounding no.
The jump in assets on the Fed’s balance sheet says more about serious lingering weakness in the financial system than it does about new stimulus.
As I noted earlier, traders use weekly reports on the Fed’s balance sheet as an indicator of quantitative easing because bonds the central bank buys show up as assets.
However, dig a little deeper and last week’s H.4 release shows Fed holdings of US Treasury and mortgage-backed securities FELL to the tune of more than $8.3 billion between March 8 and March 15th. The speed at which securities have been rolling off the Fed’s balance sheet – the speed of quantitative tightening -- isn’t consistent from week-to-week because it depends on the maturities of bonds in the portfolio and other factors. However, $8.3 billion isn’t out of the norm.
But there are other factors that drive assets held by the Fed other than QE.
For example, in addition to securities held by the Fed – the target of QE – the Fed, like commercial banks, also counts loans as asset.
There are three categories of Fed loans to watch right now:
First, there’s “primary credit,” commonly called the discount window, which has been in existence since the Fed was first created back in 1913. It’s a means for banks to borrow money from the central bank for terms up to 90 days; loans are collateralized, and banks pay interest on borrowed funds, currently at 4.75%.
Second, there’s the new Bank Term Funding Program (BTFP), created last week. The BTFP allows banks to post securities like Treasury Bonds and mortgage-backed securities as collateral against loans from the Fed for terms of up to one year (a longer term than primary credit).
Third, the Fed’s balance sheet includes a catch-all category in its weekly H.4 releases called “Other Credit Extensions,” which includes loans made to depository institutions created by the Federal Deposit Insurance Corporation (FDIC). Simply put, when the FDIC seizes a bank – such as they did with SVB and Signature earlier this month -- they borrow from the Fed, using collateral from the bank they’ve seized.
Over time, the FDIC tries to sell off the bank’s assets, or the bank itself, to repay the loan, offering the central bank a guarantee. Since the FDIC also charges a fee to all US banks to provide deposit insurance, the idea is they can tap that fund to cover any residual losses through this process.
These 3 programs are behind the big $300 billion jump in Fed assets reported last week.
The BTFP is new and was a relatively small contributor – BTFP loans by the Fed totaled $11.943 billion as of last Wednesday March 15th.
The “other credit extensions category” totaled $142.8 billion, up from $0 the week before and the Fed’s balance sheet notes confirmed this was related to FDIC activities over the past few weeks.
And then there’s the big one:

Source: Bloomberg
This chart shows total loans outstanding under the Fed’s primary credit facility, which soared to $152.85 billion last week.
That’s more than banks borrowed back in 2020 amid the COVID lockdown crash and it’s even more than banks borrowed at height of the 2007-09 global financial crisis.
So, these 3 categories of loans accounted for all the increase in the Fed’s balance sheet last week and dwarfed the ongoing decline in the Fed’s balance sheet due to quantitative tightening (QT).
One of the most basic tenets of accounting is that assets equal liabilities plus owner’s equity – that’s where the term “balance” sheet comes from.
The Fed’s balance sheet is not much different, and the central bank’s assets have increased, so let’s look at the liabilities side of the equation. In this case, the largest increase in Fed liabilities was a $440.5 billion increase in reserve balances – these are deposits made by commercial banks at the central bank which currently pay interest (from the Fed to the banks) at an annualized rate of 4.65%.
When you go to a bank and deposit money, that’s a liability on that bank’s balance sheet because the bank must give you back your deposit on demand. Loans are assets for the bank because the borrower must repay principal and interest.
The Fed accounts for things in more or less the same way – the loans it makes via the primary credit facility and BTFP are assets while the money commercial banks deposit at the Fed are liabilities.
So, what exactly is happening here?
In short, it’s all just a symptom of deposit flight from regional banks.
The FDIC insures deposits up to $250,000; aggregate amounts you hold on deposit at a financial institution above that limit are NOT insured. The same thing is true of business deposits, the FDIC totals up all deposits of the same business at the same bank and only covers amounts up to $250,000.
After a very tense weekend, the FDIC extended insurance to all deposits at both Silicon Valley Bank and Signature Bank earlier this month. However, last week Treasury Secretary Janet Yellen made clear that guarantee doesn’t extend to all banks. Indeed, a bank only gets that treatment if, as she put it, “the failure to protect uninsured depositors would create systemic risk and significant economic and financial consequences.”
Reports suggest that personal and business depositors are withdrawing balances above those FDIC limits from regional banks and sending that cash to the nation’s largest banks like JP Morgan Chase (NYSE: JPM) and Bank of America (NYSE: BAC).
These so-called Global Systemically Important Banks (GSIBs) are subject to more stringent regulations regarding the capital they must maintain. You’ve probably heard the phase “Too Big to Fail,” meaning the government can’t allow these banks to collapse as SIVB did without creating devastating instability across the financial system.
So, scared depositors are moving their money to the too-big-to-fail banks en masse.
And, what do the large money center banks do with that deposit windfall?
For the most part, the large banks have higher cash balances on deposit at the Fed due, in part, to regulatory requirements as I just outlined.
In other words, the Fed’s assets are jumping because smaller banks are desperate for liquidity and experiencing deposit flight. Facing withdrawal requests from customers, the banks are posting Treasury and mortgage-backed securities they own as collateral to obtain loans from the Fed’s primary credit and BTFP facilities to meet demand for cash. This shows up as an asset on the Fed’s balance sheet.
Then, fleeing depositors are wiring their money to the likes of JP Morgan which, in turn, parks that cash with the Federal Reserve, showing up as an increase in liabilities at the Fed in the form of bank reserves.
However, it’s unlikely overall bank deposits are rising – much of that money is likely simply shifting between financial institutions from smaller regionals to GSIBs.
Securities portfolios held by the regional banks don’t touch the Fed’s balance sheet directly; only reserves they deposit with the central bank. However, the minute that regional posts collateral to obtain a loan from the Fed, that DOES show up on the Fed’s balance sheet as an asset.
In effect the central bank is acting as a conduit to provide the regionals with liquidity and to transfer deposits from smaller institutions to larger systemically important banks.
Money is being shuffled from a part of the financial system that has limited interaction with the Fed to a part of the market that’s intimately tied to the central bank.
A Bailout but Not Stimulus
With quantitative easing, the Fed buys a predetermined amount of Treasury bonds each month.
This has two main impacts:
1. When you buy a Treasury or mortgage-backed bond that’s going to tend to increase the price of the bond which reduces the yield. So, under QE, the Fed can depress yields on Treasury and mortgage bonds of different maturities, not just short-term interest rate benchmarks it controls like the Fed Funds Rate. And, since the interest rate charged on loans is usually priced off benchmarks like Treasury yields, this lowers the cost of credit for everything from buying a house to business loans and credit cards. All else equal that should stimulate more borrowing and economic activity.
2. Let’s say the Fed buys a Treasury bond from a primary dealer like JP Morgan. The Fed credits JP Morgan’s account at the Fed – that’s the bank’s reserves on deposit at the Fed – to pay for the bond. That’s what’s meant by “printing money” – the Fed simply credits JPM’s account at the central bank, creating new money. Theoretically, then, the increase in reserves at JPM (or an increase in deposits for JPM’s customer who owned that bond) could be used to support new lending activity through the commercial banks.
What we saw last week could be considered a bailout for the regionals in the sense the Fed has made it easier to borrow money from the central bank to meet deposit withdrawals. And, the Fed also announced it will value collateral under both the primary credit and BTFP facilities at par value rather than market value.
It would also not at all surprise me if FDIC insurance were eventually temporarily extended to cover all deposits regardless of size. This happened amid the financial crisis of 2007-09 and it could happen again – this could be properly considered a bailout for both uninsured depositors and the smaller regional banks.
But a “bailout” and economic stimulus are two different things.
Under QE, the Fed buys bonds, driving down rates. However, the Fed isn’t buying anything in this case, but using the banks’ bonds as collateral to make loans. This has no direct impact on the price of the bonds or interest rates.
So, the first avenue of stimulus from QE I highlighted above doesn’t apply.
And that brings me to the second avenue – creating new bank reserves to support lending – and let’s consider this from the perspective of a regional bank facing deposit flight. That bank carries loans to consumers and businesses on its balance sheet as assets and the main source of funds is bank deposits, which are a liability.
When deposit liabilities flee for the GSIBs, the asset side of the balance sheet must adjust accordingly by falling as well, or the bank must replace those deposit liabilities with other sources of funding. So, one option is to use cash deposits at the Fed (an asset for the regional) to meet deposit withdrawals. However, if withdrawals are high enough, that liquidity is inadequate.
The bank can also sell off its securities. SIVB did that, at a discounted valuation, just prior to its collapse, so that’s not a very attractive option and doing so could well spook investors as it did with SIVB.
The bank could also try to raise capital by selling stock, preferred shares or eliminating dividends. However, the third option takes time to help and the first two are difficult, especially with valuations across the sector collapsing in the current crisis. Indeed, announcing a capital raise in this environment is like throwing blood in shark-infested waters, highlighting your weakness – SIVB’s efforts to raise capital helped catalyze $43 billion in deposit flight in a single day and the bank’s collapse.
So, the Fed has opened a different avenue – you can borrow money from the central bank, replacing falling deposit liabilities with loans (also a liability) without having to reduce assets by selling off securities or raising capital.
However, while that helps meet demand for withdrawals, it does NOT encourage the regional banks to lend or extend credit.
After all, while there are technically no limits on the use of funds borrowed from the Fed through the primary credit and BTFP facilities, do you think a bank watching deposits flee is going to borrow money from the Fed, turn around and lend it right back out to consumers and businesses?
Of course not!
After watching the collapse of SIVB, SBNY and continued trouble from the likes of FRC, none of these regionals are likely in the mood to take on more risk.
In fact, many were already tightening up credit dramatically before the recent regional bank crisis:
Source: Bloomberg, Federal Reserve
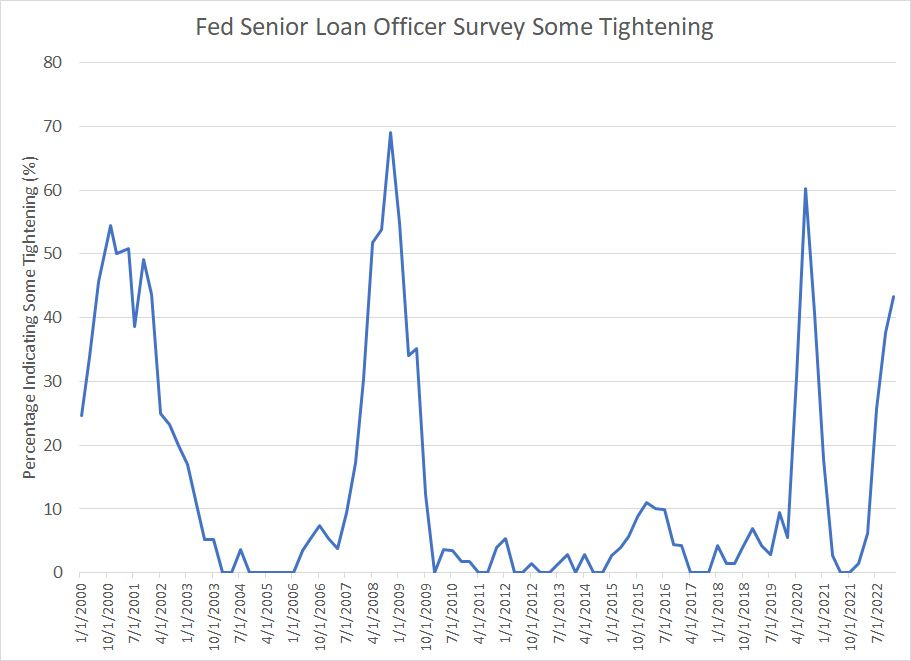
This chart is from a survey the Fed performs on banks quarterly called the Senior Loan Officer Opinion Survey on Bank Lending Practices.
This particular series shows the percentage of banks indicating at least some tightening in lending standards – as you can see this usually rises during economic downturns as banks become more risk averse. In fact, the most recent responses, which date from January 2023 are already approaching levels we normally only see during recessions.
Diving a bit deeper into this report, the Fed reports that a net 43.8% of all banks are reporting tightening lending standards on small businesses, 28.3% tightening standards on credit cards and 17.3% tightening standards on new and used car loans.
Again, if banks were already tightening lending standards before the collapse of Silicon Valley and Signature Bank, and before they faced large-scale deposit flight, it’s hard to imagine they’re not tightening standards even more now.
Also, two more points about all this.
First, let’s consider the perspective of a regional bank that experienced some deposit flight and replaced those deposits with increased borrowings from the Fed.
That may ease liquidity constraints, but it’s terrible news for a bank’s profitability:
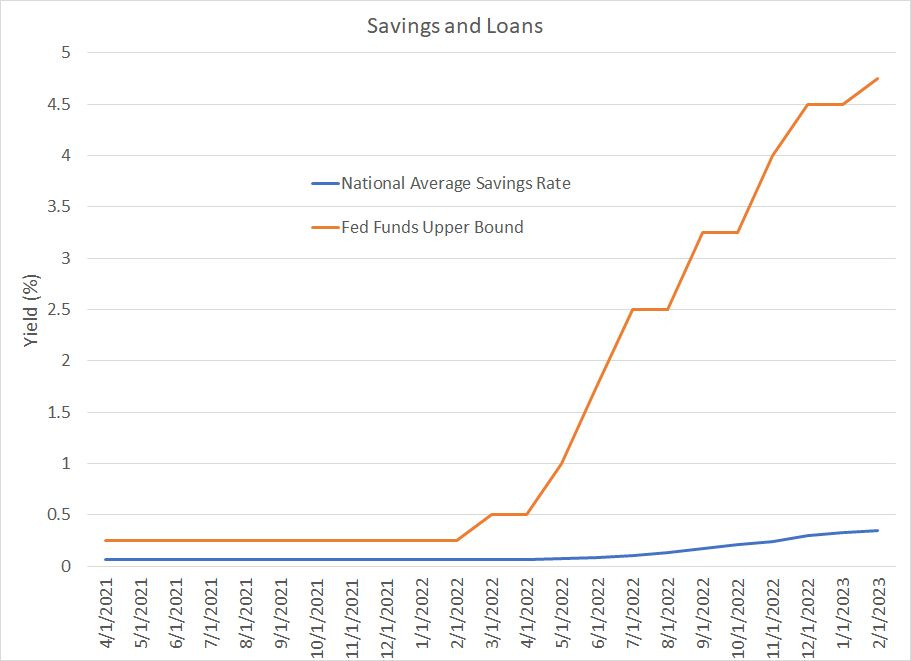
Source: Bloomberg
The blue line on this chart is that average interest rate banks pay on saving accounts in the US since April 2021 while the orange line is the upper bound of the Fed Funds target rate over the same time period.
As you can see, two years ago banks offered next to 0% yields on savings accounts, but that was reasonable because interest rates were so low. Today, the Fed Funds rate is 4.75% and the average savings yield is still 0.35%.
So, consider what’s happening – the banks are losing deposits on which they pay 0.35% and replacing those liabilities with loans from the Fed on which they pay 4.75%. That’s an expensive proposition – even if the FDIC were to extend insurance to all deposits or raise their limit to a higher level of $1 or $2 million, the banks will likely be forced to raise the rates they pay depositors. After all, you can earn around 4.57% on a 3-monthTreasury Bill and that’s guaranteed by the federal government.
Banks are in the business of taking in deposits on which they pay a low rate of interest and making loans to consumers and businesses that pay a higher rate of interest. The difference between the money they pay for capital and the interest received on loans is the net interest margin (NIM).
So, if regional banks have to pay up for capital, whether it’s because they pay the Fed a higher rate of interest on loans or they’re forced to jack up yields on accounts to attract new depositors, profitability gets squeezed.
Again, do you really think a regional bank facing an epic profit squeeze like that is going to try to accelerate lending to consumers and businesses?
The flip side of this coin is that while the regionals are shedding deposits, the big banks are likely picking up deposits and that’s showing up in the form of new reserves at the Fed. These reserves are what’s known as high powered money, and an expansion in reserves is a key conduit to expand credit through the economy.
So, it’s tempting to assume rising reserves will result in an expansion of credit from large banks to help soften the blow of falling credit from regional and smaller institutions. In effect, regionals loss is the GSIB’s gain.
However, that’s also unlikely:

Source: Bloomberg
This chart is from a second weekly report from the Fed called H.8 “Assets and Liabilities of Commercial Banks in the United States,” which is released after the market close (around 4:15 PM ET) on Fridays.
In particular, this chart shows the total change in loans and leases from domestically chartered US financial institutions since January 1, 2020 divided between large banks (the 25 largest) and small (the other roughly 850 banks covered in the release).
As you can see, new lending from smaller banks has expanded at a faster pace since late last year relative to the larger banks – these regionals have been the source of more credit creation generally lately and large banks loans and leases have stagnated since late 2022. That’s partly due to greater regulation of larger banks, requiring more capital and more strict stress testing regarding loan losses amid economic downturns.
Quite likely, that’s also due to the nature of their customer base in that regionals have tended to be more important lenders to small and mid-sized businesses, which can’t sell bonds to raise capital as larger companies can.
So, my point is that transferring deposits from regionals to GSIBs doesn’t imply a transfer of lending activity from small to larger institutions.
In addition, of course, banks of all sizes have traditionally tightened credit standards when the economy is at risk of recession – and that remains by a huge margin, the most likely outcome for the US.
One more point to keep an eye on.
This commercial bank data is one week delayed relative to the H.4 data covering the Fed’s balance sheet. For example, last week the central bank’s H.4 report included data on the Fed balance sheet as of March 15th and it was released on the 16th at 4:30 PM. The H.8 report, in contrast, was released on Friday the 17th, but only included data through March 8th.
While that might seem inconsequential, I believe it’s actually very important right now. That’s because while the increase in the size of the Fed’s balance sheet garnered a lot of attention last week and led to plenty of pundits claiming the central bank had restarted QE, we actually only have half the picture.
While we know what’s happened at the Fed since this crisis kicked off around March 8th, we don’t know yet for certain what’s happened at the commercial banks because the data released on Friday is only good through March 8th, before the government’s crisis response.
I do believe the bigger picture will become abundantly clear after the market close on Friday – the H8 report showing commercial bank assets and liabilities (deposits) through March 15th will quantify and lay bare the extent of deposit flight from small to large banks.
I know this discussion might seem esoteric, but I believe it’s crucial to understanding what’s happening in markets right now. I’ll leave you with two main takeaways from all this:
1. The increase in the Fed’s balance sheet last week is a sign of deposit flight from small regional banks to banks like JP Morgan and Bank of America, it’s NOT, as some have claimed, a new round of quantitative easing.
2. The government may be bailing out banks and uninsured depositors, but that’s not providing any new stimulus for the US economy. Indeed, it’s a sign of weakness and raises the probability of recession this year.
DISCLAIMER: This article is not investment advice and represents the opinions of its author, Elliott Gue. The Free Market Speculator is NOT a securities broker/dealer or an investment advisor. You are responsible for your own investment decisions. All information contained in our newsletters and posts should be independently verified with the companies mentioned, and readers should always conduct their own research and due diligence and consider obtaining professional advice before making any investment decision.