


2025: The Year of Natural Gas
US liquefied natural gas (LNG) export capacity is surging...

Editor’s Note: I am not making any changes to the FMS Model Portfolio this week; however, I am recommending you take action on one of our options trades in the FMS Options Trader Portfolio in iShares China (NYSE: FXI) call options.
Paid-tier FMS readers can see all the details of this recommendation towards the end of this issue.
And, if you’re interested in a 30-day free trial to the paid tier, including access to both the longer-term model portfolio and the FMS Options Trader Portfolio, it’s still on offer for a limited time via this link:
—EG
January was far colder than average across much of the US.
I track US weather conditions using Heating Degree Days (HDDs), a measure of average temperatures compared to a 65-degree Fahrenheit baseline – the more HDDs the colder the weather.
According to NOAA, the population-weighted national average for January 2025 shows 975 heating degree days compared to a long-term average of 917 and just 875 one year ago in January 2024. So, January of this year was about 6.3% colder than average and 11.4% colder than last year.
Dive a bit deeper into the data and it’s even more impressive.
Looking at the US national average based on consumers using electric heating, there were 801 heating degree days in January, which compares to the long-term average of about 730 (roughly 9.7% colder than average). Last year, NOAA reports we only had 714 heating degree days on this basis, so January 2025 is around 12.2% colder than January 2024.
Obviously, colder weather drives higher natural gas demand whether that’s in the form of direct natural gas heating or electric; in the month of January 2024 (a year ago) natural gas accounted for approximately 42.1% of total US power generation.
However, the supply side of the equation is arguably even more important:

Source: Energy Information Administration
This chart shows total monthly US natural gas production back to January 2020. This data series is released with a significant lag, so we won’t have the actual data for January 2025 for some time.
However, as you can see, there are several examples of weather-driven supply disruptions over this period, headlined by the extreme cold snap in February 2021 that gripped large swathes of Texas, Oklahoma and Louisiana. Indeed, according to the Energy Information Administration (EIA), the February 8 to 17th cold snap that year was to blame for the largest-ever one month decline in US natural gas production.
The easiest way to quantify this impact is to simply look at the weekly gas storage reports released by EIA:
Source: Energy Information Administration
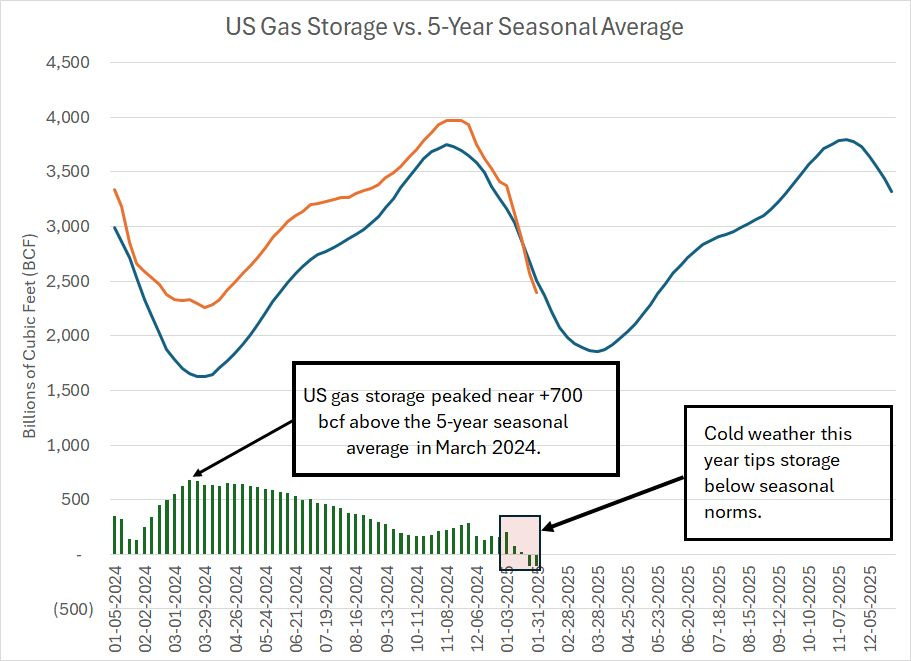
This chart shows the level of natural gas in storage across the US as an orange line and the 5-year seasonal average as a blue line. The green columns below my chart represent the current level of storage compared to the 5-year seasonal norm with a positive number indicating storage above normal.
As of the most recent weekly report, US gas storage is 111 billion cubic feet below the 5-year seasonal average down from a surplus of nearly 700 billion cubic feet in mid-March of last year.
So, there is an impact from extreme cold; however, it’s important to understand cold weather has NOT been the most important driver of normalizing gas storage figures since last spring.
Not even close.
Just consider that through the current heating season as a whole, including the month of January 2025, US population-weighted heating degree days stand at 2,441 compared to 2,656 in a normal year, about 8% warmer than the long term average, albeit colder than the 2023-24 season.
Yet, at the end of December 2024, despite the warm start to heating season, US gas storage was only 150 bcf above the 5-year seasonal average, down from 700 bcf above average earlier in the year.
So, clearly there’s something more important going on than just cold January weather.
Producer Discipline
This might come as a bit of a shocker for those of you who followed the energy commodity markets through the shale boom years of (roughly) 2009 - 2019.
In those days US exploration and production (E&P) stocks became (in)famous for chasing realizations — every time oil and/or gas prices rose, they’d boost CAPEX and try to grow production to take advantage of higher pricing.
That quickly resulted in a surge in shale supply (usually with about a 6-9 month lag), and downward pressure on commodity pricing. The vicious cycle repeated time and again, for natural gas and then in the oil market once Saudi Arabia and OPEC “gave up” on supporting crude prices — any by extension financing US shale production — in late 2024.
At the time, I was often asked why shale producers would do something so self-destructive.
My answer was pretty simple: Up until as late as 2016-17 that’s what shareholders wanted.
For much of the shale production boom years companies were actually rewarded for growing production — barrels out of the ground — in the form of higher stock prices, which provided currency for further growth. If you spent any time at industry conferences in those years as I did, you probably hard talk about metrics like growth in barrels of oil equivalent production per share — that sort of boomtime thinking was what drove relative performance in energy for years.
(It all rhymed with the sort of “New Economy” metrics investors and Wall Street dreamed up to justify extreme valuations in the Nasdaq back in the late 1990s.)
But the important point isn’t what happened 5 or 10 years ago, but what’s happening today.
And since the 2020 commodity price bust — a year or two before that for some of the bigger shale E&Ps — the industry has found discipline for the simple reason that most E&P investors don’t want production growth, they want free cash flow.
Or, to be more direct, shareholders want what free cash flow facilitates — that’s return of capital in the form of shareholder-friendly moves like dividends, share buybacks and paying down debt to transfer enterprise value from bondholders to shareholders.
The biggest and far most important driver of gas storage normalization has been capital discipline on the part of US shale producers as we’ve covered in this service over the past few years. Amid the low-price environment that prevailed through much of last year, most US gas-focused shale producers announced plans to cut capital spending (CAPEX), drilling fewer new wells and dropping drilling rigs.
Others announced they would build drilled, uncompleted wells, known by the acronym “DUCs.” A DUC is a shale well that’s been drilled but has yet to be completed – that means fractured and put into production.
The idea is that new shale wells produce at a rapid rate when they’re first completed; it doesn’t make economic sense to put wells into service, producing a rush of new production, when gas prices are weak. So, by building DUCs, producers are essentially leaving resources in the reservoir with plans to fracture and put those wells into production when commodity prices are healthier.
Some producers are experimenting with what are known as deferred turn-in-lines or “DTILs.”
TIL is an acronym for “turn-in-line,” a term that refers to the final process of allowing gas from a new well to flow into pipelines for transport to market.
Simply put, a deferred TIL or “DTIL” represents a well that’s been drilled, fractured and is ready to be placed into production. These wells are several stages closer to production than DUCs and can therefore be activated more quickly and with minimal incremental capital investment.
Regardless, the supply-demand balance for natural gas today looks far healthier than it did just six months ago and, as a result, front-month gas prices have improved significantly from multi-year lows under $2/MMBtu at times last year to over $4.00//MMBtu at one point in January 2025.
However, while weather conditions and weekly gas storage reports are crucial datapoints if you’re trading gas futures, they’re only a small piece of our bullish longer-term case for natural gas producers and other stocks leveraged to our “Year of Gas” theme.
Forget the Front-Month: Follow the Curve
Rather than tracking the front month price of natural gas it’s more important to watch the futures curve:

Source: CME
This chart shows the NYMEX gas futures curve from February 2025 (the front month until late January) through June 2027 – it’s a graphical representation of natural gas futures priced for delivery each month for the next few years.
Short-term weather-related news primarily drives changes in short-term natural gas futures prices – the price of gas for delivery over the next 3 to 6 months or so.
In this case, front-month gas futures prices were trading around $3.25/MMBtu in the middle of December. Then, as weather models showed rising probability of a severe cold snap by mid-January, those front-month futures began to jump. On January 16th, the growing drumbeat of “polar vortex” hype pushed front-month gas as high as $4.33/MMBtu intraday, a level we haven’t seen since late 2022, early 2023.
That’s a 30%+ price jump in a month.
Since then, prices retreated to around $3.40/MMBtu in late January at the front of the curve (February 2025 futures), a decline of around 22% over a period of roughly two weeks. Now, the March futures represent the front-month for gas, trading at a little over $3.40/MMBtu.
These extreme price moves, the subject of endless discussion in the financial media, are next-to-meaningless for energy stocks.
The blue line on my chart above represents the futures curve on January 16th at the market close, the recent peak for front-month gas futures prices. Meanwhile, the orange line represents the futures curve based on intraday trading on Wednesday January 29th just before the front month flipped to March futures.
The first point to note is the drop in gas futures prices in mid-to-late January was mainly concentrated on gas futures for delivery over the next 3 months and the impact fades as you move further into the future.
Let’s talk specifics.
The H2 2024 calendar strip – the average price for the 6 futures contracts expiring in the second half of 2025 -- hovered around $3.92/MMBtu in late January compared to $4.23/MMBtu when front-month futures peaked on January 16th. The strip for 2026 – all 12 months of next year – was around $3.92/MMBtu in late January compared to $4.09/MMBtu on the16th, a next-to-meaningless $0.17/MMBtu change in one of the most volatile commodities you’ll encounter.
The real story here is the change in the calendar strip for gas over the next two years compared to the past 6 quarters:

Source: Devon Energy, CME
This chart shows the historical average price of Henry Hub natural gas (the basis for the NYMEX-traded futures) for each quarter back to Q1 2022. I’ve also included the calendar strip price for every quarter out to Q2 2027.
US gas prices spiked to a quarterly average price over $8/MMBtu back in 2022 in the months following the Russian invasion of Ukraine. However, prices collapsed into early 2023 and remained depressed, averaging around $2.30/MMBtu from Q2 2023 through Q3 2024.
In Q4 2024, prices began to step higher, but the real shift in the strip starts in Q3 2025 – the second half of this year—as the current calendar strip is around $3.74/MMBtu for Q3, $4.09/MMBtu for Q4 and $4.29/MMBtu for Q1 2026.
All told, the current futures curve for Q1 2025 (the current quarter) through Q2 2027 is close to $3.80/MMBtu, up about 65% from the average that prevailed from Q2 2023 through Q3 of 2024. That’s a big jump in average gas prices.
These calendar strips aren’t just market-derived “predictions” of future gas prices.
The E&Ps (producers) I favor tend to hedge a significant portion of their quarterly gas production; more on that in just a moment. These calendar strips are a good indication of the prices a producer could lock in via hedges today.
That brings us to this:
What’s Driving the Strip?
As we just outlined, the weather is often overrated as a driver of value in natural gas producers because the impact of winter cold or extreme summer heat is generally confined to near-term futures contracts.
Certainly, heating degree days in January 2025 can be expected to have little or no impact on the natgas supply-demand balance or, by extension calendar strips, in Q1 and Q2 of 2026.
Here’s the biggest catalyst for prices this year in our view:

Source: Energy Information Administration
The US started significant exports of liquefied natural gas (LNG) in early 2016 – this chart shows total exports in millions of cubic feet per day since Q1 of that year.
Back in 2022, we spoke to a lot of investors excited about the potential for the US to dramatically increase LNG exports to take advantage of extreme spikes in European and Asian gas price benchmarks following disruptions of Russian exports in Q1 2022. However, we believed at that time the market was too excited about LNG, because the US was already bumping up against its maximum export capacity in the spring of 2022.
LNG export terminals take years to permit and build and there are significant up-front capital costs. Until December 2024, the last LNG export project to enter service was Calcasieu Pass in Louisiana. The first 9 LNG trains at this facility started commercial service in May 2022, Trains 10-18 followed with an in-service date of September 2022. The total baseload capacity for the entire project was 1.32 bcf/day, taking baseload US export capacity to around 11.5 bcf/day with peak capacity at 14.0 bcf/day.
(In practice, that means US export capacity was limited to around 12 to 12.5 bcf/day as a long-term average assuming all liquefaction terminals were operational).
By March 2022, even as gas prices started to spike higher, the US was already exporting more than 12.1 bcf/day. And, by the summer of that year, a fire and prolonged outage at the Freeport LNG facility in Texas disrupted the US export story for more than 6 months.
Bottom line: There was no way for US producers to export more gas to take advantage of higher global prices in 2022 because all existing, operable capacity was close to fully utilized.
That’s changing in a big way this year.
In December 2024, phase 1 of the Plaquemines LNG facility went in-service and will ramp up to commercial exports this quarter at a baseload rate of 1.3 bcf/day. Phase 2 of the project is then set to go online by Q3 2025, adding at additional 1.30 bcf/day of baseload capacity.
Meanwhile, the Corpus Christi Liquefaction project went in-service in January 2025 and has a baseload capacity of 1.32 bcf/day.
Exxon’s Golden Pass facility in Texas, delayed by the bankruptcy of one of the contractors on the deal last spring, is now due to go in-service by the first half of 2026 with capacity of 0.68 bcf/day. Two additional phases of the same project are due for start-up in the second half of 2026 and early 2027 respectively.
Simply put, after years of zero growth in US export capacity, almost 4 billion cubic feet per day of new LNG export capacity is either already in-service or will enter service by Q1 of 2026.
And, just remember, new LNG terminals start pulling in feed gas several weeks before delivering their first commercial cargoes as equipment and pipelines are tested. So, we’re already seeing incremental gas demand from projects placed in-service in late 2024 and early this year and that will continue to ramp higher as the new terminals start producing commercial cargoes.
That’s a near one-third increase in US LNG export capacity this year alone.
In absolute terms, US LNG export capacity has never grown at a faster pace than it will between Q4 2024 and Q1 2026.
As we move through 2026 (next year), the US should add around 1.36 bcf/day of additional export capacity followed by a whopping 3.7 bcf/day in 2027. And this list ONLY includes projects that have already received permits and are currently under construction.
Indeed, based only on US projects that are under construction, baseload LNG capacity is expected to expand from a baseload level of 11.5 bcf/day in late 2024 to over 21 bcf/day by 2028, an increase of 85% over a 4-year period.
Flip back and look at the futures curve we posted earlier, and you can clearly see the expected demand pull of increased LNG exports starting around the middle of this year – this accounts for the step-up in the calendar strip from $3.34 in Q2 2025 to $3.74 in Q3, $4.09/MMBtu in the final quarter of 2025 and $4.29 in Q1 2026.
The obvious question is how to benefit from this “Year of Natural Gas” theme:
Keep reading with a 7-day free trial
Subscribe to The Free Market Speculator to keep reading this post and get 7 days of free access to the full post archives.