

3 Signs of Rising Recession Risk
3 Signs of Rising Recession Risk
Don't be fooled by strength in lagging indicators

Following last week’s better-than-expected May Employment Report, and recent strength in the S&P 500, I’ve received a few questions from readers asking if my call for a US recession by Q3 2023 remains valid.
After all, while the labor market is weakening on the margin, the unemployment rate is still close to the lowest since the late 1960s and consumer spending, particularly on services, remains solid.
Since these are the largest components of the US economy, it’s logical to suppose an economic soft landing remains a possibility.
However, don’t be fooled, market trends and leading economic data still point to spreading economic weakness this year and high probability of recession. Let’s take a look at 3 specific trends I’m watching closely:
Market Breath is the Worst…EVER
I’ve written about the stock market’s poor breadth on several occasions in the past few weeks including in my May 23rd piece “Party Like It’s 1999.”
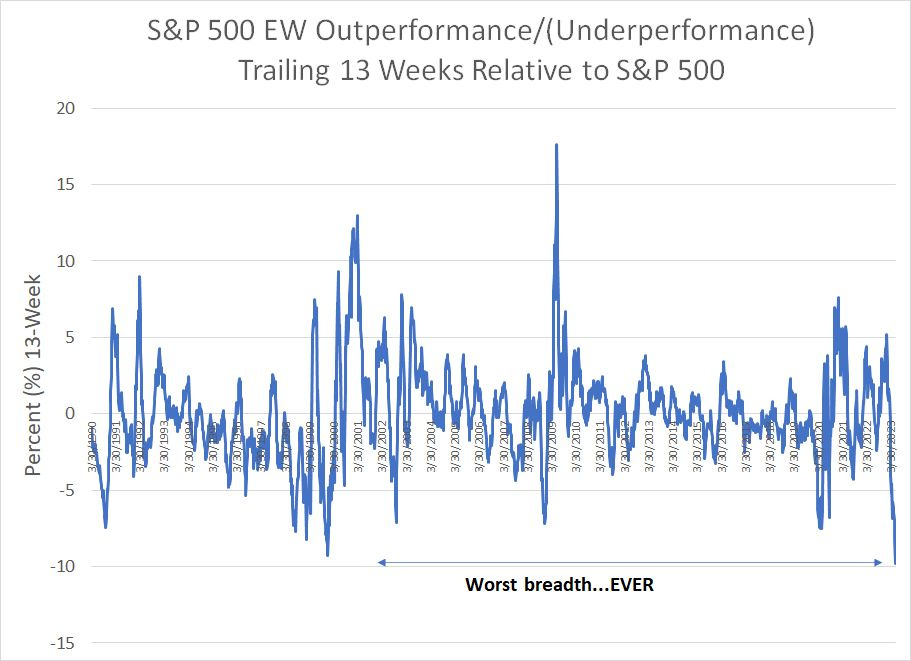
Since then, a handful of readers have asked me if the broad-based rally on June 2nd changes that picture. I must admit I was a little surprised when I re-calculated this chart:
Source: Bloomberg
This chart shows the relative performance of the S&P 500 Equal Weight to the S&P 500 over the trailing 13 weeks (one-quarter).
As a reminder, the S&P 500 EW weights each component of the index equally (about 0.2%) while the S&P 500 weights by market capitalization (company size). So, for example, the largest 10 stocks in the S&P 500 have a more than 30% weight in the traditional S&P 500 compared to a roughly 2% weight in the S&P 500 EW.
On this basis, we’ve actually moved from the worst breadth in 24 years to the worst breadth in the history of the S&P 500 Equal Weight Index (since 1989). Over the past 13 weeks ended June 2nd, the S&P 500 Equal Weight Index has underperformed by just shy of 10 percentage points, which breaks the erstwhile record of 9.3 percentage points of underperformance set on the 13 weeks ended December 24, 1999.
On one hand, December 24, 1999 did not mark the top of the late 1990s bull market; however, it marked the beginning of the end of that rally. And the downside risk dwarfed the upside potential at the end of 1999 -- the S&P 500 rallied an additional 5% to its March 2000 peak before plummeting more than 50% to its late 2002 lows.
What About Oil?
Over the weekend, Saudi Arabian Energy Minister Abdulaziz bin Salman al-Saud shocked markets by announcing a surprise unilateral Saudi production cut of an additional 1 million bbl/day starting July 1st.
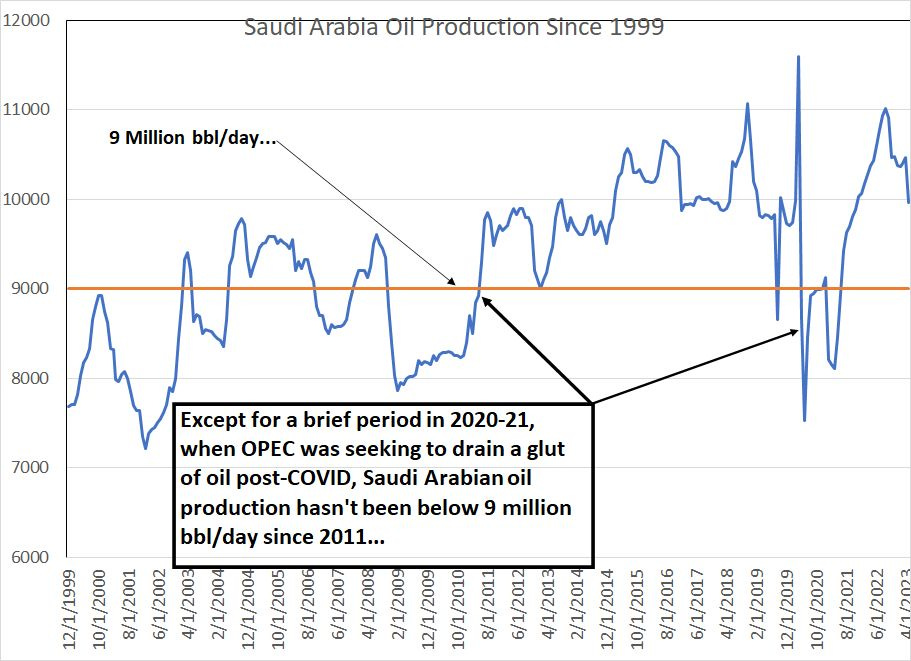
Such a move would bring Saudi oil output down to under 9 million barrels per day in July from an estimated 9.96 million in May:
Source: Bloomberg
This chart shows estimates monthly Saudi oil output since the end of 1999 and I’ve labeled a production level of 9 million bbl/day as a horizontal orange line.
As you can see, Saudi cut production below 9 million bbl/day in 2020-21 amid a global glut caused by government-imposed economic lockdowns and travel restrictions amid the initial COVID outbreak. However, excluding that brief period in 2020-21, OPEC production hasn’t been consistently below 9 million bbl/day since 2010-2011.
That’s a significant unilateral cut from the most reliable OPEC producer and the one country in the cartel with the best record of following through on threatened production cuts.
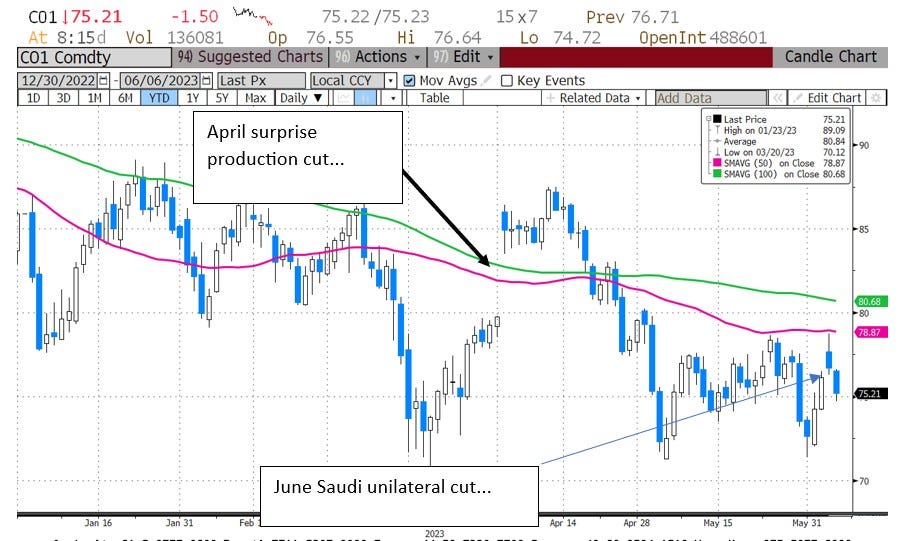
A dramatic, unexpected production cut like that “should” have catalyzed a significant rally in Brent Oil prices since last Friday’s close. And Brent did close higher on the session, rallying from $76.13/bbl on Friday to settle at $76.37/bbl on Monday.
But that’s less than a 0.5% rally and Brent ended the day near the lows of the session and well below its gap-higher open price of $77.68/bbl:
Source: Bloomberg
As you can see, this morning, Brent oil prices are down almost 2%, so oil has given back all its gains from the Saudi surprise cut and then some. Contrast that muted reaction with Brent’s 6.5% one-day jump when OPEC announced a surprise production cut back in early April.
As I’ve often said, the market’s reaction to news is more important than the news itself – the fact that oil barely moved on what would normally be considered very bullish news doesn’t bode well.
What’s particularly interesting about this is the supply-demand balance in the oil market looks to be tightening as we enter the second half of this year. Even before the Saudi surprise, the International Energy Agency (IEA) predicted a combination of a seasonal rise in demand and restrained supply would leave the global oil market undersupplied to the tune of 1.5 million bbl/day in the second half of this year.
OPEC’s latest monthly oil market report shows global demand reaching 103.25 million bbl/day in Q4 2023, against non-OPEC liquids production of 67.44 million bbl/day and OPEC natural gas liquids (NGLs) output of 5.43 million bbl/day.
That means that OPEC needs to produce around 30.4 million bbl/day of oil in Q4 2023 to keep the oil market balanced per their own estimates. This compares to OPEC output of around 28.260 million in May 2023 and that’s before Saudi’s 1 million bbl/day cut. While the Saudi surprise cut is only slated to last 1 month – through July 2023 – the Kingdom has said it might extend that reduction depending on how oil markets behave.
Optimism about growth in global oil demand from IEA and OPEC appears well-founded based on recent data. In April, China’s apparent oil demand surged to a record high over 15 million bbl/day:

Source: Bloomberg
The Chinese government’s draconian “Zero COVID” policies kept a lid on oil demand from early 2020 through to late 2023. However, the long-anticipated economic reopening appears to be behind a surge in demand as we enter the all-important summer months.
Meanwhile, the major destabilizing force in global oil markets over the past 15 years isn’t a significant factor at this time:
Source: Bloomberg
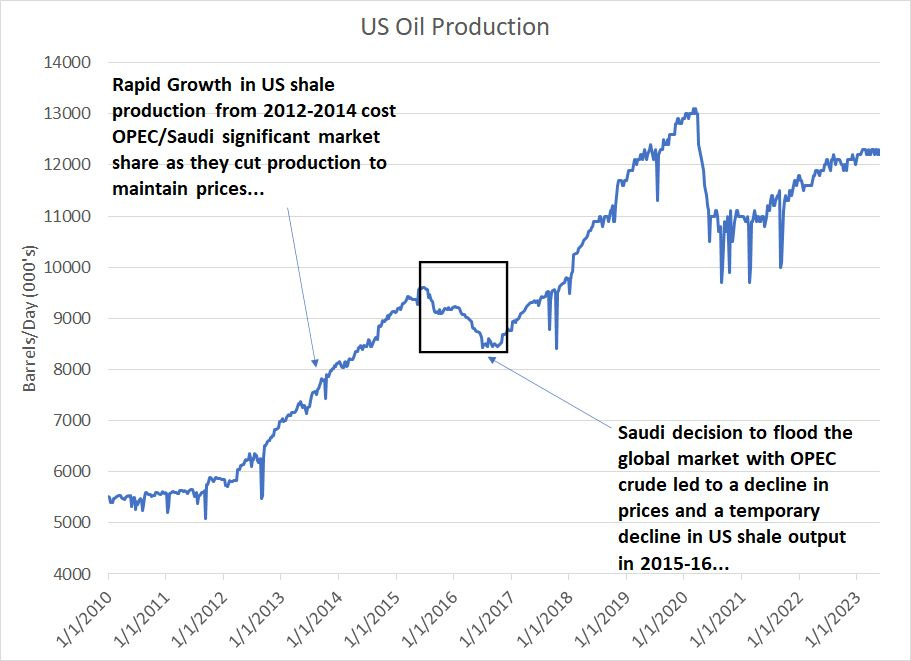
Rapid growth in US shale output from 2012 through 2014 forced Saudi and the rest of OPEC to restrain their own output to maintain prices around $100/bbl. OPEC consistently lost market share to shale in this era and sky-high prices encouraged even more frenetic drilling activity and production growth.
When Saudi Arabia gave up on this fruitless strategy in late 2014 and flooded the oil market with OPEC crude, the resulting price collapse did bring about a short period of falling US output in 2015-16.
However, by the second half of 2016 it was off to the proverbial races again with soaring US oil production frustrating OPEC’s efforts to regain control of global oil supply and prices.
Finally, following the COVID lockdown recession and commodity collapse of 2020, US shale producers have grown demonstrably more disciplined. While US oil production has risen from its 2020-21 lows, output remains below the pre-COVID peak and drilling activity remained restrained even amid last year’s commodity price spike.
Certainly, a steady erosion of market share due to rising shale output isn’t a major threat to OPEC’s supply machinations at this time.
So, what exactly is causing oil prices to fall despite Saudi efforts to put a floor under prices?
The only logical explanation in my view is that markets are forward-looking and see demand falling well short of estimates in H2 2023 leaving the market looking looser than OPEC/IEA currently forecast. And, historically, the degree of demand destruction that would be needed to make these numbers balance only occurs with the global economy in recession.
Canary in the Coal Mine
You’ve probably heard the term “canary in the coal mine.”
Basically, before miners had advanced gas monitoring and safety equipment, they’d carry a caged bird into the mine with them. If the canary showed signs of distress (or worse), that could be a signal of a dangerous buildup of gases like carbon monoxide and a signal for workers to immediately exit the mine.
However, this only works because small birds are more sensitive than humans to the build up of toxic gases – if canaries and humans both showed signs of distress or carbon monoxide poisoning simultaneously, there’d be no early warning for the miners.
Similarly, when trying to get a read on the health of the economy, you don’t want to watch the most stable columns of growth – services, headline payrolls data and consumer spending – you want to watch the most volatile.
These volatile components of economic health, like manufacturing activity, are like the canary in the coal mine because they weaken months before there’s significant signs of trouble ahead in other economic data.
I’ve written about this in past issues. In the March 7 issue of The Free Market Speculator “Services and Manufacturing,” I explained why I regard the ISM Manufacturing Index as a more important indicator to watch that the ISM Services Index even though services are a much larger chunk of the US economy.
That’s why this week’s ISM Services report was so interesting:
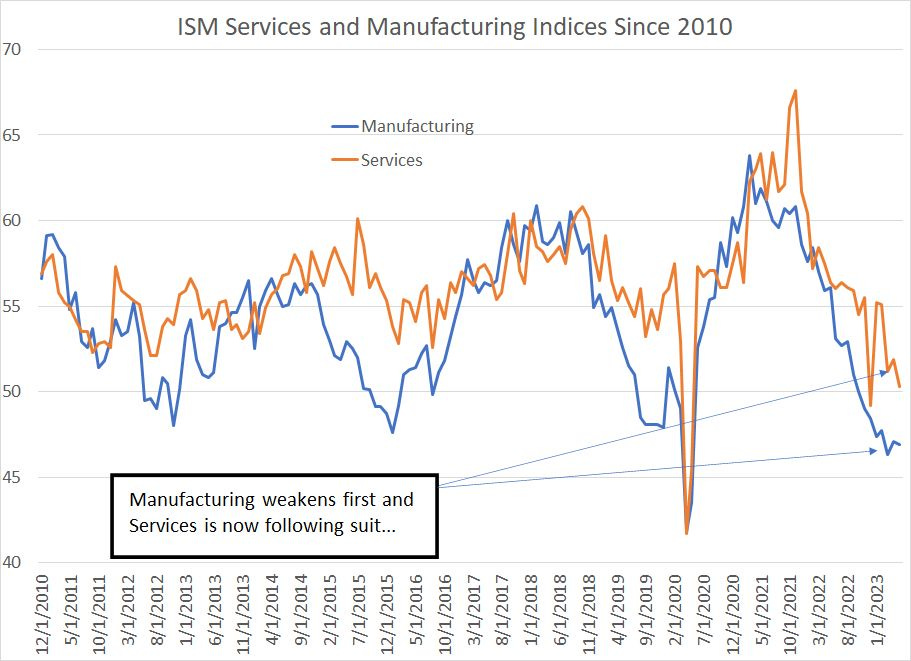
Source: Bloomberg
This year, the ISM Manufacturing Index has fallen close to levels historically associated with US recessions; yet, ISM Services has remained buoyant and, as recently as February remained above 55, a level normally associated with trend to above-trend US economic growth.
That’s started to change and in May, ISM Services dropped to 50.3, just above the 50 level that divides expansion and contraction. Look at past slowdowns for the US economy such as 2012, 2015-16 and the 2020 Recession and you’ll see that this is absolutely normal – manufacturing activity (the blue line) usually weakens some 3 to 6 months ahead of services.
And, if services weakens enough – falling into the mid to upper 40s – it’s very difficult for the US to avoid recession.
Bottom line: Focusing on labor market data and consumer spending is a bit like driving down the highway at 80 miles per hour while staring at the road 10 feet in front of your car.
DISCLAIMER: This article is not investment advice and represents the opinions of its author, Elliott Gue. The Free Market Speculator is NOT a securities broker/dealer or an investment advisor. You are responsible for your own investment decisions. All information contained in our newsletters and posts should be independently verified with the companies mentioned, and readers should always conduct their own research and due diligence and consider obtaining professional advice before making any investment decision.