

A Bear in Bull's Clothing
A Bear in Bull's Clothing
Don't take the market rally at face value

Microsoft (NSDQ: MSFT) holds a 6% weight in the S&P 500 and a 13.2% weight in the Nasdaq 100, vying for dominance of both indices with Apple (NSDQ: AAPL).
Of course, as most of you are probably aware at this point, Microsoft reported better-than-expected quarterly revenue and earnings growth in its fiscal Q3 2023 (calendar Q1 2023) Tuesday evening, soaring to close about 7.25% higher on the session to the highest level in over a year.
However, here’s what’s shocking: Despite strong earnings from Microsoft, the S&P 500 closed Wednesday’s session down about 0.4% while the Nasdaq 100 gave up more than half its intraday peak gain of 1.63% to close higher by just 0.61%.
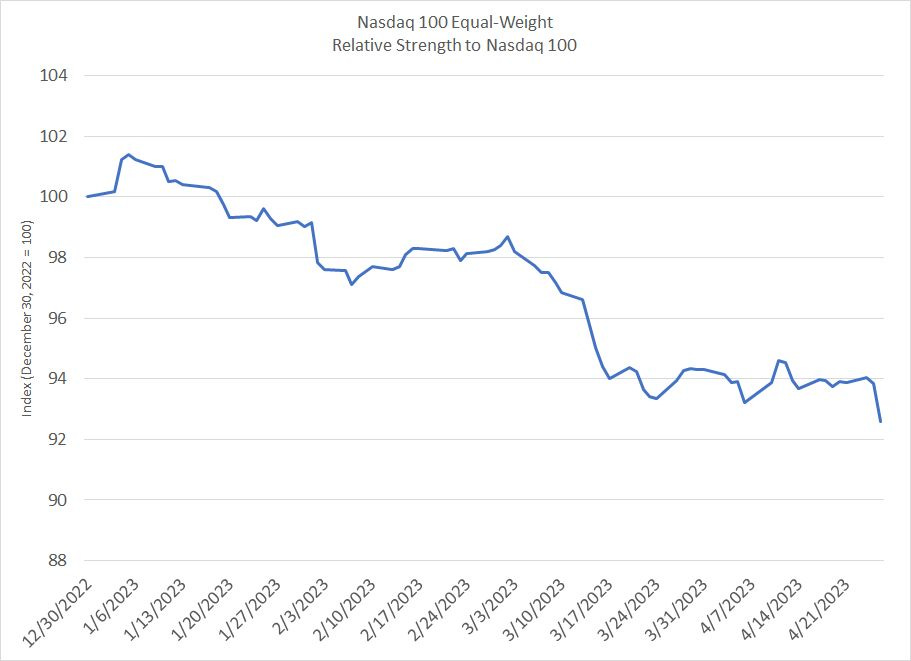
The Nasdaq 100 Equal-Weight Index contains the same stocks as the Nasdaq 100, but all index components are weighted equally, rather than by market capitalization. Thus, Microsoft and Apple carry the same weight as Rivian Automotive (NSDQ: RIVN) and Lucid (NSDQ: LCID), the stocks in the Nasdaq 100 with the smallest market caps.
The Equal-Weight Nasdaq 100 was down over 0.7% Wednesday, continuing its recent stretch of underperformance compared to the Nasdaq 100:
Source: Bloomberg
Year-to-date the equal-weight Nasdaq 100 is underperforming the Nasdaq by around 8 percentage points including dividends. Meanwhile, the S&P 500 Equal weight is up 0.5% in 2023 including dividends (down 0.5% through Wednesday’s close on a price-only basis) compared to a 6.2% percent gain for the headline index.
And then there’s volume:
Source Bloomberg
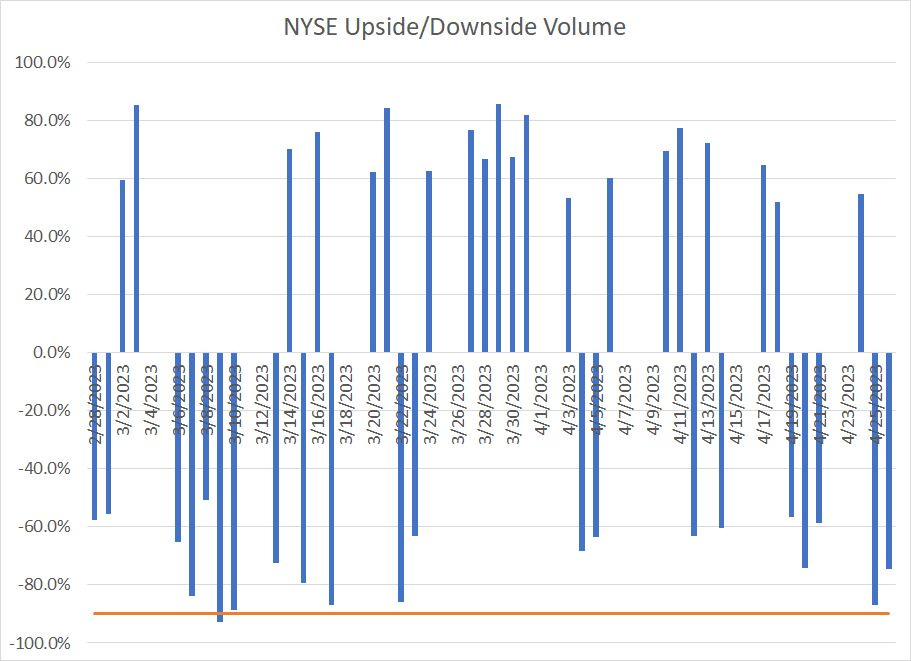
To calculate this chart, I look at total volume traded in NYSE stocks advancing in price divided by total volume on NYSE in both declining and advancing issues. A 75% upside day, depicted as +75% on this chart, would signify 75% of all volume in advancing issues. Of course, a 75% downside day signals the opposite.
Out of the past six trading sessions, five have featured more trading volume in declining issues; Tuesday’s session was a powerful 87% downside day and Wednesday, despite a modest percentage loss for the S&P 500, was still almost a 75% downside day. That means there was a lot of selling under the surface of a stock market largely propped up by a pop in MSFT.
Look, long-time readers know this isn’t the first time I’ve written about the stock market rallying on poor breadth, driven by just a handful of the largest components. And weak-breadth rallies can certainly persist for weeks — even months — before showing signs of cracking.
However, the degree of breadth divergence has moved from week to terrible since March:
Small-Caps are Screaming Recession
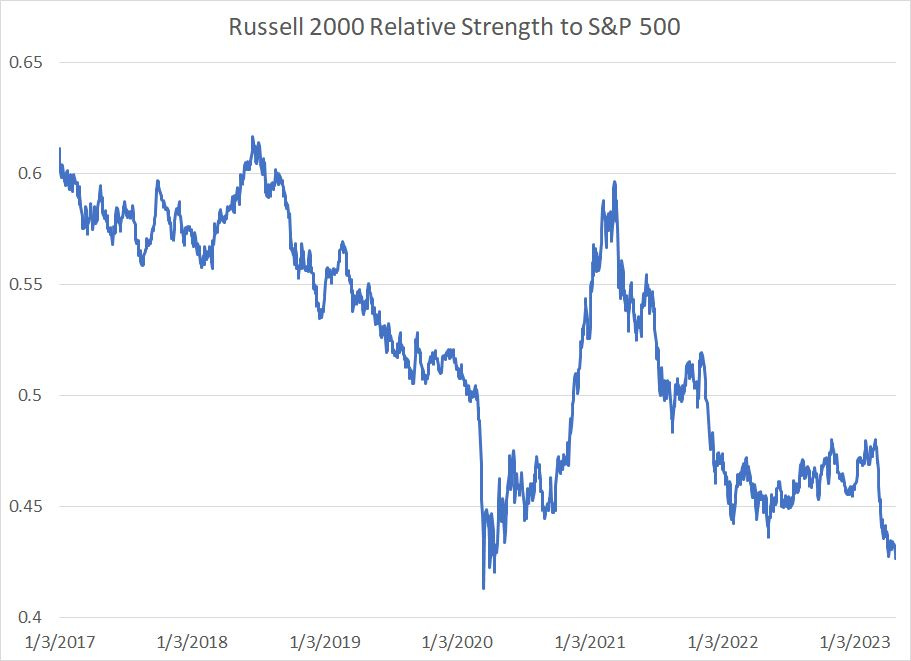
The ratio of the small-cap Russell 2000 Index to the S&P 500 is now approaching the 2020 lows:
Source: Bloomberg
Historically, small-cap stocks in the Russell 2000 are more sensitive to US economic conditions than larger companies in the S&P 500 with more global exposure. Amid all the talk of a soft landing for the US economy earlier this year or even “no landing,” the Russell 2000 trounced the S&P 500 through the first two months of this year, jumping almost 8% compared to 3.2% for the large-cap benchmark.
However, on March 1st, the Russell hit the proverbial wall, falling 8.6% while the S&P 500 rallied 2.9%. And the weakness year-to-date has been broad-based:

Source: Bloomberg
It’s tempting to assume that weakness in the Russell so far this year is a function of its greater exposure to troubled smaller banks and financial stocks.
However, the chart above presents the performance of all 11 economic sector indices in both the S&P 500 and Russell 2000 year-to-date. As you can see the S&P 500 has outperformed in 8 of the 11 sectors; the only exceptions are Utilities, Health Care and Industrials.
The main driver of the big slump in small caps starting in March is likely interest rates.
As I explained in Tuesday’s FMS issue “Earnings Alchemy, Rates and the Nasdaq,” over the long haul the Nasdaq 100 is not negatively correlated to interest rates; however, since 2017 technology, growth stocks and the Nasdaq have developed an inverse correlation.
Simply put, that means these stocks tend to rise, and outperform the S&P 500, when yields on the 10-year US Treasury fall.
The 10-Year Treasury hit a yield of just over 4.05% on March 2nd and has declined to yield about 3.44% today. Similarly, in early March, the Fed Funds futures market priced in a peak Fed funds rate of 5.62% and saw less than 50% probability the Fed would cut rates by January 2024.
Today, the Fed is expected to hike one more time to a range of 5 to 5.25% and the market is pricing in almost 100 basis points of cuts by early next year,
Thus, falling rates, and rising expectations for a Fed pivot by early 2024, have bolstered the Nasdaq over the past two months.
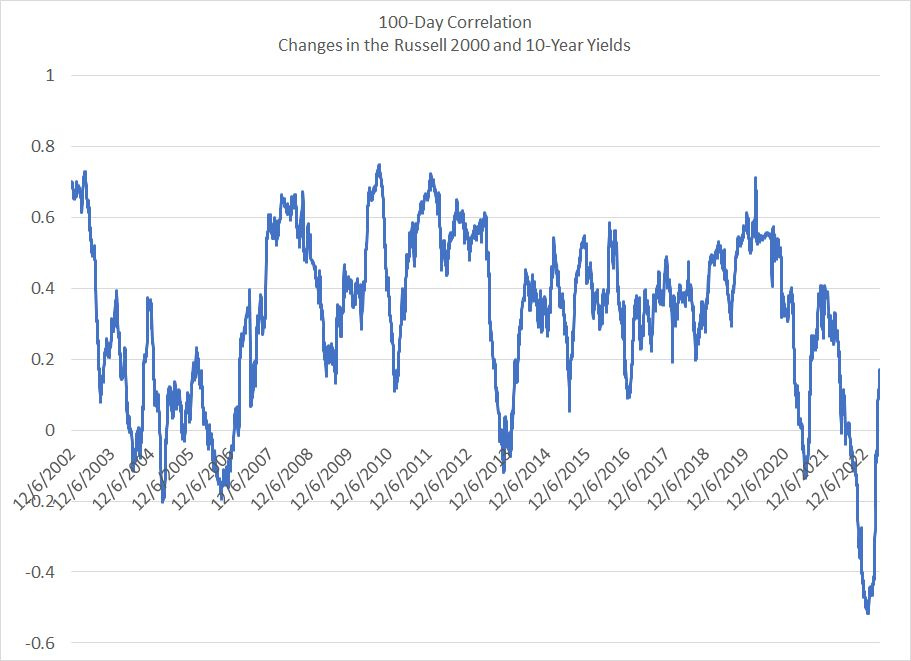
In contrast, the Russell 2000 has generally maintained a moderate-to-strong positive correlation with 10-Year Treasury yields for most of the past 21 years:
Source: Bloomberg
This chart shows the 100-day rolling correlation between daily percentage changes in the Russell 2000 and daily changes in 10-Year government bond yields.
As you can see, small caps are positively correlated to interest rates in most periods and that makes sense – after all, if yields are rising that usually means the economy is strong, which benefits earnings for domestically levered small caps.
Late 2022-early 2023 was an aberration where the correlation flipped sharply negative such that falling yields benefited small-caps. This corresponds to the market’s curious fascination with the potential for a Fed “pivot,” despite the fact that, as I explain in the January 24th issue of FMS “Yield Curves, Recessions and Bear Markets,” Fed pivots are usually bearish NOT bullish for the stock market.
However, the Russell 2000 has flipped back to its traditional positive correlation to yields over the past few weeks – in short, falling yields don’t bode well for corporate earnings and the Russell reflects the recession trade currently underway.
About those Earnings
So far, 188 of the 500 stocks in the S&P 500 have reported quarterly earnings and have been open for at least one full day of trading following their results. Two-thirds of those stocks have beaten Wall Street estimates on the bottom line and almost 82% on the top line.
Last quarter, only 58% delivered a positive surprise on earnings and 69.6% on sales. So, in a sense, you could say that earnings season is off to a great start, or at least a much better-than-expected start.
However, a good rule of thumb to remember is the market’s reaction to the news is more important than the news itself.
In other words, if a company beats estimates and then sells off in the first day of trading after that release, that’s a flashing red warning sign investors were using good news to offload stock or, simply, the good news was already priced in.
Through this prism, earnings season hasn’t been as cheerful:

Source: Bloomberg
As you can see, the aggregate earnings beats for all S&P 500 stocks reporting to date has been 6.54%; however, despite better-than-expected results the average stock has fallen almost 1% in the trading day after reporting earnings.
There are only two sectors of the 11 in the index that have managed to rally post earnings. Industrials have managed a less than 0.2% one-day gain post-earnings and consumer staples — one of the most defensive sectors on the board — have popped 1.45% following aggregate earnings beats of 7.43%.
Finally, while MSFT’s earnings report was undeniably better than Wall Street expected, it wasn’t uniformly bullish:
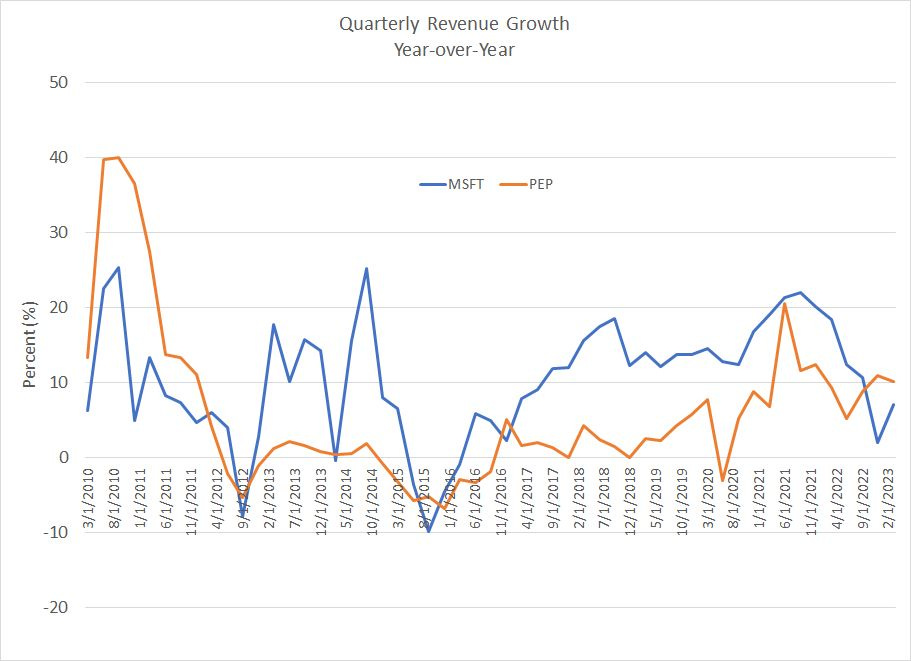
Source: Bloomberg
As this chart shows, year-over-year revenue growth for MSFT has slowed from a cycle peak in the September 2021 quarter of 21.97% year-over-year to 7.1% year-over-year in the most recent release. Indeed, as you can see in my chart above, that’s growth below food and beverage giant Pepsico (NYSE: PEP) in the most recent quarter.
I am not saying MSFT is a bad company — it certainly isn’t — however it’s logical to contemplate whether a company that’s clearly showing decelerating growth, but is trading at 27 times next fiscal year earnings (year ended June 2024), can continue to carry the weight of the entire S&P 500 for long.
DISCLAIMER: This article is not investment advice and represents the opinions of its author, Elliott Gue. The Free Market Speculator is NOT a securities broker/dealer or an investment advisor. You are responsible for your own investment decisions. All information contained in our newsletters and posts should be independently verified with the companies mentioned, and readers should always conduct their own research and due diligence and consider obtaining professional advice before making any investment decision.