

I’d like to take this opportunity to wish readers a very happy July 4th holiday.
Despite the holiday-shortened trading this week, it’s actually a busy week for economic data. The list includes yesterday’s weaker-than-expected ISM Manufacturing PMI and, of course, the widely followed (and often revised) employment report on Friday.
I’ll leave an analysis of the incoming data for a future issue, in this issue let’s reflect on trading in the first half of 2023. Of course, there’s been plenty of volatility along the way, but there’s no denying it’s been an extraordinarily strong first half for the US market with the S&P 500 up 16.8% including dividends and the Nasdaq 100 soaring 39.4%.
The change in investor sentiment from where we were six months ago is downright shocking – lasty year’s vicious bear market is (almost) a forgotten nightmare with the S&P 500 and Nasdaq 100 down less than 7% from where they closed 2021.
Each week I run several screens on the stock market, looking for pockets of strength or weakness and digging into the fundamentals of potential new recommendations.
One screen I run is to examine the relative strength of various economic sectors in the S&P 500 and, of course, global equity markets. What struck me is that even with the stock market seeing dramatic gains year to date – the S&P 500’s first half gain annualizes to 36.8% and the Nasdaq 100 to 93% -- very few sectors within the S&P 500 are actually leading the index higher.
Indeed, of the 11 S&P 500 Economic Sector Indices, only 3 are up more than the S&P 500 as a whole: S&P 500 Information Technology, S&P 500 Consumer Discretionary and S&P 500 Communications Services. Fortunately for the S&P 500, these three sectors currently have a 47.3% combined index weight and are up an average of 37.2% so far in 2023.
Of course, I’ve written about bad market breadth before, but I decided to examine what a very thin and top-heavy rally for the S&P 500 might mean for the second half of this year:
Source: Bloomberg
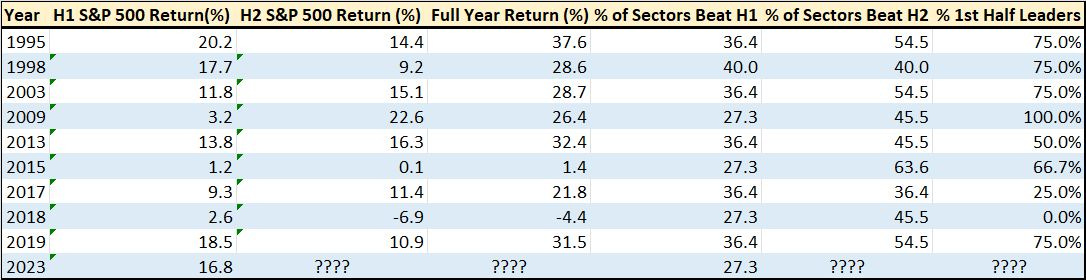
Bloomberg offers data on sector-level index returns dating back to the late 1980s, so I examined market data over the past 33 years. Prior to 2001 there were 10 S&P 500 economic sector indices; later S&P added the S&P 500 Real Estate Index, taking the total to 11 sector indices.
For each year I calculated the total first half return for every S&P 500 second index as well as the S&P 500 as a whole, comparing the returns for each sector index to that of the S&P 500. The years listed on my table fit two basic criteria:
The S&P rallied in the first half of the year.
40% of economic sector indices or fewer generated a total first half return equal to or greater than that of the S&P 500.
For example, in 2023 three of the 11 economic sector indices have beaten the S&P 500 -- 27.3% of sectors outperformed as reported in the column labeled “% of Sectors Beat H1.”
I’ve then reported a series of summary performance statistics for the S&P 500 and various market sectors in the second half of each of these years. Specifically, the table includes the total return for the S&P 500 in the second half of each year, the full year market return, the percentage of S&P sectors that performed better than the market in the second half and, in the final column, the percentage of first-half winners that outperformed in the second half of the year.
Here are some of my conclusions:
First, thin rallies have become more common since the Great Financial Crisis years of 2007-09.
In the first 19 years of this dataset there were only 3 years where the market produced positive first half gains with 40% or fewer sectors leading the broader market average (roughly 16% of all years). In the last 15 years, however, there have been a whopping 7 years featuring first half rallies on poor market breadth (47% of all years).
This is logical.
The Federal Reserve responded to the 2007-09 financial crisis by slashing interest rates to zero and starting multiple rounds of quantitative easing; other major central banks around the world followed suit, to one degree or another.
One consequence of this deluge of easy money was a boost for long duration growth stocks, because low rates boost the earnings multiple investors are willing to pay for distant future earnings. For the same reason, the S&P 500 Information Technology Index grew to become far and away the dominant sector in the S&P 500; simply put, if tech rallies, the broader market can get dragged higher even if most sectors are stalled.
That fits the pattern this year – tech has been on fire in 2023 as have high-profile growth stocks like Amazon.com (NSDQ: AMZN) and Netflix (NSDQ: NFLX), which are major components of the S&P 500 Consumer Discretionary and S&P 500 Communications Services Indices respectively.
Second, when the market rallies on poor breadth in the first half of the year, stocks historically continue to rally in the second half.
This second point surprised me.
However, facts are facts: There are 9 years (excluding 2023) on my table and in eight of those 9 years, the market added to its first half gains in the second half of the year. Further, in only one year out of 9 did the market go on to produce a full year loss and in only 2 of the 9 years was the stock market up less than 20% for the full year.
So, narrow breadth advances that persist through the first 6 months of the year certainly are not bearish for the second half of the year. One minor caveat is that two of the more recent examples – 2018 and 2015 – were weak years for the market that coincided with concerns about Fed policy much as is the case today.
Third, and I think most important, in 7 of the 9 years on my table breadth on this basis improved meaningfully in the second half of the year.
For example, only 27.3% of sectors beat the S&P 500 in the first half of 2009, yet, 45.5% beat the market in the second half. And there’s not a single year on my table where breath was worse on this basis in the second half of the year than in the first half.
Fourth, in a related note, look at the final column on my table and you’ll see that there’s often a significant shift in leadership from the first half to the second half.
On average, only 60% of sectors that led narrow market rallies in the first half of the year went on to outperform in the second half. And, if we only look at the data since 2009, first-half leaders only outperform in the second half of the year a bit over 50% of the time.
Of course, none of this is entirely conclusive – we’re only dealing with a sample size of 9 out of the past 33 years. However, it raises some points I’ll be pondering over the upcoming holiday:
If the market rally is to continue into the second half of this year, market breadth will need to improve, and more stocks and sectors will need to participate.
Based on sentiment surveys I’ve covered in this service, first half 2023 leaders – tech and growth stocks, particularly anything connected to artificial intelligence – are over-owned even as institutional investors aren’t particularly bullish on the S&P 500 as whole. That means the “pain trade” could be underperformance of the first-half winners and the emergence of new leaders, consistent with what we’ve seen in prior years on my table.
Tech and growth stocks are sensitive to Fed interest rate policy, so further signs the Fed is committed to higher-for-longer rates could serve as a catalyst for a shift in market leadership.
From a purely technical perspective, this shift in market breadth is consistent with the nascent strength I’m seeing in some industry groups (natural gas producers is one example).
From an investing strategy perspective, I have serious concerns about a still-likely US recession this year. In cycles since at least the 1920’s, the US stock market usually bottoms before a recession is over, but has never bottomed before a recession even started.
However, stocks can and have rallied in the months just ahead of an economic downturn. Such final “melt ups” usually end in tears (see 1999-early 2000 for an example); however, they can be extremely profitable while they last.
In the model portfolio for the paid tier of FMS, I’ve identified several stocks and markets that look to be assuming the mantle of market leadership into the second half of the year. I won’t recommend chasing momentum favorites like NVIDIA (NSDQ: NVDA); there are plenty of more reasonably valued stocks and sectors that are outperforming the S&P 500 and have defensible fundamental stories.
If you’re not already a subscriber, I am still offering 30-day free trials to The Free Market Speculator paid tier through midnight today (July 4th) by tapping here.
DISCLAIMER: This article is not investment advice and represents the opinions of its author, Elliott Gue. The Free Market Speculator is NOT a securities broker/dealer or an investment advisor. You are responsible for your own investment decisions. All information contained in our newsletters and posts should be independently verified with the companies mentioned, and readers should always conduct their own research and due diligence and consider obtaining professional advice before making any investment decision.