

A Technical Reality Check
A Technical Reality Check
Plus a look at the "other" S&P 500

At first blush, it’s hard to imagine a more bond and stock-bearish monthly Employment Report than what the US Bureau of Labor Statistics (BLS) released Friday morning.
After all, total payrolls jumped 336,000 and private payrolls grew 263,000, well above economists’ consensus outlook for gains of 170,000 and 160,000 respectively. On top of that, BLS revised jobs gains over the past two months higher by +119,000, the first upward revisions to payrolls data so far in 2023.
Right now, all eyes are on the bond market as the extraordinary surge in yields I’ve been writing about in recent updates has been the root cause of the most significant moves in stocks and commodities over the past few weeks.
Certainly, markets’ initial knee-jerk reaction to the September jobs report was about as you’d expect – the S&P 500 and Nasdaq gapped lower and the yield on longer-term Treasuries soared, with the yield on the 30-year reaching an intraday peak of 5.05% Friday morning and the 10-year touching close to 4.89%.
Recall the adage that a market’s reaction to news is more important than the news itself.
When a market receives “bad” news, opens sharply lower, and then rallies through the trading session to close higher, that’s a strong bullish signal. Typically, it means the market is already pricing in a good deal of bad news and some traders have used weakness as a buying opportunity or an opportunity to book profits on short positions.
After trading as low as 4,219.55 shortly after 10 AM Eastern Time in Friday’s session, the S&P 500 rallied to close around 4,308, an intraday move of more than 2%. For the Nasdaq the most was even more impressive with an intraday rally above 3% from intraday low to intraday peak.
Meanwhile, the 5% level for the US 30-Year Treasury yield appears to be an important level to watch:
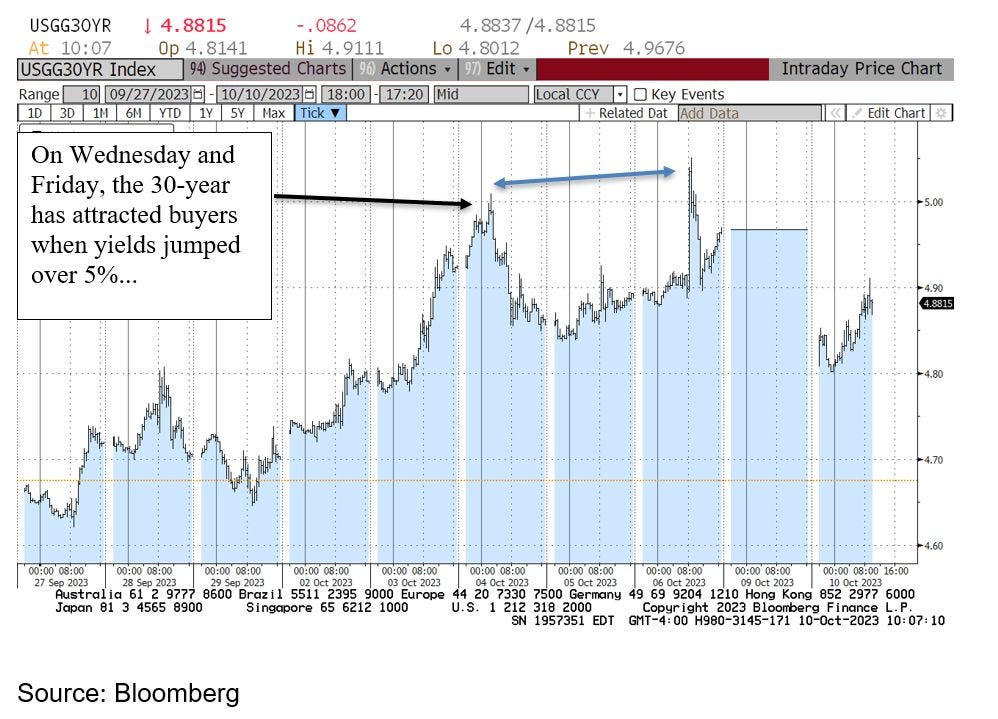
I’ll leave a deeper dive into last week’s employment report to a future issue of Free Market Speculator. Suffice it to say there are issues with the data including the huge gap between household and establishment series datasets, and a further decline in economy-sensitive temporary employment. So, perhaps, the market concluded that the BLS data wasn’t as hawkish as it first seemed.
However, the fact that both stocks and bonds are struggling to push lower despite the strong headline numbers suggests the recent downtrends are getting exhausted.
And, let’s step back to the eve of last Friday’s employment report.
A Technical Reality Check
Heading into Friday’s session stock and bond markets were sitting at critical levels from a technical perspective.
Let’s start with the S&P 500:

Source: Bloomberg
During uptrends, stocks and stock indices like the S&P 500 tend to find support around the 100-day and 200-day simple moving averages depicted as an orange and grey line respectively on this chart. As you can see, last week’s closing low at 4,229.45 and the intraday low around 4,216 are both (just) above that critical 200-day moving average.
Further, note the thick black line I’ve drawn on the chart at around 4,180, which corresponds the early February peak in the S&P 500 as well as the June 2022 highs. That’s a second important support level that’s obvious from a quick scan of the chart.
Amid the confusion and emotion of day-to-day headlines in the mainstream and financial media, I often find it useful to glance at a simple daily chart like this one to cut through all the noise and conflicting narratives.
In this case, listen to the headlines last week and you might be convinced the market is plummeting. Look at the chart, however, and you’ll see a roughly 8% correction in the S&P 500 from its closing peak on July 31st to last week’s closing low, a classic test of multiple, clear levels of technical support.
Add in the fact the months of August-September are known for weakness in equities and this chart starts to look like a textbook seasonal market correction rather than a breakdown.
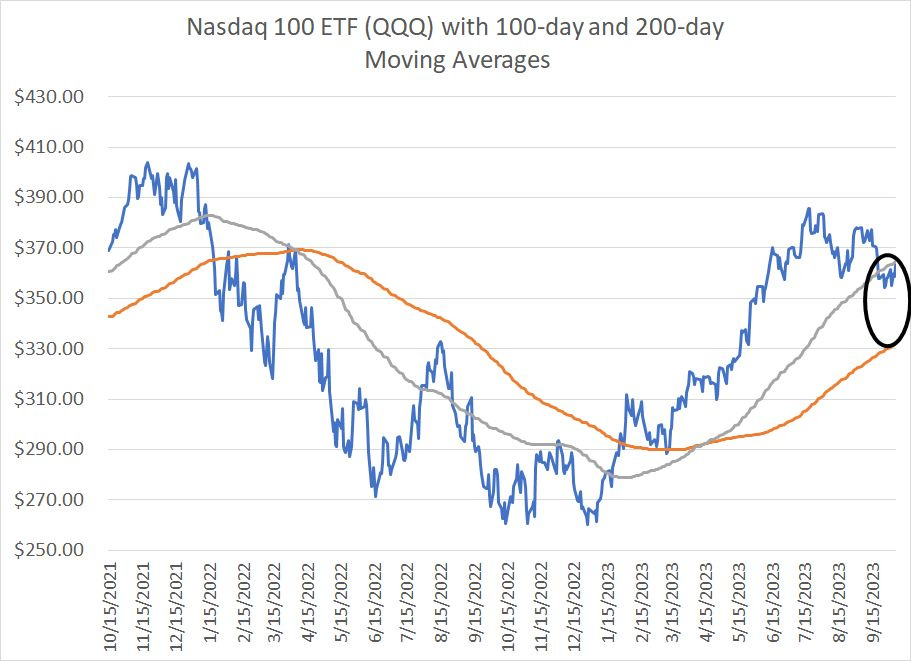
Much the same can be said for the Nasdaq 100:
Source: Bloomberg
The QQQ is a widely followed ETF that tracks the Nasdaq 100. Some readers have intimated they track the QQQ more closely than the Nasdaq 100 index itself, so I’m using a chart of the ETF though a chart of the index shows near-identical patterns.
As you can see , the QQQs hit their 2023 peak a bit earlier than the S&P 500 in mid-July. Since that time, the maximum index correction on a closing basis is a little over 8% to a closing low on September 26th. And the QQQ actually looks significantly better than the S&P 500 when compared to those 100-day and 200-day moving averages – the Nasdaq was sitting near the top of that crucial support zone heading into last week’s employment report.
I must confess it’s tempting to get more bearish on stocks. I remain concerned about both the economic outlook and broader market valuations, and I believe we’ll ultimately see the October 2022 lows fail.
However, charts provide a valuable, unemotional reality check on short-to-intermediate-term market trends and, right now, these charts suggest there’s remains solid probability the market will embark on a year-end rally.
At a minimum, I’m not seeing the sort of breakdowns here that scream “sell.”
The “Other” S&P 500
For most of 2023 the market can be divided into a small group of haves and a long list of have-nots.
The clearest depiction is a chart of the “other” S&P 500:

Source: Bloomberg
This is a chart of the S&P 500 Equal Weight Index where all members of the index are weighted equally rather than by equity market size (market capitalization).
As you can see here, the technical picture for the S&P 500 EW index couldn’t be more different to that of the S&P 500 itself. Indeed, through Friday’s close the Equal-Weight Index was down year-to-date in 2023 (up less than 0.7% including dividends) despite a 13.6% surge in the S&P 500 over the same holding period.
The S&P 500 EW is trading far below its 100-day and 200-day moving averages and is only about 2% above its year-to-date low set back on March 24th.
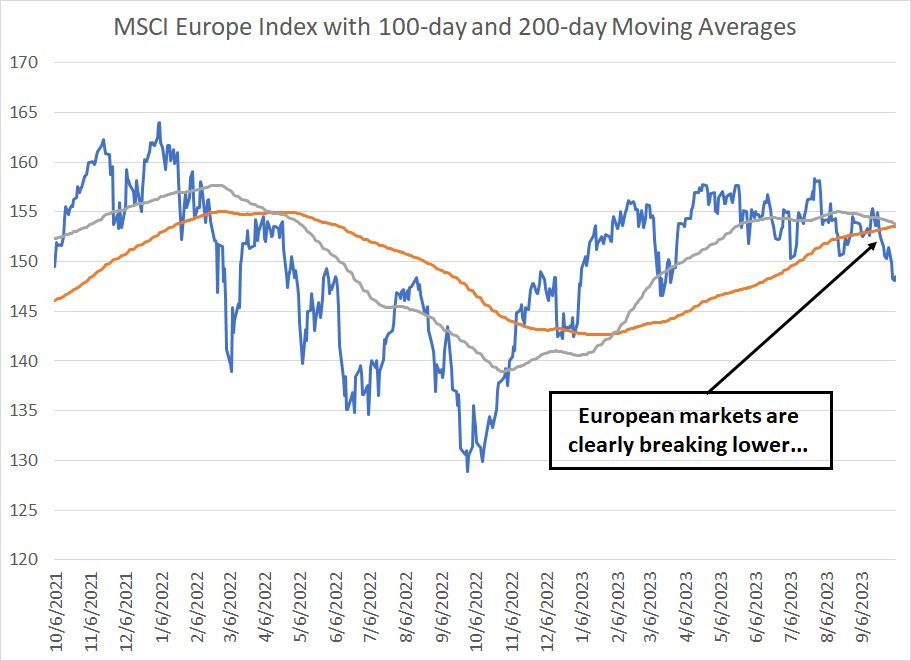
The same can be said for many foreign markets:
Source: Bloomberg
As you can see, the MSCI Europe Index did see a significant rally in the first half of 2023 alongside the US but has since started to break lower. Just over the past 2 weeks, the index has broken down below its 100-day and 200-day moving averages and is now up just 7.5% year-to-date (less than 6% in US dollar terms).
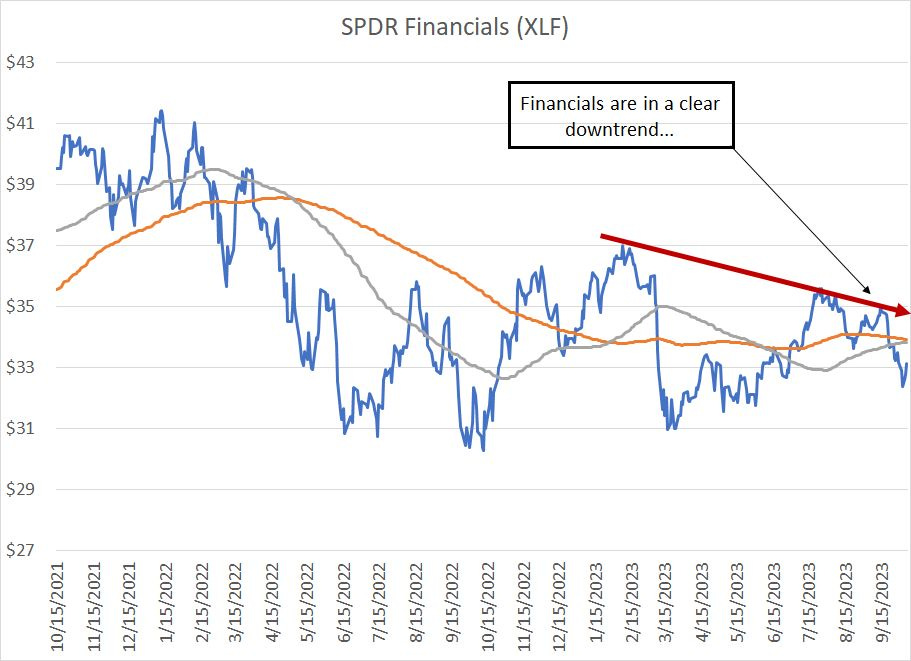
Even within the US stock market, many crucial sectors in the S&P 500 are looking weak:
Source: Bloomberg
Financial stocks are now in a clear downtrend, breaking below the 100-day and 200-day moving averages last week as well as an uptrend line drawn from the March 2023 lows.
And, from the broader market lows in October last year through the peak at the end of July, the S&P 500 Industrials Index was the third best-performing sector in the index, up 32% and trailing only technology and communications services.
Take a look at the chart of the Industrials as of the end of last week:
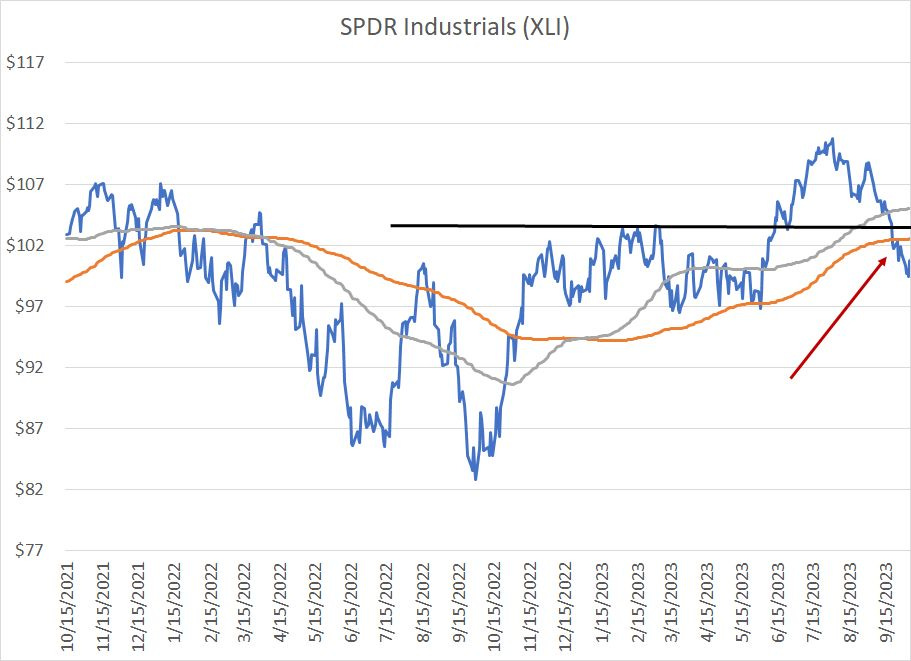
Source: Bloomberg
Industrials stocks appeared to break higher over the summer, closing above the thick black line I’ve drawn on this chart.
As you can see, that breakout has now failed and industrials have also broken below those key 100-day and 200-day moving averages.
One more chart that summarizes the current situation neatly:
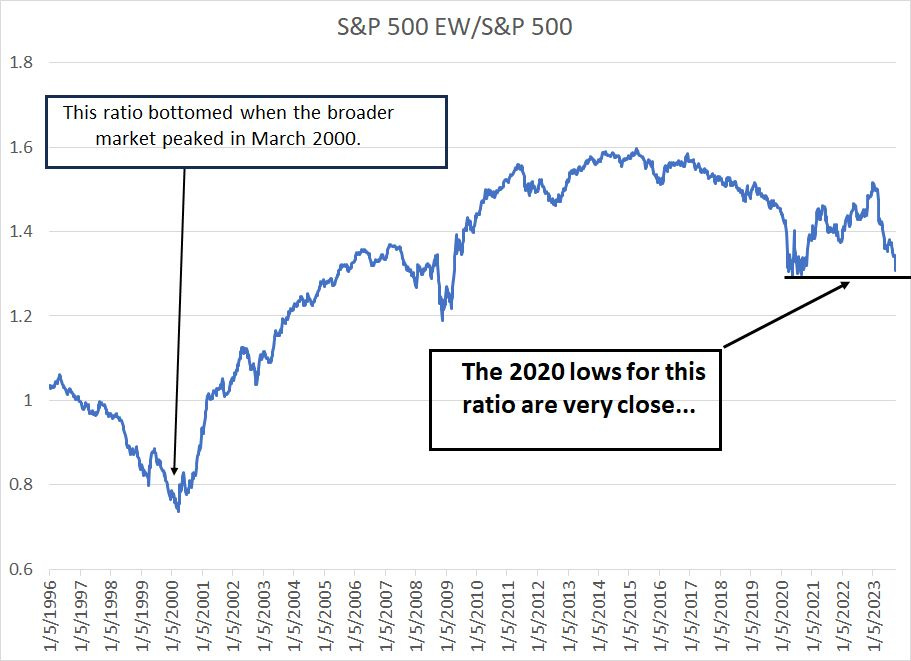
Source: Bloomberg
This chart shows the S&P 500 Equal Weight Index divided by the S&P 500. When this line is rising, the EW version of the index is beating the market cap weight version and vice versa.
This ratio peaked in 2015 and began a gradual downtrend until 2020 when it broke down sharply. My interpretation is that the rally from the 2009 market lows enjoyed decent breadth through to about mid-2015 when breadth began to deteriorate. That trend accelerated in 2020 as COVID era lockdowns and stimulus disproportionally benefited a handful of growth sectors and stocks (tech and tech-attached industries).
Ironically, breadth began to improve starting in the second half of 2021 and through January of this year – that’s because market weakness in this period was concentrated in the erstwhile COVID-era stimulus beneficiaries while many other sectors held up reasonably well.
Take a look at what’s happened since the end of January – the market has embarked on another 2020-like rally led by the same small handful of technology and growth stocks. The situation has deteriorated to the point where this simple ratio has declined close to its 2020 nadir; the melt-up in technology and AI-levered stocks has undone much of last year’s carnage.
The only other period on this chart that looks comparable is the late 1990s when tech and telecom-levered stocks dramatically outperformed the broader market. When this ratio finally bottomed in late March 2000, it marked the peak for the S&P 500 and the start of a major bear market in 2000-02.
I can tell you, through first-hand experience, there were multiple false breakdowns for the broader market back in the late 1990s and periods when it seemed the top-heavy tech-driven boom was ending. However, the rally on poor breadth continued for far longer than most bears expected at the time.
I have 3 broad takeaways from all this:
1. The broader technical picture remains positive on a short-term basis and despite all the bearish sounding headlines about rising rates and a hawkish Fed, the broader market is holding up well and appears to be setting up for a year-end seasonal rally.
2. Underneath the surface, there remain some troubling trends including ongoing pathetic market breadth and the breakdown in key sectors like the financials.
3. Ultimately market internals, extreme market valuations and economic fundamentals “will out” and I suspect stocks have considerable additional downside, but that could easily be a spring 2024 story rather than a concern for Q4 2023.
DISCLAIMER: This article is not investment advice and represents the opinions of its author, Elliott Gue. The Free Market Speculator is NOT a securities broker/dealer or an investment advisor. You are responsible for your own investment decisions. All information contained in our newsletters and posts should be independently verified with the companies mentioned, and readers should always conduct their own research and due diligence and consider obtaining professional advice before making any investment decision.