

About those Bonds...
About those Bonds...
Steepening yield curves and bond total return math

Since hitting a closing peak of 4,796.56 on January 3, 2022, the S&P 500 is down 8.33 percent, and the Nasdaq 100 is off 10.4% through Wednesday’s close.
The real carnage has been in bonds. Over an equivalent period, the yield on the 10-Year Treasury has soared by more than 300 basis points (3%) from 1.63% in January 2022 to more than 4.60% -- that’s the highest yield on the 10-year since the summer of 2007.
Rising yields means falling prices and just look at total returns from two of the more popular bond exchange traded funds (ETFs) since late 2021:
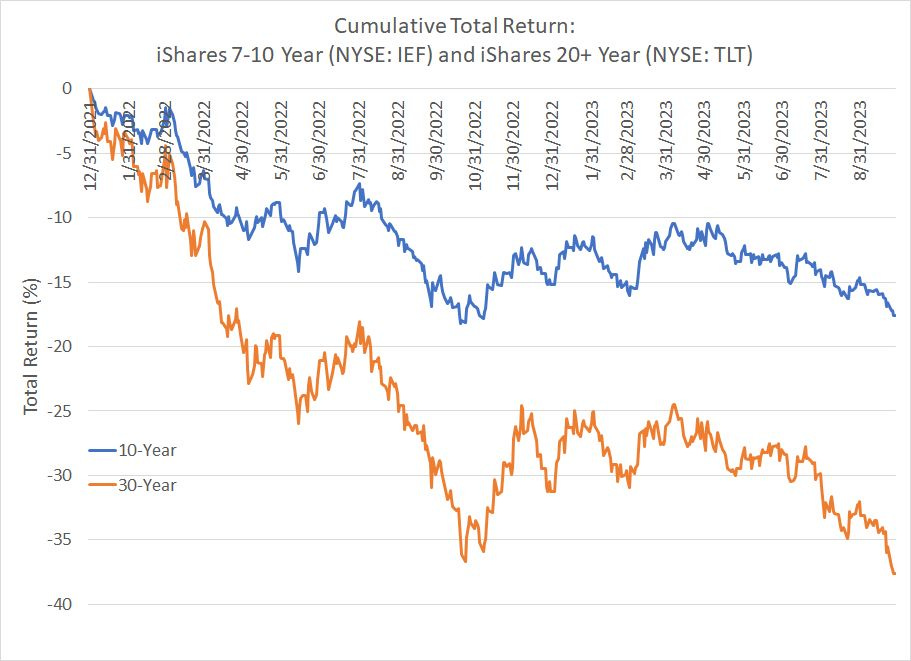
Source: Bloomberg
Indeed, bonds have fared even worse than the stock market since early 2022 with the iShares 7-10 Year Treasury ETF (NYSE: IEF) down 16.5% including monthly distributions and the iShares 20+ Year Treasury ETF off a whopping 35.2%.
To say negative returns of that magnitude are rare is an understatement.
Bloomberg provides data on the Bloomberg US Treasury Index since January 1973, and I examined rolling 18-month total returns on this index since that time:
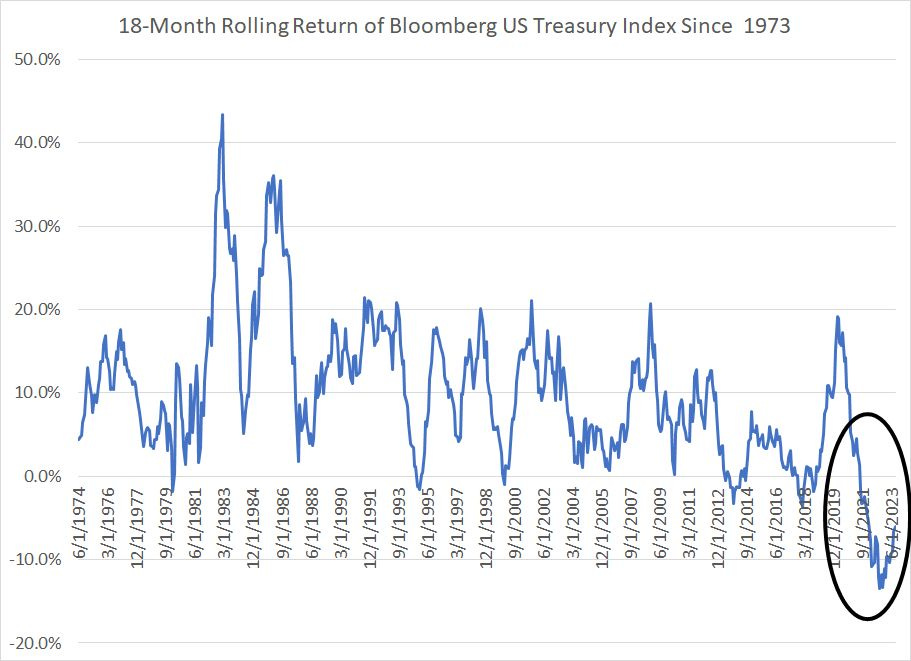
Source: Bloomberg
As you can see, there’s not a single example in the past 50 years where returns have been this poor for this long from holding Treasury bonds, not even close.
The Great Steepening
Perhaps what’s most interesting about the most recent sell-off in bonds is what’s happening to the yield curve:
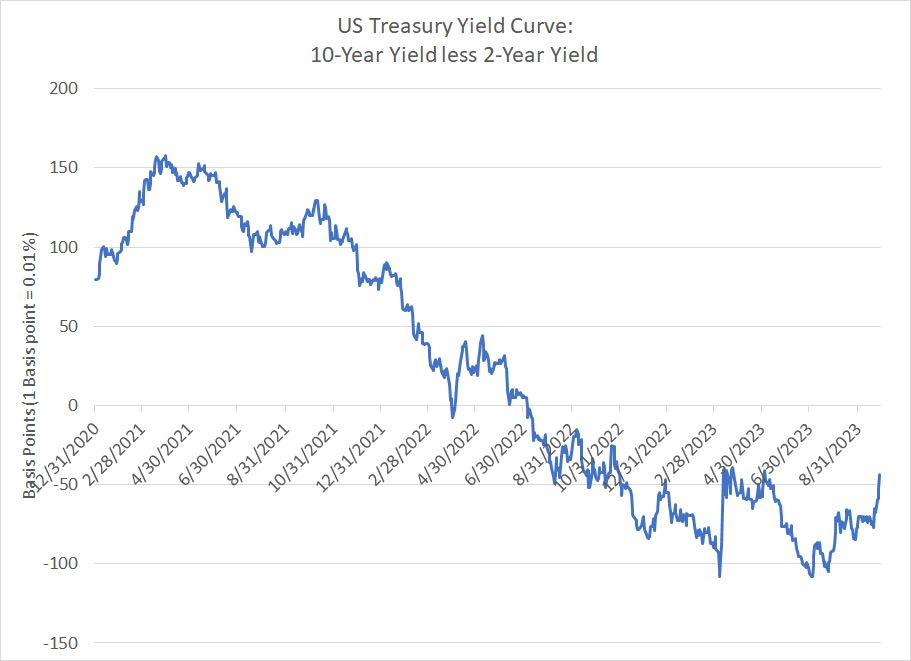
Source: Bloomberg
This chart shows the slope of the US Yield Curve, measured as the yield on 10-Year Treasuries less the yield on 2-year Treasuries, since the end of 2020. As you can see, the yield curve on this basis has been continuously inverted since July 2022, more than a year ago.
Some pundits will tell you an inverted yield curve – where the yield on the 10-year is lower than the yield on the 2 year – indicates recession.
However, that’s not true.
As I’ve explained before in FMS , an inverted yield curve simply indicates the market sees Fed policy as tight. That’s because 2-year Treasury yields are heavily influenced by Fed policy while the 10-year yield represents a market-determined rate based on expectations for future inflation, economic growth, and interest rates.
Thus, when the curve is inverted it usually means the Fed is hiking rates, driving up the 2-year yield, while the market expects economic growth, inflation, and interest rates to fall over the longer term, which keeps a lid on 10-year yields.
Indeed, in most modern cycles it’s not the inversion that signals imminent recession, it’s the ultimate re-steepening to a positive slope.
That’s because in a normal cycle, the yield curve flips from inverted back to a positive slope largely because of a decline in 2-Year Treasury yields – the decline in two-year yields signals the Fed is poised to cut short-term interest rates. Of course, the Fed usually only starts cutting rates when the central bank sees clear evidence the US economy is weakening.
For example, in the 2007-09 cycle the 10-year/2Year yield curve reached a point of maximum inversion at about 19 basis points on November 27, 2006. By September 26, 2007, the yield curve had regained a positive slope of over +60 basis points.
Over this time frame, the yield on the 10-Year Treasury changed very little – the 10-year yield stood at about 4.53% in late November 2006 and 4.602% on September 26, 2007. However, 2-year yields absolutely plummeted from over 4.71% in late November of 2006 to around 3.98% in late September 2007 and under 3% by early December 2007.
Look at my chart of the yield curve above once again and you’ll see that this cycle the US yield curve (10s less 2s) reached a point of maximum inversion of more than 108 basis points on July 3, 2023 and has now started a rapid re-steepening with the curve now inverted by just about 45 basis points.
What’s different is why the curve is re-steepening.
As I said, in 2007-09, 2000-02 and all cycles since the 1980s the curve re-steepened because the Fed slashed rates; this time around, the re-steepening is down to a soaring 10-year yield.
Indeed, since maximum inversion on July 3rd, the 2-year Treasury yield is up by about 16 basis points as the market sees the Fed as still hawkish. However, the 10-year yield is up almost 80 basis points over an equivalent period, accounting for all the steepening since early July (and then some).
Taken together, dismal returns in Treasuries since early 2022 and unusual re-steepening of the yield curve led by a surge in 10-year yields reflect a shift in market expectations for the neutral rate of interest. The neutral rate of interest is the level of rates at which US monetary policy is neither accommodative nor restrictive.
Put in a different way, after about 15 years of generally below-target inflation and near-zero rates, the market was shocked by the resilience of US economic growth and inflation in the face of the most aggressive tightening campaign from the Fed since the early 80s.
The natural tendency, at least until the past 3 months or so, was for the market to assume that US economic growth and inflation would slow in the face of higher rates and the Fed would pivot in 2024, cutting rates by 100 or more basis points. After all, in the Fed’s latest Summary of Economic Projections the median forecast for the Fed Funds rate over the long-term is just 2.50%, some 300 basis points below the current top end of the Fed’s target at 5.5%.
While the Fed’s projections for growth, inflation and rates have moved a great deal in recent years, this long-term median outlook for rates has NOT – The Fed has been projecting a 2.5% long-term Fed Funds rate for years, through booms, recessions, stock market busts and economic soft patches.
So, the market has viewed that 2.5% level as a sort of starting point for the long-term neutral level for Fed policy. Given that anchor, the current Fed Funds rate north of 5% looks very restrictive and it’s logical the market would expect rates to fall – the Fed to pivot – as soon as inflation and economic growth showed signs of weakening.
What you’re seeing right now is a generational shift in market attitudes and a reassessment of the long-term rate outlook – could it be that higher for longer rates are needed to bring down growth and inflation?
Could the new normal for the Fed Funds rate be 4% or 5% instead of 2.5%?
After all, in the mid- and late-1990’s the Fed Funds rate was generally above 5% and the economy boomed. That’s a very different world from the cozy post-financial crisis norm of easy money and near-zero rates.
And that brings me to this:
Bonds and Rates
Of course, in the fixed income market (bond) yields and prices by definition move in opposite directions – rising yields and expectations of higher-for longer rates are bearish for bond prices and the iShares 20+ (NYSE: TLT) and iShares 7-10 year (NYSE: IEF) ETFs I outlined earlier.
So, will bond ETFs like the TLT and IEF continue to get crushed as they have over the past 18 months or so?
I believe that’s unlikely for two reasons.
First, as I’ve written consistently this year, a soft landing for the US economy remains unlikely – I still expect a US recession this cycle. After all, it’s important to remember that monetary policy always acts with a lag and those lags can be both long and variable.
Yes, the Fed has embarked on an aggressive tightening campaign, however, the Fed only began tightening in earnest a little over a year ago – it’s quite possible, even likely, the full impact of tightening done to date is only just beginning to show up in the economic data.
In addition, US fiscal and monetary policy have been working in opposite directions – the US government has continued spending despite strength in the economy and, as I’ve written in recent issues, it appears that US consumers have only recently exhausted their immense COVID-era stimulus savings.
I’ve written extensively about the likelihood of a hard landing for much of this year and I won’t repeat all those arguments in this post. Suffice it to say the market and the Fed often talk about a soft landing right up until the data sours and the US enters recession – that’s exactly what happened in the lead-up to the 2001 and 2007-09 recessions.
So, my view has been, and remains, the US will enter recession in coming months and the Fed likely will pivot on rates at some point in 2024. Ultimately, a hard landing would be bullish for bonds – not only would economic weakness temper expectations for higher-for longer rates, it would also likely result in bond buying as a “safe haven” trade.
The second bullish point for bonds is more fundamental – the math that underpins the bond market and an attractive and asymmetric reward-to-risk proposition in bonds right now.
Let’s take the 30-year Treasury Bond as an example -- this morning, the yield on the 30-Year bond was around 4.75%, about 75 basis points below the high end of the Fed Funds target rate. When you buy a bond, you have two avenues to earn a return – a change in the price of the bond (bonds rally when yields fall) and the interest/coupon payments you receive on that bond.
In the case of an ETF like TLT, these coupon payments on the ETFs portfolio are passed through to investors as monthly distributions. So not only do you get that yield, but you could reinvest the coupon payments or distributions at prevailing rates (a money market fund for example) and generate interest on the distributions over time.
Let’s look at some quick scenarios for the 30-year Treasury over the next 12 months:

Source: Bloomberg
So, let’s start by assuming you buy a 30-Year Treasury today and over the next year the yield rises by 100 basis points (1 percent) to 5.75%. Perhaps, for example, inflation remains a big problem and the economy “booms” as some, particularly stock market bulls, seem to suppose. So, instead of cutting rates next year, the Fed hikes from 5.5% to 6.5% and the 30-year yield rises by a similar amount (the curve remains inverted).
In that case, the value of the 30-year Treasury would fall though that would be cushioned by that yield – your return over 12 months would be a loss of about 9.6% all in on a 100-basis point rise in 30-Year yields.
However, let’s look at a different scenario. Let’s assume, the economy weakens, as I expect, and the Fed starts cutting rates next spring as the US is clearly in recession. In this scenario, perhaps the yield on the 30-year falls by 100 basis points to 3.75%--in that case, the price of the bond would rise and your total return would be on the order of +22.8%.
In other words, if yields jump by 1% you’d lose less than 10% over the course of a year, but if yields fall by 1%, you’d see a more than 22% return. That’s an asymmetric reward-to-risk ratio – a move lower in yields offers more upside potential than downside risk of a similar-sized move higher in yields.
The rewards from a rally are higher than the hit from renewed selling pressure.
Here’s a quick table I put together showing some scenarios for yields and bond returns for 10-, 20- and 30-year Treasuries over holding periods from 6 to 18 months:
Keep reading with a 7-day free trial
Subscribe to The Free Market Speculator to keep reading this post and get 7 days of free access to the full post archives.