Accidents, the Yield Curve and Recession
Warning: A reliable market indicator is close to flashing red
Financial accidents are part of every economic and market cycle.
Some readers will undoubtedly recall the Orange County, California bankruptcy back in 1994, the implosion of Barings Bank in 1995, the Long-Term Capital Management (LTCM) hedge fund collapse in 1998 and Enron and WorldCom in 2001 and 2002 respectively.
And, of course, there’s the grandaddy of all modern accidents, namely the Lehman Brothers bankruptcy, followed by the near implosion of the entire global financial system, back in 2007-09 amid the collapse of a credit bubble focused on residential housing.
The collapse of SVB Financial Group (NSDQ: SIVB), parent of Silicon Valley Bank, over the course of just two days last week fits neatly in that historic pattern.
On Friday March 3rd, SIVB closed at $284.41 per share and had a market capitalization of near $17 billion. A week later on March 10th, the FDIC announced it’s taking over the bank and appointing a receiver.
After such a dramatic and high-profile failure, it’s only natural investors would wonder if there could be other troubled banks out there on the brink of collapse. After all, there’s an old saw in financial markets that holds there’s always more than one cockroach – when something breaks, there are usually other crises and accidents not far behind.
In my view, the SIVB and SBNY failures are important, and there are sinister economic and market ramifications. However, the bigger risk lies not in the financials, but in the economy and in the stocks and sectors that led the last boom, namely long-duration growth and technology companies.
The best place to start is by examining why exactly SIVB failed, starting with this:
A Double-Edged Sword of Boom and Bust
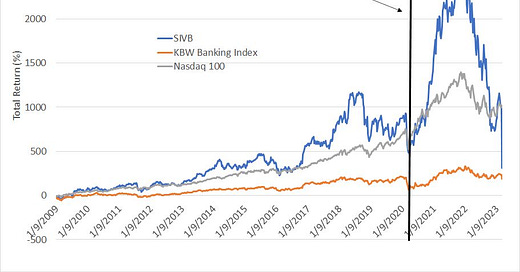
This chart shows the total return (capital gains and dividends reinvested) in SIVB, the KBW Banking Index (BKX) and the Nasdaq 100 (NDX) since January 2, 2009, the waning days of the 2007-09 bear market:
Source: Bloomberg
As you can see, large US banks (the orange line) recovered somewhat from the 2007-09 financial crisis; however, the sector faced multiple headwinds including low interest rates, weak profitability, and more aggressive financial regulation. As a result, the banks underperformed the S&P 500 for years even after the immediate crisis calmed in 2009-10.
That’s normal. Generally, stocks at the center of a bubble – like tech in 1998-2000 or banks in 2005-07 – see the most dramatic losses during the subsequent bear market and then proceed to underperform the S&P 500 through the ensuing bull cycle.
There’s an old saw that it takes a decade for a sector to recover from a bubble – I’m not sure that’s a precise estimate, but it certainly fits with the experience of the past quarter century.
The leaders of the bull market following the March 2009 market low were technology, growth stocks and the Nasdaq. Of course, the speculative phase of this bubble went into overdrive when the Fed unleashed historic stimulus following 2020 COVID lockdowns.
However, SIVB (a member of the KBW Banking Index) was a standout among the banks – as you can see, trends in SIVB’s returns over this period have tracked the Nasdaq far more closely than its banking peer group.
And shares in SIVB went truly parabolic coming out of the 2020 bear market and recession. From its closing low on March 16, 2020 to the peak on November 3, 2021, SIVB stock produced a staggering total return of 476.5%, besting even the Nasdaq’s 134% return over a similar holding period by a wide margin.
There’s good reason SIVB shares have tracked trends in technology and the Nasdaq more closely than other financial stocks – Silicon Valley Bank was set up to serve high-tech companies and the private equity and venture capital industries in California’s Silicon Valley region near SIVB’s head office in Santa Clara.
Indeed, in the bank’s Q4 2022 earnings call presentation back in January, the company revealed it had banking relationships with “nearly half” of US venture capital backed technology and life science companies and 44% of all venture-backed technology and healthcare initial public offerings (IPOs) in 2022.
The Fed’s aggressive easing response to the recession caused by government-imposed economic lockdowns in the spring of 2020 benefited technology and innovation sectors of the economy above all, catalyzing an historic surge in venture capital backed investment activity.
SIVB made no secret of its leverage to this burgeoning growth segment of the US economy. According to SIVB’s last investor presentation in January, US VC-backed investment activity stood at $34 billion in Q4 2019, just before the COVID lockdowns, surging to around $80 billion per quarter by Q1 2021 and a peak of $94 billion by the end of that year.
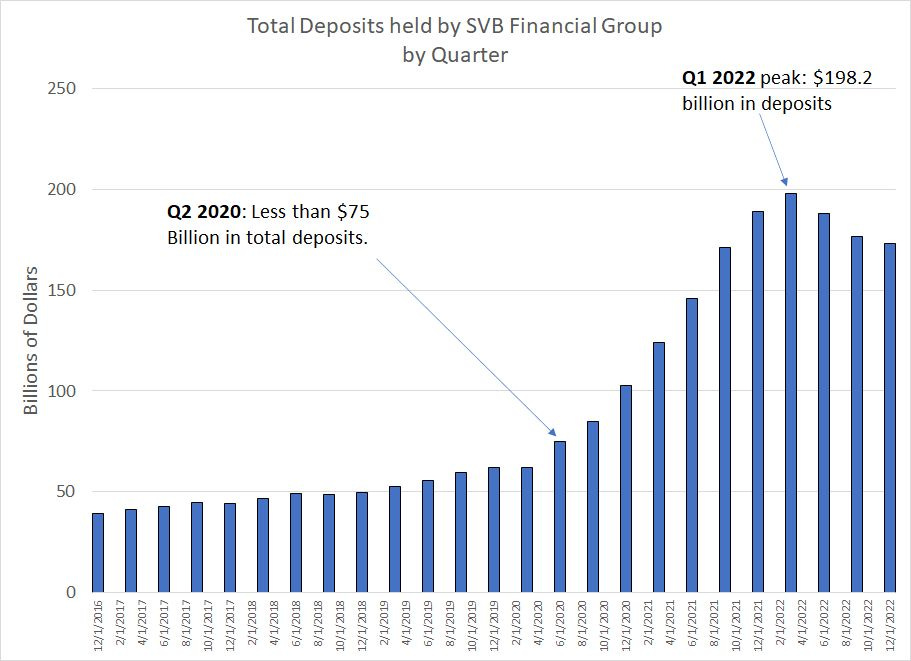
That supercharged SIVB’s deposits:
Source: Bloomberg
Total deposits held at SIVB ballooned 165% from less than $75 billion at the end of June 2020 to a peak of $198.2 billion at the end of Q1 2022, less than a year ago.
While the Fed’s aggressive quantitative easing after 2020 flooded the entire banking system with deposits, SIVB was a standout, at least in percentage terms. For example, over the same time period, JP Morgan Chase (NYSE: JPM) deposits rose just under 33% and Bank of America (NYSE: BAC) deposits were up about 20.5%.
Comerica (NYSE: CMA), a regional bank with deposits of a similar scale to SIVB at the end of Q2 2020 ($68 billion), gained a total of $14.8 billion in deposits to a peak of about $82.7 billion at the end of 2021. SIVB’s deposits increased 8 times as much, by a whopping $123.2 billion over the same period.
So, what did SIVB do with all that tech and VC cash, you might ask?
A Massive Bet on Continued Ultra-Low Rates
First, a bit of background:
Deposits are a liability on a bank’s balance sheet because the bank must pay out those deposits on demand. That’s a key issue I’ll cover in more depth in just a moment.
Offsetting those liabilities, banks’ main assets include loans made to consumers and businesses, cash and cash equivalents and securities, mainly Treasury bonds and other fixed income investments.
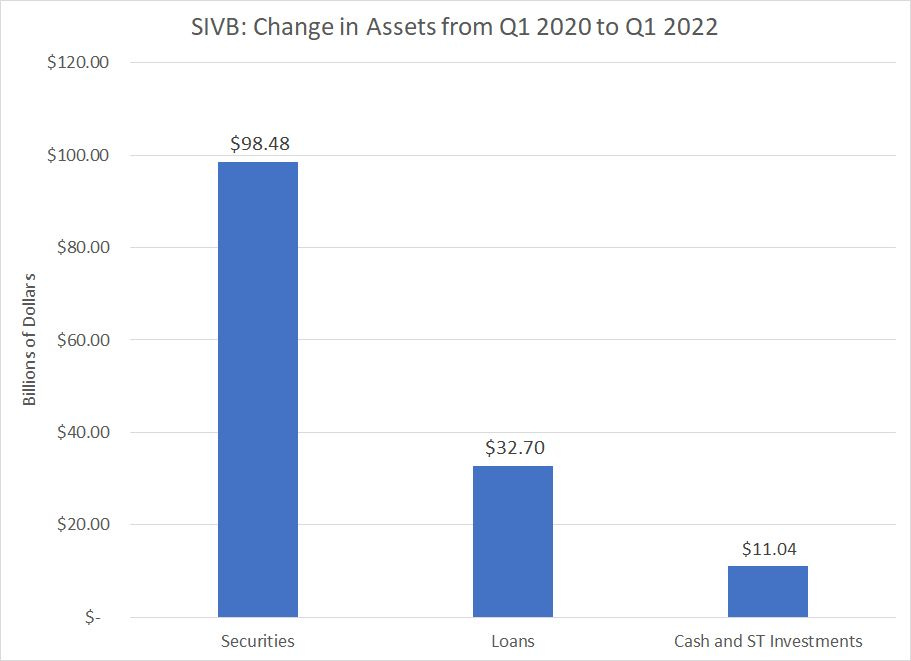
So, let’s examine a chart of some of those moving parts at SIVB over the period from Q1 2020 through Q1 of last year (2022):
Source: Bloomberg
As you can see, SIVB increased its loan book by almost $33 billion between Q1 2020 and Q1 2022 while cash and short-term investments jumped $11.04 billion. However, the biggest growth of all came in the form of securities held by the bank, which grew a whopping $98.48 billion over this time.
And, as of the end of 2022, SIVB reported that 92% of its total securities portfolio consisted of US Treasury bonds and securities issued by government-sponsored enterprises such as mortgage-backed securities.
While these securities are largely free of credit risk (risk of default), there’s still interest-rate risk – with rates rising at the fastest pace in decades over the past year, the fair market value of this securities portfolio has dwindled.
To make matters more complex, banks classify securities they own into two buckets, held to maturity (HTM) and available for sale (AFS). HTM assets are generally bonds the bank plans to hold until they mature and they’re carried on the balance sheet at their historic book value. In contrast, AFS securities are those the bank plans to dispose of before maturity and they’re marked to fair market value.
In SIVB’s case, at year-end 2022 the bank held about $26.1 billion in AFS securities and a whopping $91.321 billion in HTM securities (based on historic cost).
When the Fed started quantitative tightening last year, one impact was deposits across the banking system began to shrink. And SIVB has been hit far harder than most banks for the same reason it saw an outsized benefit back in 2020-2021 – the bank’s focus on technology, growth venture capital and private equity firms in Silicon Valley.
Since the market peak a little over a year ago, the volume of venture-capital backed investment activity has been shrinking and private and public market fundraising for small technology and biotechnology startups has withered. Since most of these companies have limited near-term operating cash flows at best, and they’re increasingly being cut off from new funding in capital markets, they’ve been responding by drawing down deposit balances at SIVB built up in the boom years.
Thus, SIVB estimates total client funds at the bank shrank $18.2 billion in Q2 2022, $25.5 billion in Q3 2022 and $12.2 billion in Q4 2022. They further estimated an additional $18.6 billion in outflows for Q1 2023 though that estimate was rendered moot within hours; subsequent reports indicate SIVB’s customers attempted to withdraw some $42 billion from the bank in a single day last week.
That’s a quarter of the $173 billion in total deposits SIVB reported as of year-end 2022, a classic bank run.
So, when deposits held at a bank are withdrawn, the bank can meet those demands using cash on deposit at the Fed first but, eventually, they might need to sell off assets to raise capital. That’s exactly what SIVB did last week, selling off its $21 billion AFS securities portfolio, booking an estimated $1.8 billion after-tax loss on the sale of these securities.
In addition to that, SIVB planned a secondary share offering and the sale of preferred securities to raise enough capital to offset both the loss generated by the sale of securities and bolster its financial position. Both transactions had to be canceled as the run on the bank worsened quickly on Thursday.
As I noted earlier, the sale of AFS securities was just the tip of the proverbial iceberg because the bulk of SIVB’s securities portfolio consisted of Held-to-Maturity (HTM) securities. And here the losses were truly sickening – as of the end of 2022, the company estimates its HTM securities portfolio carried on the balance sheet at a value of $91.327 billion was actually worth just $76.169 billion.
That’s an unrealized loss of $15.160 billion on top of the $1.8 billion after tax loss it booked on the sale of its AFS securities last week.
And, just remember, SIVB calculated this unrealized loss on HTM securities as of the end of 2022; in 2023, up until last Wednesday’s close, yields on US government bonds and mortgage-backed securities generally rose, so the losses on this massive portfolio had increased significantly.
As of the end of 2022, SIVB reported its total Tier 1 Capital as about $17.5 billion – even on an after-tax basis the $1.8 billion loss on SIVB’s AFS securities portfolio last week plus booking a loss on its HTM portfolio would have essentially eliminated that capital.
Note the problem in this case is NOT SIVB’s loan book, because bank loans carry floating rates – when the Fed boosts interest rates, the interest paid on these loans automatically adjusts higher in most cases, mitigating interest rate risk.
In short, SIVB had two major problems:
First, due to its hefty focus on one region of the country and one type of customer (technology and tech-attached industries), SIVB faced an accelerated loss of client funds due to cash burn over the past year.
Second, during the boom years – the avalanche of growth and deposit growth for these focus industries in 2020-22 – it appears that SIVB gorged on low-yield US Treasury and mortgage-backed securities that then cratered in value as the Fed boosted rates.
So SIVB faced interest rate risk on both sides of its balance sheet – rising rates severely impaired its customers’ access to capital and prompted a drain in deposits while rising rates simultaneously hit the value of its securities portfolio consisting of low-yield fixed income securities.
Risks Beyond Silicon Valley
The good news is the twin drivers of SIVB’s collapse aren’t common across most of the financial industry.
No other major banking institution has the level of concentrated exposure to tech and tech-enabled industries as SIVB did. Silvergate Capital (NYSE: SI), a bank with significant exposure to the teetering cryptocurrency industry, collapsed last week. And Signature Bank (NSDQ: SBNY), also with crypto banking exposure, was seized by New York authorities over the weekend.
Most other major US banks – including the money centers and regionals – have far more diversified client exposure. While that means they didn’t enjoy quite the deposit avalanche SIVB did in 2020-21, it also means they’re not facing the same level of outflows SIVB has in recent quarters.
And no other bank in the KBW Banking Index seems to have bought low-yield fixed income securities with the abandon SIVB did in 2020-21:
Source: Bloomberg
As of the most recent quarter, the value of securities held by SIVB was equivalent to 68% of total deposits against an average of 31% for the banks in the KBW Banking Index.
And that brings me to Signature Bank (NSDQ: SBNY) — the problems here weren’t exactly the same as for SIVB, but they rhymed.
Back on SBNY’s Q4 2022 earnings conference call on January 17th, management indicated that 20% of SBNY’s $89 billion deposit base was through its Digital Asset Team, a unit set up to serve cryptocurrency companies. In Q4 alone, SBNY lost $14.2 billion of its deposits with $7.348 billion withdrawn by crypto clients alone.
Just as SIVB enjoyed surging deposits from a hot industry group in 2020-21, so did SBNY:
Source: Bloomberg
As you can see, over the same two year period from Q1 2020 to Q1 2022, SBNY’s deposits surged 158.4% from roughly $42.25 billion to more than $109 billion.
The good news is that SBNY didn’t gorge on securities to the extent SIVB did over this time – as of the end of last year, total securities held by the bank stood at less than 30% of deposits. According to SBNY’s 10-K, total unrealized losses across the AFS and HTM securities portfolio stood at about $3.24 billion pre-tax as of the end of 2022 compared to $10.059 billion in Tier 1 Capital.
Not great, but not on the scale of SIVB.
The problem for SBNY appears to be that if you look at the amount of capital tied up in securities and loans, the bank was flying too close to the Sun.
Indeed, as of year-end 2022, the ratio of SBNY’s total loans and securities to total deposits was 114.3% while the bank only had about 6.7% of total customer deposits held as cash on deposit at the Fed. I took a look at a list of 70 banks in the KBW Banking and Regional Banking Indices and the average bank held about 7.8% of their deposits in cash while the average ratio of loans + securities to total deposits is about 106%.
I suspect that as the run on SIVB kicked off last week, some market participants started to look at the potential risk to banks with significant deposits from shaky industry groups — in this case crypto — accelerating the deposit flight from SBNY. And since SBNY had lost almost $14.2 billion in deposits sequentially in the fourth quarter alone, it certainly fit the high risk profile that brought down SIVB.
I do believe we’ll see more pressure on banks even after the Fed’s backstop announced over the weekend – First Republic Bank (NYSE: FRC), based in San Francisco, appears to be the current target for sellers.
And, during panics, investors are famous for throwing the proverbial babies out with the bathwater — even stronger banks are at risk for additional downside in the near-term. Eventually that’s likely to set up a significant buying opportunity in select regional banks, which is something I’ll be watching in coming weeks in The Free Market Speculator.
However, I believe the collapse of SIVB and SBNY has highlighted an even bigger issue facing markets right now:
The Dreaded Re-Steepening
In the January 24th issue of FMS, “Yield Curves, Recessions and Bear Markets,” I took a closer look at one of the most famous, powerful and widely watched economic indicators around, the slope of the yield curve.
Inversions in the yield curve – where short-term interest rates are higher than long-term Treasury yields -- have a long track record of successfully signaling economic downturns since at least the 1950s.
An inverted curve is really just a signal the market regards Fed policy as tight — the central bank has the most control over short-term interest rates such as the rate on 3-month T-Bills and 2-year Treasury Yields. So, when these short term rates are high, it generally means the Fed has been hiking rates.
At the same time, longer term yields such as the 10-Year Treasury are driven more by market expectations for long-term economic growth, interest rates and inflation.
So, when the curve is inverted, it means the Fed is hiking rates and market participants expect economic growth, inflation and interest rates to fall in future — that’s pretty much the conditions you’d expect during an economic downturn.
However, what’s interesting about modern economic cycles is the real warning sign isn’t the curve inversion, but the subsequent re-steepening of the yield curve:
Source: Bloomberg
This chart shows the slope of the yield curve — 10-year Treasury yields less 2-Year yields — from the end of 1998 into early 2001. As you can see, the curve inverted on this basis in early 2000, remained inverted for nearly a year and re-steepened in early 2001. The curve steepened to a slope of 0.50% (+50 basis points) on January 29, 2001.
The US stock market peaked in March 2000 and the US economy officially entered recession in March 2001.
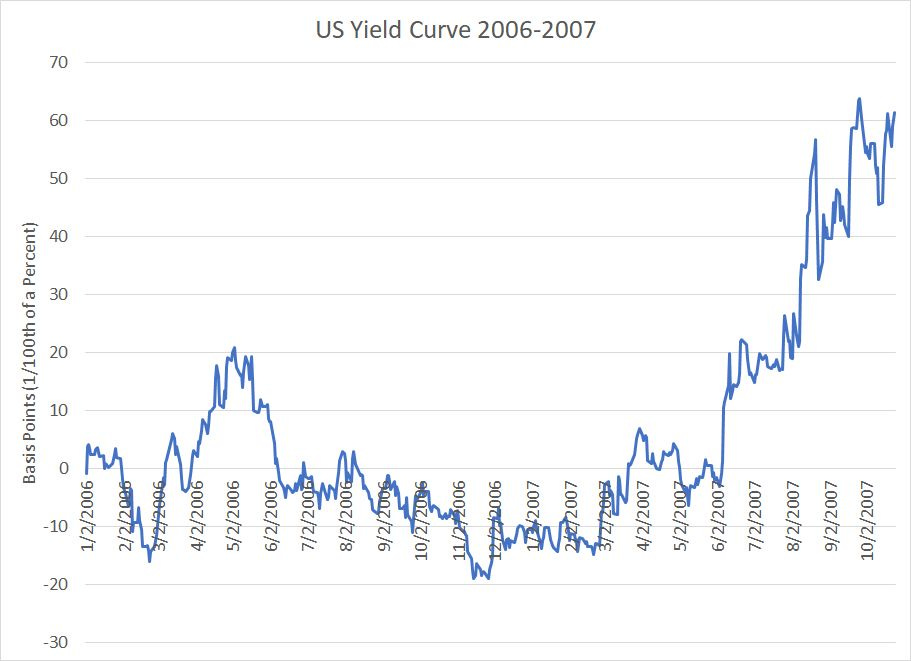
Here’s the same curve in 2006-07:
Source: Bloomberg
In this cycle, the yield curve remained flat or inverted for most of 2006 and through the first half of 2007; it finally steepened to a positive slope of +50 basis points on August 17, 2007.
The S&P 500 peaked in early October 2007 and the US entered the Great Recession in December 2007.
So you see how that works?
The rapid steepening of the yield curve following a prolonged curve inversion is the market’s way of signaling recession is imminent.
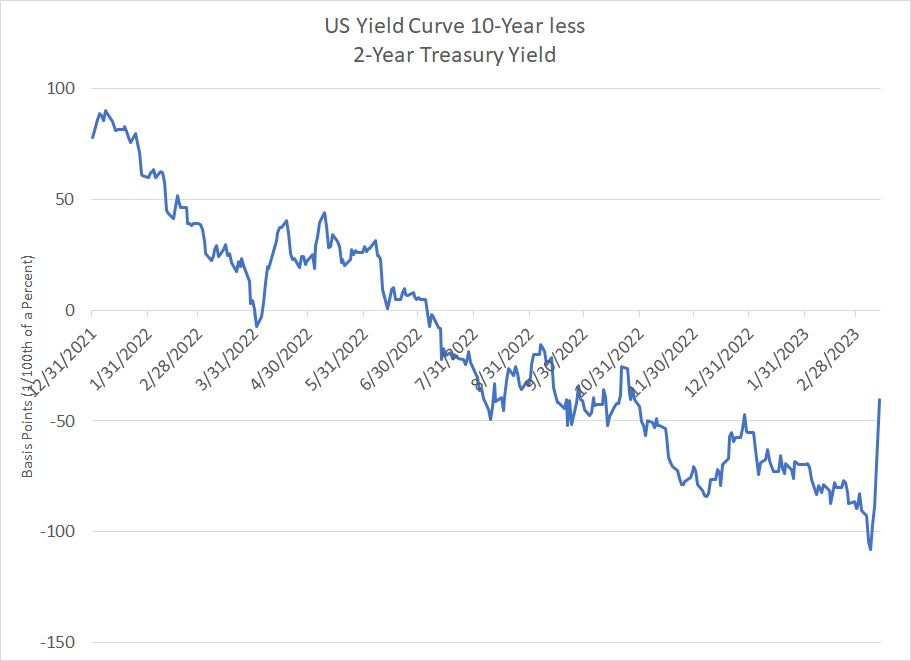
The reason for the steepening is usually that short-term interest rates fall sharply as traders begin to price in a rate cut cycle to combat spreading economic weakness. Just look at the yield curve right now:
Source: Bloomberg
The yield curve first inverted last summer and reached the deepest inversion since the early 1980s just last week of almost 108 basis points (-1.08%).
However over just the past 3 trading days the yield curve has steepened by a staggering 67.6 basis points. That’s the fastest rate of steepening for the curve I could find over at least the past 40 years.
Granted, the curve hasn’t reached a positive slope just yet — in the past few cycles waiting for the curve to steepen to around +50 basis points has generally been a good signal recession is likely in the next 3 to 6 months. Also, I suspect some of the rapid steepening is due to traders who had been shorting bonds — betting on higher rates — forced to cover their shorts over the past few days.
However, we’re getting close and that’s not good news for the economy and markets.
One more thing to watch. In both January 2001 and mid-August to early October 2007, the S&P 500 experienced one more “last gasp” rally just as the curve steepened aggressively and the economy sank into recession. These rallies were usually based on a knee-jerk bump catalyzed by Fed easing or the promise of a policy response from the government.
Given the government’s decision to make uninsured depositors of SIVB and SBNY whole last weekend and the Fed’s meeting on March 22nd, this pattern appears to be lining up right on schedule.
DISCLAIMER: This article is not investment advice and represents the opinions of its author, Elliott Gue. The Free Market Speculator is NOT a securities broker/dealer or an investment advisor. You are responsible for your own investment decisions. All information contained in our newsletters and posts should be independently verified with the companies mentioned, and readers should always conduct their own research and due diligence and consider obtaining professional advice before making any investment decision.

