

Another Bizarre Jobs Number
Another Bizarre Jobs Number
Plus: Why teenagers were behind the drop in unemployment (I'm not kidding)

The November 2023 employment report looks to be much ado about nothing.
The consensus on Wall Street was for total payroll gains of 185,000 for the month and the Bureau of Labor Statistics (BLS) reported +199,000.
While that represents a larger gain than expected, what the talking heads in the mainstream media rarely tell you is the establishment survey from which BLS estimates payrolls has a confidence interval of +/- 130,000. That means the actual gain in US payrolls could be anywhere from +69,000 to +329,000 and still be within their confidence interval.
Simply put, a +14,000 beat in headline payrolls is statistically meaningless.
I’d also point out 3 additional trends in Friday’s payrolls report that throw a bit more cold water on that headline “beat.”
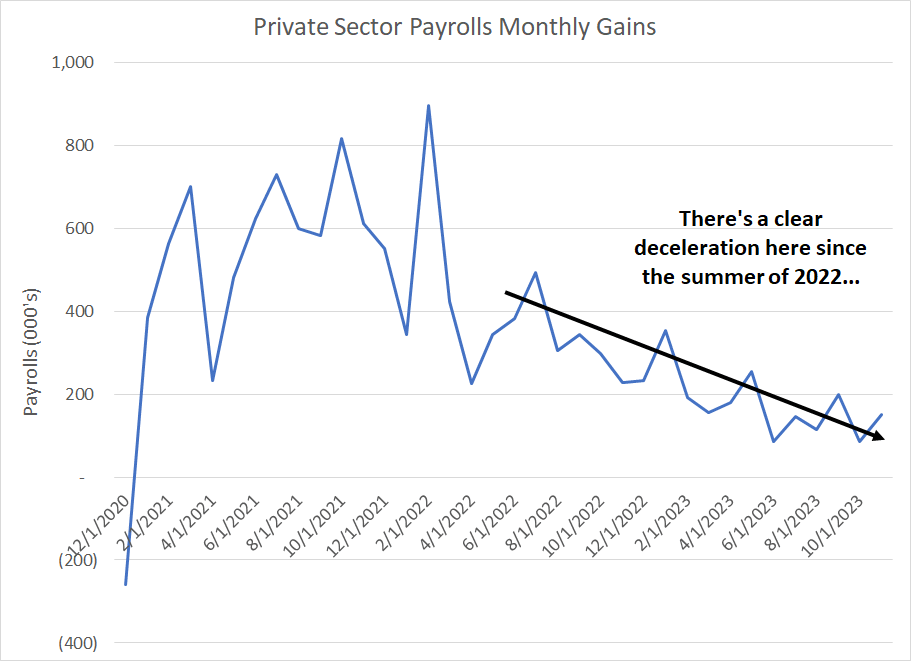
First up, while the total payrolls number slightly beat expectations, a major contributor was a larger-than-expected gain in government payrolls. In fact, BLS reported a +150,000 gain in total private sector payrolls against expectations for +159,000, slightly weaker-than-expected.
Granted, government employees, across federal, state and local governments, still earn income and their spending and employment trends have an impact on broader economic conditions. However, private sector employment trends will tend to have greater sensitivity to economic conditions and, therefore, arguably tell us more about the health of the economy:
Source: Bloomberg, Bureau of Labor Statistics (BLS)
Not only did private payrolls growth disappoint Wall Street expectations in November, but there’s been a pretty clear deceleration in the private employment market since the summer of 2022.
Some might tell you that’s exactly what the Fed wants to see, a cooling in the labor market consistent with less upward pressure on inflation but not enough to signal imminent recession. Indeed, I’d expect the Goldilocks interpretation to win out for now, since that has been the crowd consensus for the past few months.
However, I’d also warn the experience of 2000-01 and 2006-07 suggests that every economic slowdown looks like Goldilocks for a time until there’s a more sudden downshift in economic conditions. Recessions are, by definition, non-linear events and economic data is often most wrong and most misleading at key turning points.
And that brings me to this:
Source: Bloomberg, BLS
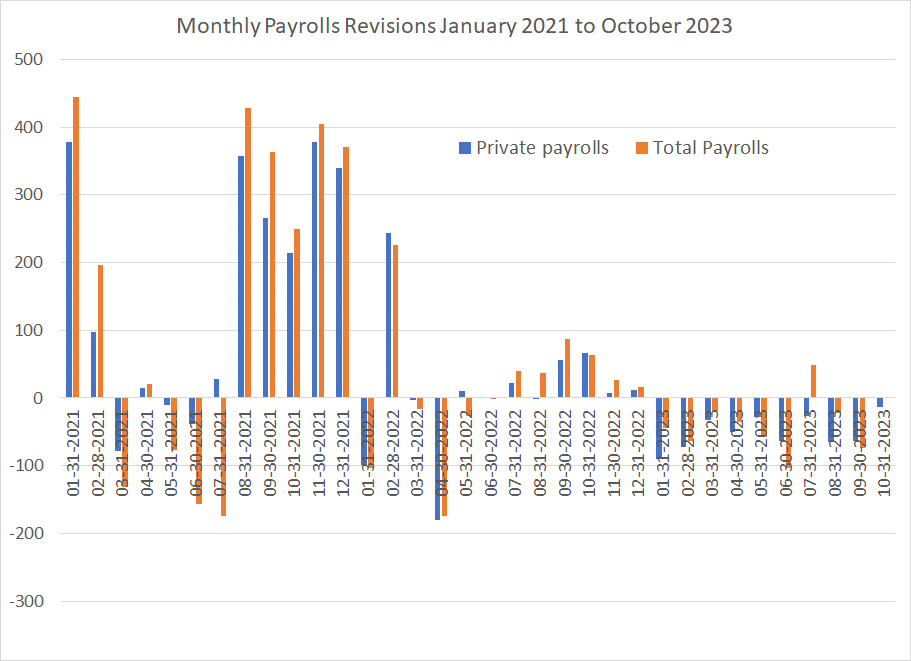
This chart shows BLS revisions to both private and total non-farm payrolls since January 2021. Of course, I’m excluding the just-reported November 2023 payrolls from this chart, since those won’t be revised until Friday, January 5, 2024, when BLS reports December payrolls.
As you can see, BLS has revised private payrolls lower for every month in 2023 and has revised down total payrolls for every month in 2023 except for July (they also left their October estimate unchanged).
As I’ve explained in prior posts, BLS data tends to see its largest downward revisions near the top of an economic cycle and the pattern in 2023 fits the pattern of a late-cycle expansion.
This chart also should serve as a cautionary tale to anyone making dramatic conclusions from any single BLS report.
Case in point: back in early October, BLS reported the US added a whopping 336,000 payrolls in the month of September well ahead of expectations for a gain of 170,000 jobs. Private payrolls at +263,000 were also strong relative to expectations for +160,000 and the bond market promptly tanked as markets fretted a more aggressive Federal Reserve.
However, over the past two months, BLS has revised that red-hot September jobs number lower by 74,000 and private payrolls lower by 64,000. While both numbers are still above expectations, they’re back to well withing the confidence interval for the establishment survey. And, remember, that BLS performs more extensive revisions as part of its annual benchmarking exercise reported in early February along with the January Jobs report.
One more chart on payrolls:

Source: Bloomberg, BLS
This chart shows total employment at temporary help services since December 1998.
Hiring and laying off full-time employees is expensive and time-consuming, so employers are reluctant to cut staffing at the first sign of weakness in the economy. However, it’s much easier, faster and less disruptive to employee morale to let a temporary worker go – so employers use temporary help as a sort of pressure release valve for their business.
They’ll take on temporary help when business picks up to cope with demand and then cut these workers as the economy, or business conditions weaken, as a cost-cutting measure.
As a result, temporary employment tends to lead broader changes in reported payrolls, turning lower months before recession.
I’ve labeled some of the obvious turning points on my chart since 1998. Temp payrolls turned lower in May 2000 and the recession started in March 2001, temp payrolls turned lower in early 2007 followed by recession in December 2007 and temp payrolls peaked in late 2018 ahead of recession in early 2020.
The lag between a peak in temporary payrolls and the start of recession can be long and variable, so this is not a great tool for timing the start of recession. However, the fact that temporary payrolls peaked in the spring of 2022, and the decline has accelerated this year, suggests that the probability of recession remains high in absolute terms and much higher than the market consensus.
Teenage Labor and Unemployment
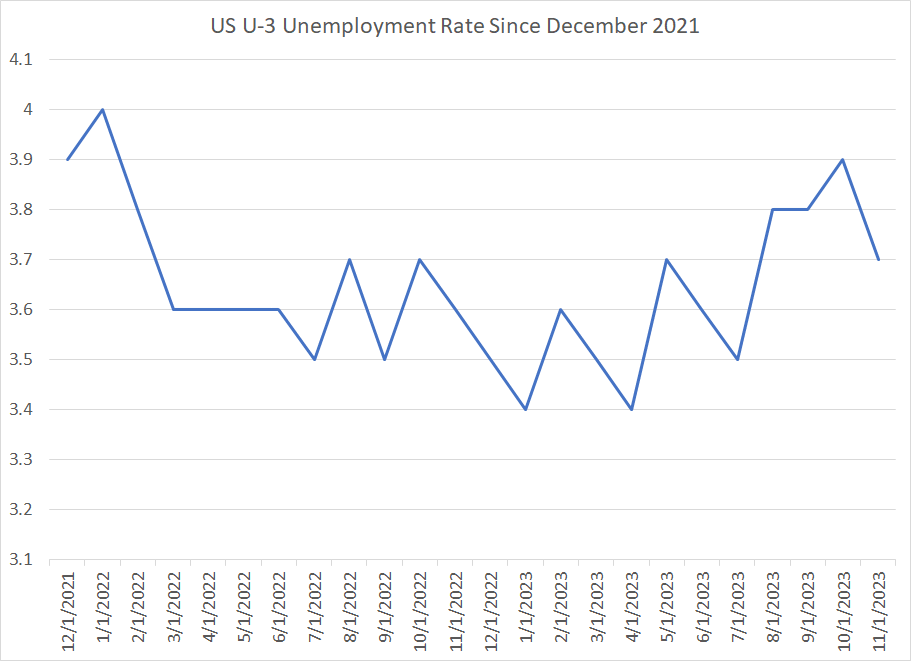
Other pundits are pointing to the slump in the unemployment rate from 3.9% to 3.7% as a reason for optimism this month:
Source: Bloomberg, BLS
This chart shows the U-3 version of the US Unemployment rate, the most common measure of unemployment in the US. As you can see, it ticked lower by 0.2%, which is a big move, in November to 3.7%, down from 3.9% in October.
However, before we conclude the US labor market is red-hot, it’s worth remembering the unemployment rate is derived from the Household Survey as opposed to the Establishment Survey used to calculate payrolls.
As I noted earlier, the Establishment Survey has a confidence interval of plus or minus 130,000 payrolls; the Household Survey’s Confidence interval is a whopping plus or minus 600,000 payrolls.
One of the more charming aspects of the Household Survey is that it does break down employment into demographic groups, so let’s take a gander at the raw data:

Source: Bloomberg, BLS
What really jumped out to me in scanning the Household data this month – Table A-1 for those who might be interested – is the wild swings in employment for teenagers over the past few months, which the BLS defines as civilians aged between 16 and 19 years.
Specifically, the government tells us the unemployment rate for teenagers in September was 11.63% in September, jumping to 13.18% in October and then plummeting to 11.43% in November. In particular, note the ranks of unemployed teenagers jumped by a whopping 130,000 people between September and October only to plummet by 123,000 in November.
Of course, many Americans aged 16 to 19 are in school and, therefore, not considered part of the labor force. The total US teenage labor force – teenagers who are employed or unemployed and actively looking for work -- is only around 6.5 million out of a total US labor force of 168+ million. So, normally the statistics presented here would be broadly irrelevant.
However, the US unemployment rate dropped 0.14% on an unrounded basis in November, which represents a household survey swing of about 235,000 jobs – this is the ultra-strong unemployment print we’re hearing so much about this month – so, those wild swings in teenage employment are clearly a significant contributor.
So, the bottom third of my table looks at the unemployment rate excluding teenagers. As you can see, the unemployment rate on this basis rose 0.02% in October and then fell 0.07% in November. So, the total change from September to November was 0.05% -- that’s a lot less dramatic than the numbers we’re seeing reported in the media the past few days.
My point is two-fold.
First, I find it hard to believe there was such a huge jump in teenage unemployment in October, followed by a similar-sized drop in November.
Indeed, since teenage unemployment was around 11.3% in November 2022, similar to the November 2023 rate of 11.4%, I’m going to go out on a limb and say that October jump to 13.18% was an aberration and likely some sort of a modeling/sampling error or distortion.
Second, while I applaud those 5.733 million hardworking American teenagers, I’d argue month-to-month swings in teenage employment probably aren’t a viable or particularly useful metric for gauging the health of the $27.6 trillion US economy, the 168+ million strong US labor force or equity and bond markets. That’s particularly true when you consider many of these payrolls likely represent part-time jobs.
So, amid all the breathless commentary about the unemployment rate over the past few days, and the potential impact on Fed policy, it’s worth having a look at what’s driving those changes – in this case, it’s 16- to 19-year-olds. Market moves on that basis would seem overdone in my view.
DISCLAIMER: This article is not investment advice and represents the opinions of its author, Elliott Gue. The Free Market Speculator is NOT a securities broker/dealer or an investment advisor. You are responsible for your own investment decisions. All information contained in our newsletters and posts should be independently verified with the companies mentioned, and readers should always conduct their own research and due diligence and consider obtaining professional advice before making any investment decision.