

Are Stocks a Viable Inflation Hedge?
Are Stocks a Viable Inflation Hedge?
The most expensive words in financial markets...

There’s an old saw the most expensive words ever uttered in the financial markets are:
This time, it’s different.
In my experience that’s a popular saying because it holds true and, with that in mind, I have just one chart for you today:
Source: Bloomberg
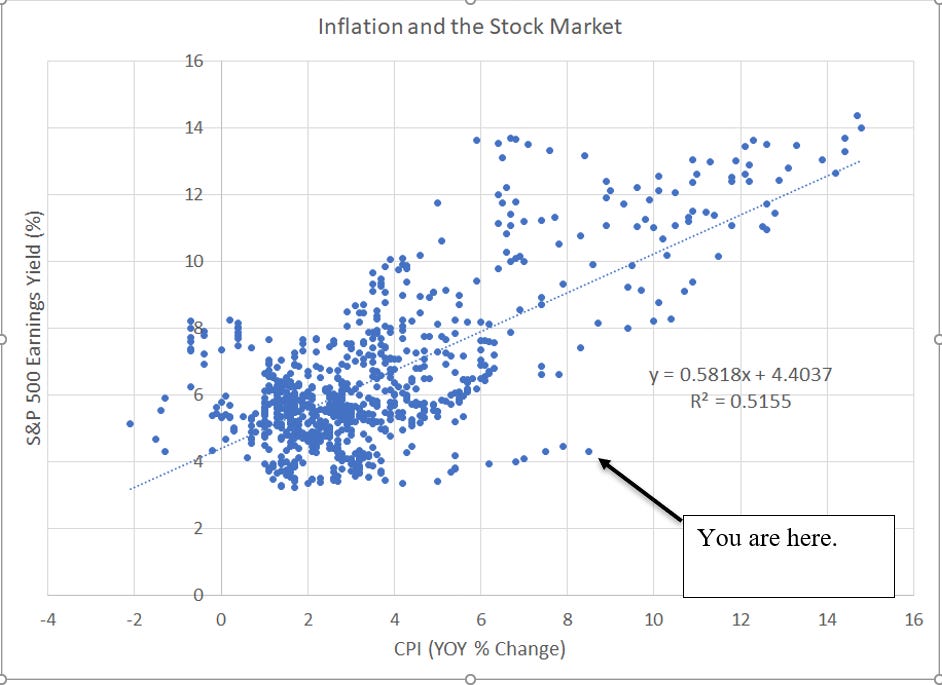
This is a simple scatterplot showing the earnings yield of the S&P 500 on the vertical y-axis, and the year-over-year change in the Consumer Price Index (CPI) on the horizontal x-axis. I’ve used monthly data since December 1954.
I’ve also drawn a simple trendline (upward-sloping blue dotted line) to describe the relationship and I’ve labeled the “dot” for March 2022.
Let me explain:
The S&P 500’s earnings yield is calculated by taking the total earnings for the S&P 500 and dividing that by the current price of the index. It’s the annual earnings for the S&P 500 expressed as a percentage of the current price of the index.
Put another way, the earnings yield (Earnings/Price) is simply the inverse of the widely recognized price-to-earnings (P/E) ratio, such that the lower the earnings yield, the more expensive market valuation is right now.
You can see, there’s a positive correlation here – when inflation is high, the contemporaneous earnings yield for the broader market tends to be higher as well. The trendline I’ve modeled to the data fits well; since 1954, the R-squared value is almost 52%, which means that inflation explains about 52% of the market’s valuation.
And, since a higher earnings yield means a LOWER P/E ratio, the translation is that when inflation is high, the valuation of the S&P 500 tends to contract.
This is a chart to keep squarely in mind the next time you read an article saying that stocks are a good hedge against inflation.
I’d also draw your attention to the current dot labeled on the chart. As of the end of March this year, the S&P 500’s earnings yield weas just under 4.3% (equivalent to a P/E of 23.3 times) and headline CPI last month jumped 8.5% year-over-year.
Just look at just how far that dot is from the trendline.
Put in a different way, this simple model implies an inflation rate of 8.5% should translate to an S&P 500 earnings yield of 9.35%, which equates to a P/E of 10.7 times. If the S&P 500 were to trade at 10.7 times earnings, the current level of the index would be close to 2,100 rather than the 4,400 level where it’s trading today, a decline of more than 50%.
That’s NOT a prediction; however, even if we assume inflation recedes to around 4% (less than half the current rate), this model still implies market valuations should be closer to a P/E of 15, which is some 36% below the current level.
And that brings me to a different market saying attributed to a man some consider the father of modern economics, John Maynard Keynes:
“Markets can be irrational longer than you can remain solvent.”
In other words, the stock market can deviate from a reasonable fundamental valuation for a prolonged period of time, and fighting the tape is a good way to go broke.
However, over the long-run, economic and business fundamentals will out -- the stock market is very expensive right now both in absolute historical terms and given the inflationary environment we face in the US right now.
I suspect the recent sell-off in markets is more than a simple correction, it’s the leading edge of a long process where the current low-rate “bubble” meets the cold, hard reality of economic and business fundamentals.
If you enjoyed this piece, please do me a favor and click the heart-shaped “like” button below this post. This helps raise the profile of this free Substack service, so I can justify posting more frequently.
And, if you have any questions or comments, be sure to post in the comments section below. I plan to feature answers to common questions in upcoming posts.