


Bear Market Rally is Underway
What to expect and how to profit...

This may be one of the shorter issues I write this year, but it’s also likely among the most important.
I believe we’ve seen the top of the bull market that started in late 2022 and we’re now in a bear market for the S&P 500.
Let me start by summarizing my thoughts at a high level:
As I’ll explain in just a moment, we’re seeing signs of weakness in the soft economic data right now coupled with strength, or at least stability, from the so-called hard economic data. It will be crucial to look for a hand-off in incoming economic data where weakness in survey-based soft data series like the ISM Manufacturing PMI Indices spreads into the hard data the Fed watches like the monthly BLS employment report or the weekly initial claims data.
I’d peg the probability of a US recession over the next 12 months at roughly 50%.
That’s high enough to act and crack open that recession strategy playbook for managing the model portfolio.
None of this changes my longer-term view outlined in the March 28th issue “The Turn of the Great Cycle.” I believe we’re in the early innings of a multi-year rotation that will favor international markets and commodities over US stocks, particularly the growth and technology stocks that have been global leaders for over a decade now. I also believe the US dollar is likely to weaken significantly over the next few years as it did starting in the first half of 2001.
As I explained in that issue these multi-year rotation themes are among the most profitable you’ll encounter but also more prone to gut-checks in the form of periodic nasty corrections and pullbacks.
Right now, I believe precious metals are likely to be the biggest beneficiaries of this Great Cycle rotation theme, and it’s a group to which we’ve held significant exposure in the model portfolio for more than two years now.
Let’s start with this:
The 200-Day Strikes Again
I’ve written a great deal about the 200-day moving average in recent months and its importance in recognizing the broader market trend and the health of that trend.
In the last issue I also referenced a quote I’ve seen attributed to Paul Tudor Jones that bears repeating:
“Nothing good happens under the 200-day simple moving average.”
About two weeks ago, when I penned the last issue, the S&P 500 had broken just below its 200-day moving average and then recovered to just above that key technical level. So, the signal here was concerning, but still rather ambiguous.
That remained the case until about a week ago, when the broader market collapsed following President Trump’s Rose Garden reciprocal tariff announcement:
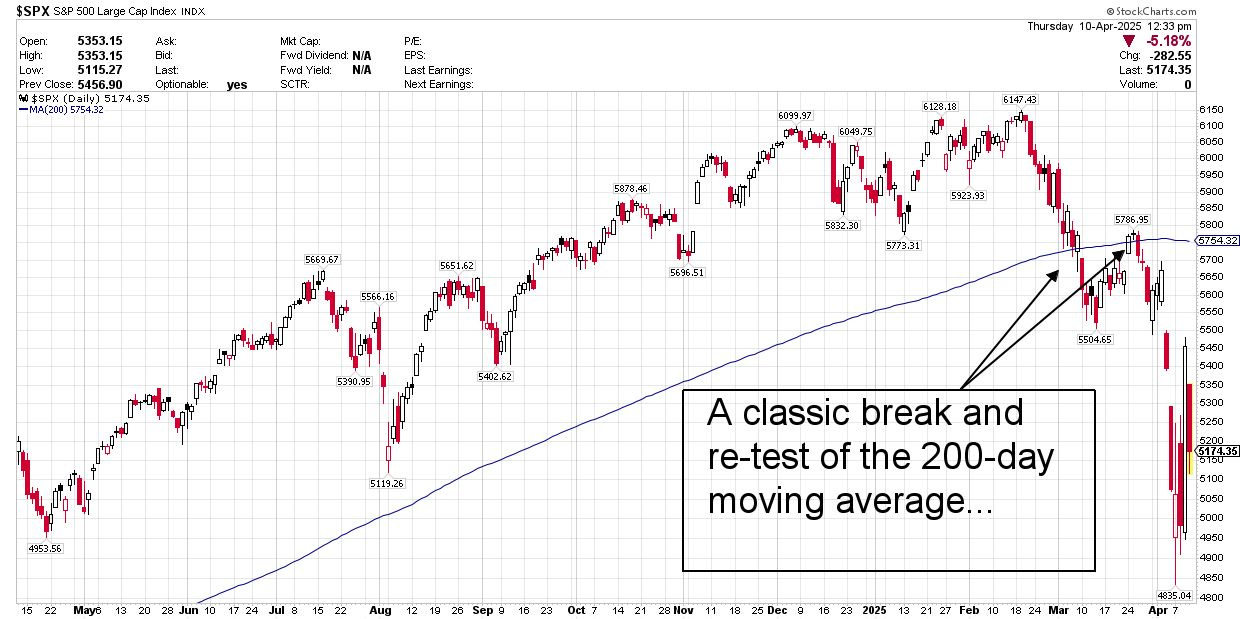
Source: Chart Courtesy of StockCharts.Com
This chart is classic, except for one point.
The S&P 500 broke down below the 200-day in early March, held below that level for a period, then rallied back to retest the 200-day in late March. The 200-day moving average has also now rolled over and is trending lower.
That’s a signal a new downtrend is now underway, and I’m not inclined to fight that over the intermediate to longer-term.
What’s unusual about the recent market action is the sheer speed of the subsequent decline. Historically, as I’ve written, bear markets in the S&P 500 don’t begin with a “crash,” you tend to see the most extreme downside action closer to the end of the bear market.
In this case, though we saw some of the most extreme selling in US market history right from the market’s February all-time highs.
I examined daily market data from mid-May 1994, a period of over 30 years. Over the 7,776 trading days I examined, there have only been 8 other times when the S&P 500 has declined more than 9% on a closing basis over a two-day holding period.
Indeed, there are only 35 occasions over this period where the S&P 500 has declined more than 6% over a two-day period:
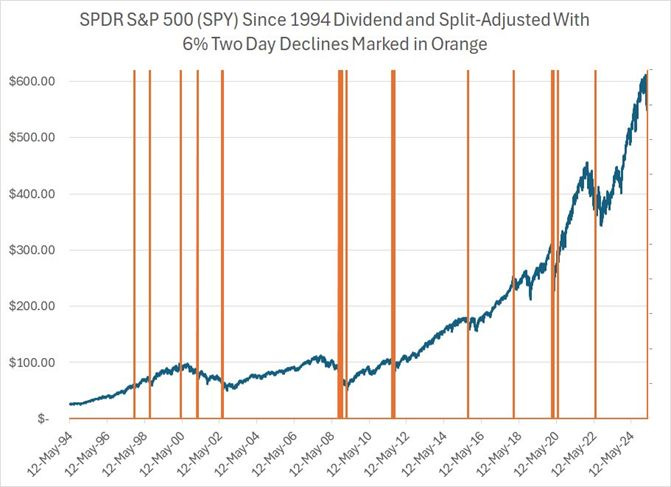
The dark blue line is the closing price of the SPDR S&P 500 ETF on a dividend and split-adjusted basis and the vertical orange lines represent the 35 occasions where the S&P 500 closed down 6% or more over two trading days on a closing basis.
As you might expect, recessionary bear markets feature prominently on my chart including the most severe stages of the 2007-09 bear market in the S&P 500. In that 2008-09 bear market, as most in history, the most severe stages of the selloff come in the final one-third of the bear market.
Of course, many of these market “crashes,” whether they were part of a larger bear market or not, were driven by events or news. Examples include the Russian debt default in the summer of 1998, the first-ever US sovereign debt downgrade in August 2011 and the COVID lockdown crash in February-March 2020.
Regardless, over the short-term, stock market returns following such crashes are rather mixed. Over the 5 trading days following a two-day crash (1 week), the average return in the S&P 500 is -0.80% and over 5 weeks it’s flat (-0.04% to be exact).
However, often, these crashes occur near the end of a wave of selling pressure and are followed by a rally that retraces a significant portion of the prior move lower.
That was true even during the scariest days of the 2008-09 financial crisis:
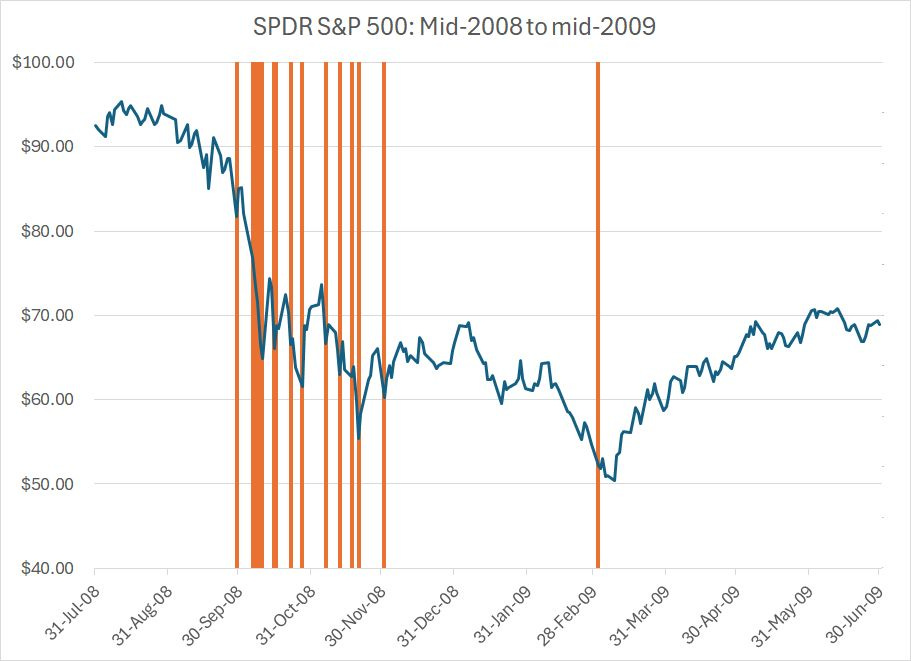
Look closely and you’ll see that many of these crashes are followed by at least short-term snapback rallies, even in the fall of 2008 when the market was waiting for the US government to announce details of a financial bailout package.
And that brings me to this:
Breadth Also Extreme
I’ve posted this chart before in this service as well:
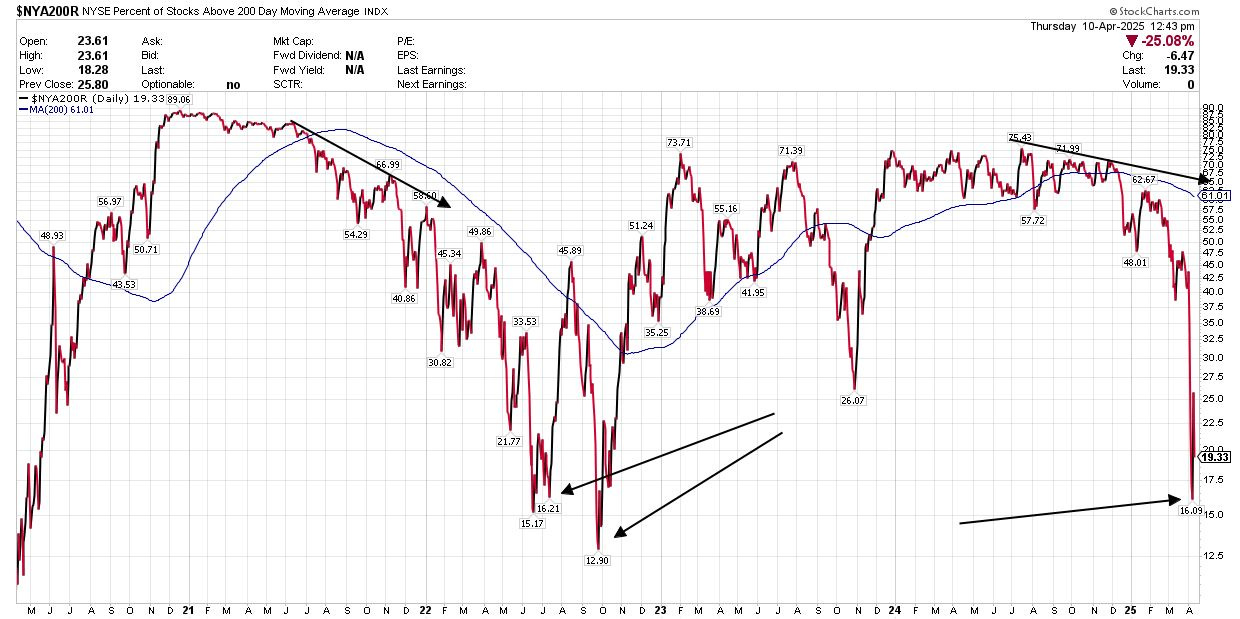
Source: Chart Courtesy of StockCharts.Com
This chart shows the percentage of stocks in the NYSE Composite trading above their respective 200-day simple moving averages. I also watch the percentage of S&P 500 stocks trading above their 200-day MAs, however, this metric is broader and more meaningful as it includes more stocks of different capitalizations.
On a closing basis, earlier this week only 16.1% of NYSE stocks were trading in uptrends (above their 200-day MAs). That’s an extreme reading that we haven’t seen since the late 2022 bear market lows.
I’ve also labeled the series of lower highs in this indicator starting last summer, which is eerily reminiscent of what we saw back in late 2021 and early 2022.
Regardless, when the percentage of NYSE stocks above their 200-day MAs falls below about 20% that’s usually a signal a tactical rally is imminent. You can see this signal tripped back in the summer of 2022 and here’s how the S&P 500 fared over that time period:

Source: Chart Courtesy of StockCharts.com
As you can see, the S&P 500 saw a 17%+ rally in the summer of 2022 from those oversold levels I highlighted on my chart above where the percentage of NYSE stocks above their 200-day moving averages fell below 20%.
Of course, it’s crucial to point out that the S&P 500 rallied to retest its 200-day moving average (blue line) and then made new lows in the fall of that year before finally breaking higher into early 2023.
That’s an important point because the most powerful short-term rallies in market history occur in the context of bear markets, NOT bull markets.
Look at the percentage of stocks trading below their 200-day moving averages back in 2007-09:
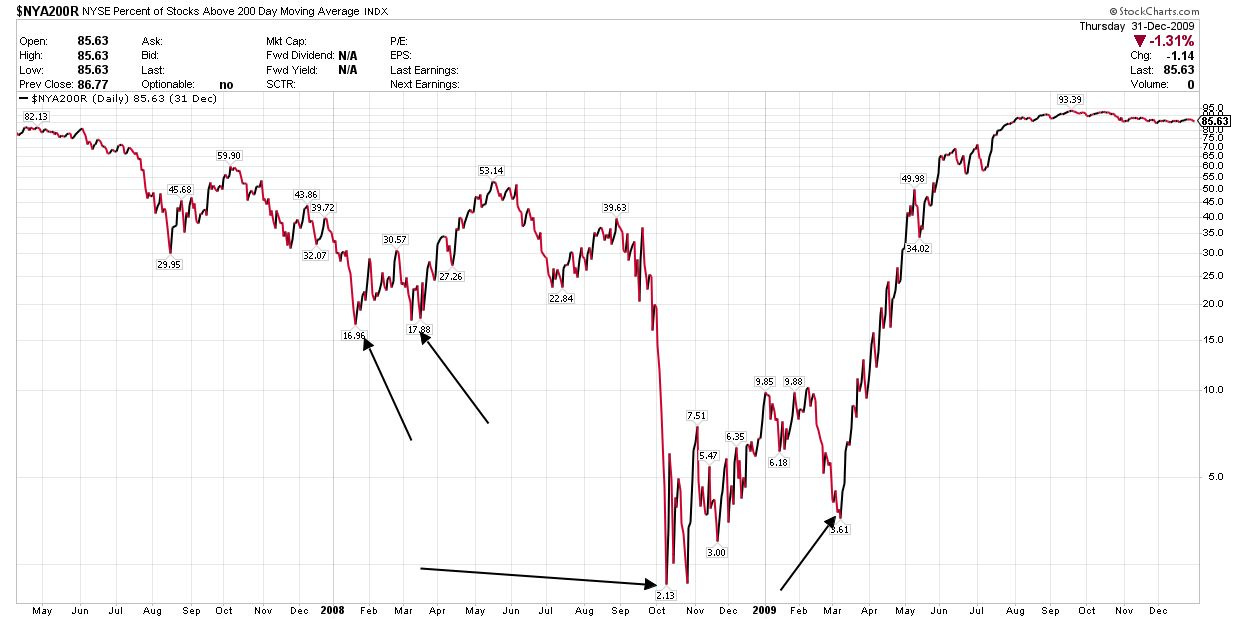
Source: Chart Courtesy of StockCharts.com
This chart covers the period from the spring of 2007, about six months before the October 2007 bull market peak through the end of 2009 some 9 months after the market bottomed in March 2009.
I’ve labeled times when fewer that 20% of NYSE stocks closed above their 200-day moving averages with black arrows.
We got an oversold signal on this basis in January 2008 and again in March 2008. Then we saw a series of signals between October 2008 and March 2009.
Remember those (rough) signals and look at the closing price of the S&P 500 over the same time frame:
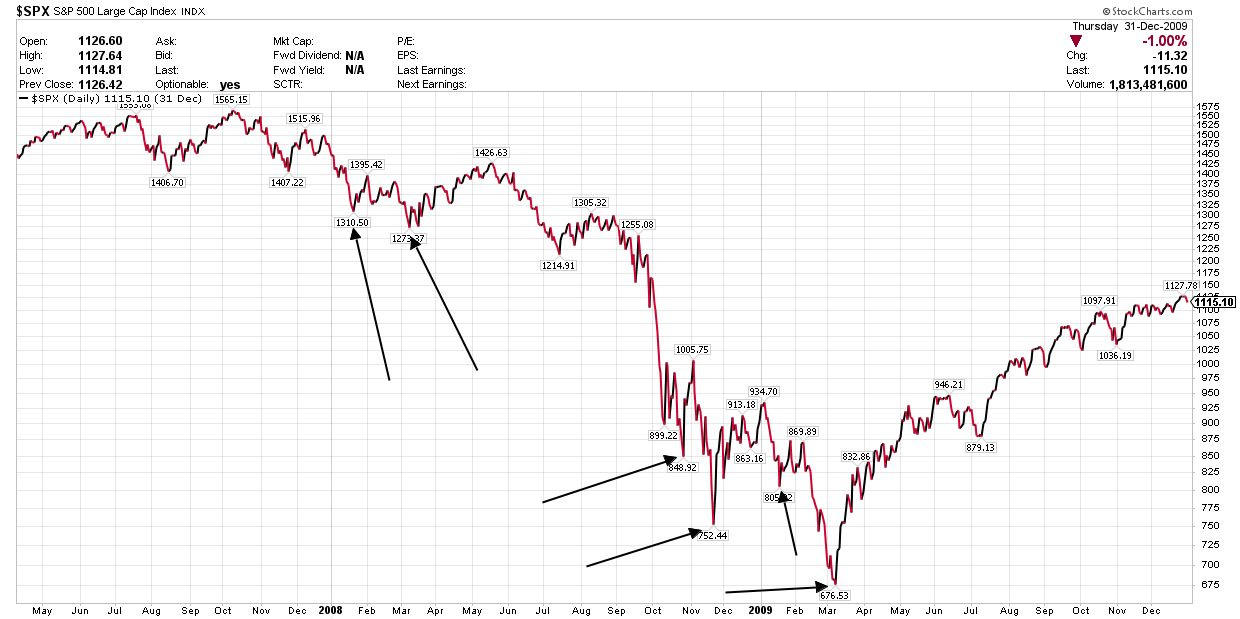
Source: Chart Courtesy of StockCharts.com
As you can see, the market saw a bounce of about 6.5% in January-February 2008, then pulled back again into early March of that year. The oversold signal in March 2008 gave us an even more powerful rally of about 12% on a closing basis between March and May.
We also saw some powerful, short-term rallies in late 2008 and early 2009, the most powerful phase of the Great Recession and financial crisis of that era – there was even a 24.2% rally on a closing basis between November 2008 and January 2009. The market finally bottomed out in March 2009 with fewer than 4% of NYSE stocks trading above their respective 200-day moving averages.
My point is simple.
We’ve seen some extreme oversold readings in stocks over the past week on just about any metric you’d care to follow. Then, there was yesterday’s record-setting intraday surge on President Trump’s announcement he will seek to defer most new tariffs imposed on countries apart from China for 90 days.
We could very well get a new round of selling, even a retest of slight undercut of recent closing lows as we did back in early 2008. However, this strongly suggests we’ll see a significant tactical rally in coming weeks, far above yesterday’s highs.
I’d posit that a reasonable target for the S&P 500 is the 200-day simple moving average around 5,750, which would represent a rally of about 11.5% from the current quote and right around 20% from yesterday’s intraday lows.
Longer term, here’s the issue:
Soft Data Complacency
There are two flavors of economic data.
Soft economic data is based on more subjective surveys and includes series such as the Institute for Supply Management’s (ISM) Purchasing Managers’ Index (PMI) for Manufacturing as well as various consumer confidence surveys.
Then there’s the hard data, which seeks to assess and quantify economic activity on a more tangible basis – the monthly Employment Situation Report from the US Bureau of Labor Statistics (BLS) is a classic example.
The advantage of soft data is that it’s leading. When the economy weakens, you’re likely to see the first signs of ill wind from the soft data, often months or even a few quarters before it shows up in data like the monthly payrolls releases from BLS.
The disadvantage of the soft data is that it’s noisier and prone to false positives for those trying to assess the probability of recession.
Today, we’re seeing clear signs of a weakening in the soft data; however, the hard data remains healthy.
That’s the same set-up we encountered back in 2022:
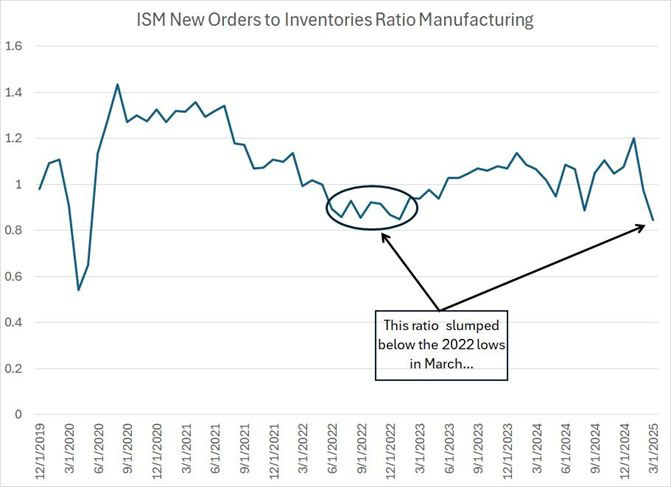
Here’s a ratio I follow based on the monthly ISM Manufacturing Report on Business.
It’s the ratio of the ISM New Orders Index to the ISM Inventories Index.
New Orders is based on a survey of managers at US manufacturing companies regarding the incoming pace of new orders for products. As with all ISM indices, readings above 50 suggest an accelerating pace of new orders while readings under 50 indicate contraction.
Meanwhile, the ISM Inventories ratio tracks whether manufacturers are building inventories or burning through inventories.
What’s pictured on my chart is the ratio of these two indices – readings above 1.0 tell us the New Orders index is higher than inventories. That’s generally a sign of strength for the US economy because it means that manufacturers are seeing a stronger pace of incoming new orders coupled with lean or declining inventories.
Readings well under 1.0 are a sign of trouble ahead. This set-up suggests new orders are contracting (or weakening) while inventories are building, leading to the risk that manufacturers will be stuck with a growing pile of unsold goods.
This chart covers the period from December 2019 to the present. As you can see, the ratio collapsed well below 1.0 in early 2020 and then recovered quickly to above 1.4 later that year. This reflected the “sudden stop” for the US economy amid COVID lockdowns in 2020 followed by massive fiscal stimulus, which drove a surge in manufacturing activity.
In the summer of 2022 this ratio also weakened below 1.0 – to around 0.85 – and remained in that range for several months before recovering into early 2023.
This was a sign of weakness for the US economy, and it summarizes neatly why there was significant talk of a recession in late 2022. Indeed, in my view, there was elevated risk of recession at that time.
The 2022 signal proved false, and the Federal Reserve stuck a (rare) soft landing despite the most aggressive tightening campaign in a generation. We never saw the “hand-off” of economic softness from the soft survey data to the hard data like payrolls.
I believe part of the reason is that while the Fed was tightening monetary policy, the fiscal policy throttle –government spending and employment – was wide open. That’s a topic I’ve covered before here in this service.
Regardless, despite all the warning signs from the soft data, we didn’t get a recession and that’s resulted in a growing tide of complacency in markets.
Investors, and policymakers, have been too quick to dismiss weakness in soft data and leading economic indicators lately because of the 2022 experience. Indeed, during the press conference that followed the central bank’s March 19th meeting, Fed Chairman Jerome Powell noted “the relationship between survey data and actual economic activity hasn’t been very tight.”
That’s a mistake for two reasons.
First, there’s no such thing as an infallible economic indicator. However, in most cycles, a deterioration in the soft data is followed by weakness in the hard data and, ultimately, a recession or severe economic slowdown that impacts markets. The fact that this hand-off didn’t happen in 2022 doesn’t negate the experience of the entire post-war era.
Second, by the time we see real deterioration in series like payrolls, the die will be cast, and the Fed will be behind the proverbial curve.
And the softness in the ISM ratio I just outlined is undeniable. Indeed, in March, this ratio slumped below the 2022 nadir. And the ISM Manufacturing Index is released on the first trading day of each month, based on a survey collected in the prior month; the March ISM data released on Tuesday April 1st was collected long before the Trump Administration released details on tariffs, and long before the stock market had slumped 9%+ over two days.
With these points in mind, here’s a quick look at the model portfolios, the moves I’m recommending you take, and my strategy for managing the portfolio over the next few months and through the coming bear cycle:
Keep reading with a 7-day free trial
Subscribe to The Free Market Speculator to keep reading this post and get 7 days of free access to the full post archives.