


Buying the Dip in Crude
Focus on debt, break-evens and dividends

Editor’s Note: Let me start today’s issue wishing my fellow American readers a very Happy Independence Day week – the stock market will be closed this Friday July 4th and will close early (at 1 PM Eastern Time) this Thursday July 3rd.
For those of you who have yet to give the paid tier of Free Market Speculator a test-drive, I’m offering 30-day free trials to the service via this link:
—EG
The big move this past week was in oil, which quickly erased the entire geopolitics-driven ramp following the start of Israel’s strikes targeting Iranian nuclear sites. Indeed, West Texas Intermediate (WTI) is trading back on its long-term support zone in the mid-$60s/bbl.
This is exactly what’s to be expected as I explained in my last update for this service, “Two Powerful Investment Principles.”
There are plenty of talking heads in the mainstream and financial media expressing surprise at the speed of the decline. The only point I find shocking is that the media, and many individual investors, continue to believe esoteric knowledge of Middle Eastern politics represents a Rosetta Stone needed to unlock the secrets of the oil market even after four decades of evidence to the contrary.
(I’ve been watching the same pattern in oil firsthand for more than a quarter century now, so I hope you’ll forgive my frustration with the endless cycle of geopolitical whipsaws.)
Regardless, what’s most interesting to me isn’t the action in oil itself, but in energy stocks. Oil-levered stocks pulled back alongside crude oil; however, the damage has remained relatively contained:

Here’s a weekly chart of EOG Resources (NYSE: EOG), a high-quality shale producer. As you can see the stock continues to trade in a range that’s been in place for much of the past three years.
While it was down about 4% last week that compares to a 13.2% decline in oil prices over the same period. Moreover, while EOG continues to trade higher to the tune of about 5% from the close three weeks ago on June 6th, while WTI and Brent oil prices are flat to down slightly.
And I’m not just cherry-picking a high-quality producer – the SPDR Energy ETF (XLE) and the SPDR Oil and Gas Exploration and Production ETF (XOP) both underperformed oil during the headline-driven spike this month and have outperformed crude over the past week by significant margins.
Indeed, many subsectors and stocks within the energy space I follow have simply pulled back into technical support over the past few sessions. I suspect that later this summer, as the knee-jerk selling pressure from the drama in oil prices this month fades, we could see these stocks break higher yet again.
After all, take a look at this:
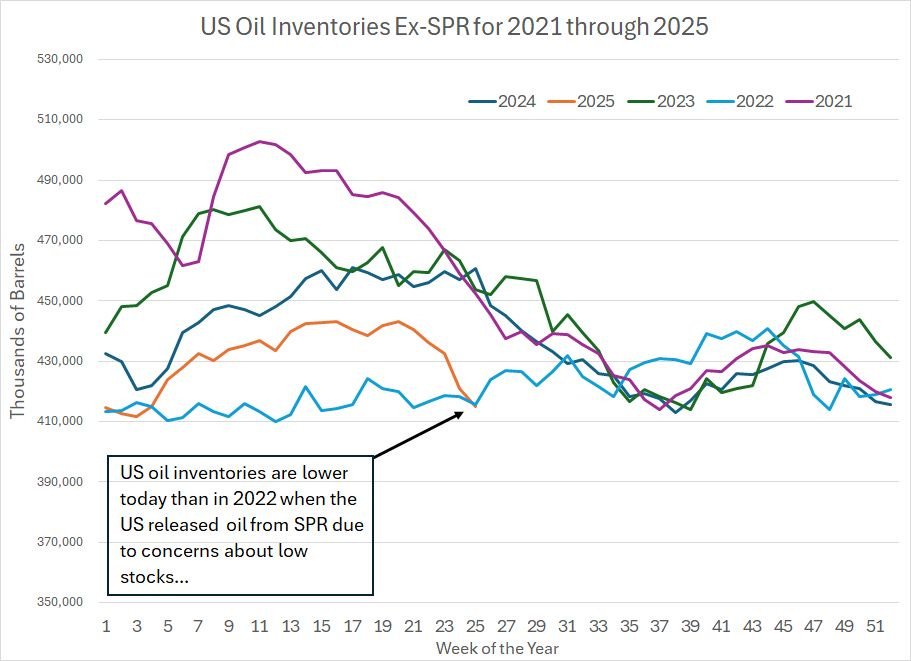
Source: Energy Information Administration
This chart shows total US inventories of crude oil excluding volumes held in the Strategic Petroleum Reserve (SPR) on a seasonal basis since 2021.
That orange line represents the path of inventories so far in 2025. As you can see, in the most recent week, oil inventories tumbled to 415.1 million barrels, which is the lowest seasonally for any year covered by my chart.
Look at that light blue line which represents inventory data for 2022. Recall that at this point in June 2022, WTI oil prices were over $100/bbl and there was growing concern about low US inventories heading into the peak-demand summer driving season.
Against that backdrop, the Biden Administration ordered the release of millions of barrels of oil from the US Strategic Petroleum Reserve (SPR) to forestall a further decline in inventories and upside risk to prices and inflation.
Indeed, between the week ended May 27, 2022 and the week ended September 30th of the same year alone the US released more than 110 million barrels of oil from SPR. In July of that year, President Joe Biden traveled to Saudi Arabia to meet with Crown Prince Mohammed bin Salman as part of a wider effort to encourage OPEC to boost output to address soaring energy prices.
Yet, fast forward three years and, in the same week of the year, US inventories are even lower; yet, ironically, global markets are fretting over too much OPEC production while oil is trading in the mid-$60s. Meanwhile the peak of summer driving season, and related declines in US commercial oil inventories, lies ahead and the SPR, even after some recent refilling activity, is about a third smaller than it was in early 2022.
There are some valid reasons oil prices are lower today than at the same point in 2022; however, this picture doesn’t exactly fit with a narrative of weak oil demand and excess supply this summer.
With these points in mind, I’m adding exposure to the energy sector in the model portfolio this week.
And let’s take a quick look at US natural gas prices over the past week:
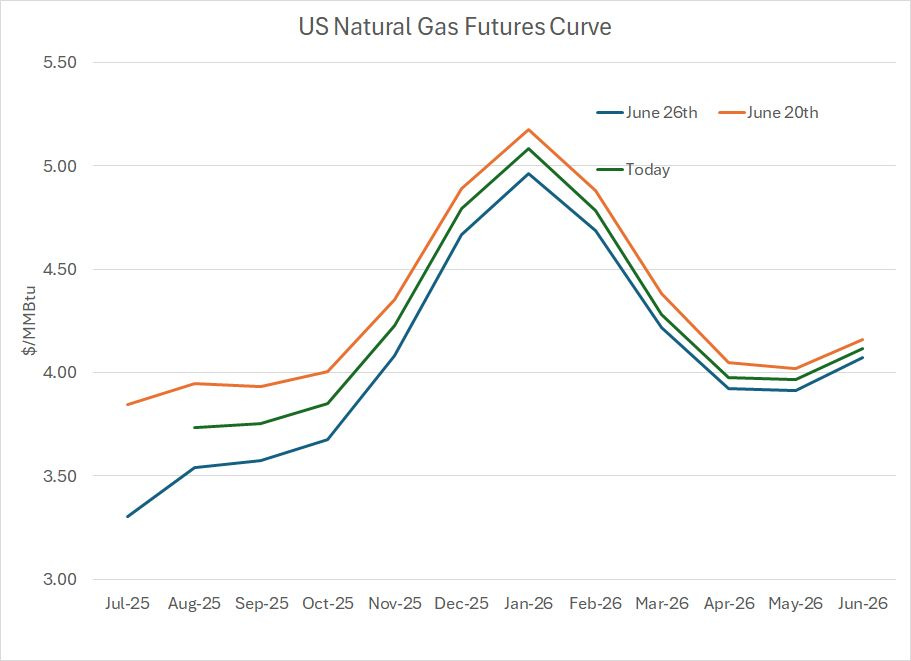
Source: CME
This chart shows the closing price for NYMEX Henry Hub Natural Gas futures from June 2025 through June 2026. I’ve included pricing for three different dates – last Friday (June 20th), last Thursday’ s settlement (June 26th) and the close on Friday June 27th.
The first point to note is that Thursday was the last day of trading for July 2025 natural gas futures. So, while July futures were down significantly through Thursday’s close and over the past week, that’s irrelevant. Most of the trading volume shifted out of July 2025 into the August contract a couple of weeks ago and so the July futures were thinly traded last week.
If we look at the August futures, prices are down about 5% compared to where they were a week earlier, which in the notoriously volatile US gas futures market, is tantamount to random noise.
Even more important from the standpoint of gas producers is to look at the curve. Since most producers hedge significant volumes ahead of time, these futures prices give us a better read on the realizations E&Ps are locking in right now for future output.
In this case, when we look at natural gas prices for next winter – December 2025, January 2026 and February 2026 when heating demand typically drives a seasonal surge in pricing – gas prices in the $4.23 to $5.08/MMBtu range remain healthy. Moreover, there’s been very little change in pricing for these key natural gas futures contracts over the past week despite the extreme volatility we’re seeing in oil.
Keep reading with a 7-day free trial
Subscribe to The Free Market Speculator to keep reading this post and get 7 days of free access to the full post archives.