

Christmas Coal, New Year Cheer?
Christmas Coal, New Year Cheer?
Some seasonal strength likely but it won't last

I’d like to take this opportunity to wish all Free Market Speculator readers a very happy start to the New Year.
For equity markets, Santa was absent in December with the S&P 500 down more than 5.7% for the month. Even more unusual is the decline in the second half of the month – the S&P 500 was down about 1.4% from the close on December 15th through the end of the year.
In the past 52 years, there have been only 8 years where the S&P 500 has fallen in the second half of December:
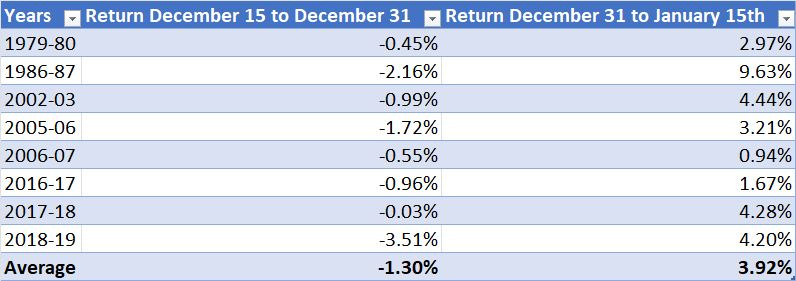
Source: Bloomberg
Three points to note.
First, declines in the second half of December are rare, happening only about 15% of the time since 1970.
Second, when the market does decline in the second half of December, declines are usually modest – the average decline in these 8 years is about 1.3% and the largest was -3.51% in 2018.
Finally, when the market DOES decline in the second half of December, it tends to see a significant rally early in the New Year – in every one of the 8 cases in my table above, the market rallied in the first 15 days of January following December declines, rising an average of 3.92%.
Indeed, there’s not a single case in the past 52 years where the market has not more than made up for any sell-off in the second half of December by January 15th the following year.
For these 8 years, the average gain from December 15th to January 15th is 2.56%.
Normally, I don’t put much stock in historical seasonal patterns like this; however, in this case, it might actually make a bit of sense. After all, there’s a seasonal tendency for investors to put money to work in markets early in the New Year and the return of trading volumes in January could account for a reversal of moves made amid light volume in late December.
Warning: This is not a reason to get excited by the market’s prospects over holding periods longer than two weeks because a strong rebound in early January doesn’t necessarily correlate to strong returns for the full year. In 2018, for example, the market jumped 4.3% in the first 15 days of the year, only to end down 4.4% for the year as a whole.
Recession Looms, Stocks Have Further to Fall
Longer term, I remain cautious on stocks this and recent news continues to support the recession case. It’s always puzzling to me how much the mainstream media and financial pundits focus on lagging economic data; they’re always looking in the rearview mirror even as markets are always looking ahead.
Thus the focus on indicators such as last month’s better-than-expected reading on Q3 GDP growth and the predictable fascination with this week’s monthly employment data due from the Bureau of Labor Statistics (BLS) on Friday morning.
The real news story is more clearly visible in this chart:
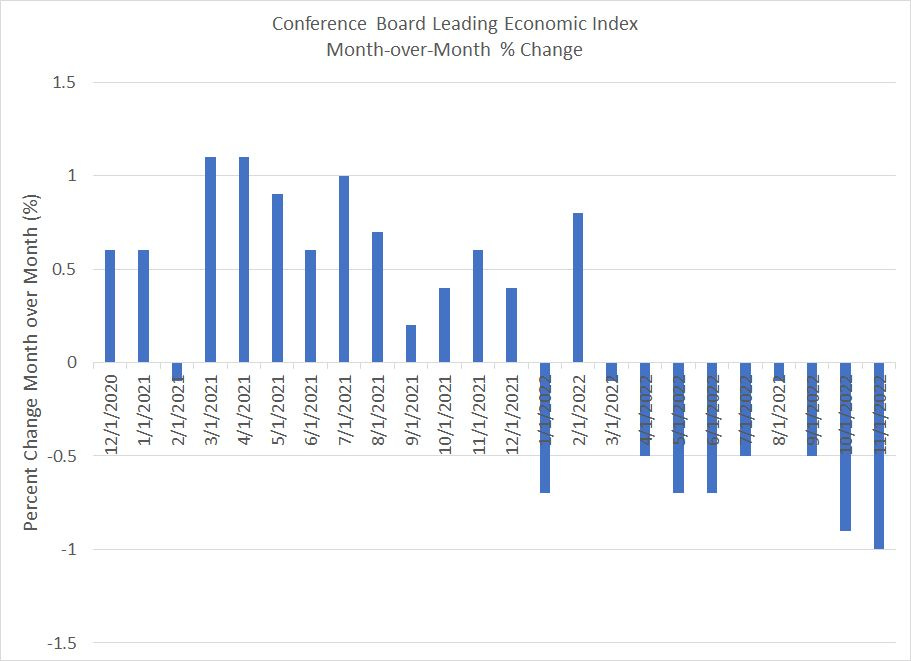
Source: Bloomberg
This chart shows the sequential change in the Conference Board’s US Leading Economic Index (LEI) since December 2020.
Late last month, the Conference Board reported LEI for November 2022 shrank 1.0%, its 9th consecutive month-over-month decline.
Since 1959, that’s happened only 5 times (counting only the first instance of each cycle) and in every single case the US economy was already mired in recession. In four of the 5 historical cases, the stock market still had significant additional downside ahead including almost 50% of downside to the 2009 bear market low following the February 2008 signal and 35.2% of additional downside to the 1974 market low following the February 1974 LEI signal.
The number of consecutive, negative sequential readings for LEI also appears to be correlated to the severity of recession – in both 1974 and 2008, arguably the two most severe post-war economic downturns, LEI fell sequentially for 22 consecutive months. I’m looking for these leading indicators to weaken further into early 2023.
Wall Street economists are beginning to take note, and the consensus probability of recession over the next 12 months now stands at 65%. However, if those recession calls prove correct, equity analysts have a lot more work to do and Wall Street earnings estimates are likely to fall much further into early 2023:

Source: Bloomberg
This chart shows consensus expectations for year-over-year S&P 500 earnings growth from the current quarter (Q4 2022) through the third quarter of 2023 (Q3 2023).
As you can see, analysts were expecting year-over-year growth in S&P 500 profits from Q4 2022 through Q2 2023 as recently as early November of this year. Now the optimism has moved into the second half of 2023 – equity analysts are looking for a 2023 earnings “V” with growth negative through the first half of 2023 and then turning significantly positive for Q3 and Q4 2023.
If there’s a recession in 2023 as I’m forecasting, then there’s significant additional downside for H2 2023 profit expectations and those downgrades could get started as soon as the second half of January as S&P 500 companies begin to report their Q4 2022 earnings results and update their guidance for the year ahead.
That’s my short and intermediate-term outlook for stocks on the first trading day of the New Year. I’ll be back later this week with a piece on the most powerful indicator or long-term stock market returns — a simple statistic that explains more than 71% of 10-year returns from the S&P 500.
I know that might sound a little hard to believe; however, I’ll include statistical “proof” in the next issue of The Free Market Speculator — be sure to subscribe (free of charge) via the link below to receive an e-mail alert when I publish the next issue (likely Thursday afternoon).
DISCLAIMER: This article is not investment advice and represents the opinions of its author, Elliott Gue. The Free Market Speculator is NOT a securities broker/dealer or an investment advisor. You are responsible for your own investment decisions. All information contained in our newsletters and posts should be independently verified with the companies mentioned, and readers should always conduct their own research and due diligence and consider obtaining professional advice before making any investment decision.