

Commodities, Recession and Inflation
Commodities, Recession and Inflation
Why recession won't stop a commodity supercycle...

Commodities are all about supply and demand.
So, at first blush it seems logical to reason that an economic downturn – a recession – means falling demand for commodities like oil, corn and iron and a consequent decline in prices. And that rationale has proven out in recessions and bear markets over the past quarter century or so.
However, it’s been about 40 years since the US experienced an inflationary recession – a period when the economy slows, yet inflation remains buoyant – and such cycles exhibit a very different pattern for commodities.
Indeed, it’s entirely consistent with historic norms to see both a recession and a commodity supercycle, where commodity prices generally rise over a period of 5-10 years or longer.
Let’s start with the market environment surrounding the recession from December 1969 through November 1970:

Source: Bloomberg, NBER
This chart shows the cumulative return excluding dividends from the S&P 500 and the Bloomberg Commodity Index from January 2, 1968 through to November 1972.
According to the National Bureau of Economic Research (NBER) Business Cycle Dating Committee, the semi-official arbiter of US recession cycles, there was a US recession starting in December 1969 that lasted through November 1970. So, the period covered by mark chart above represents roughly a two-year period before the start of the1969-70 recession and a 2-year period following the recession’s end.
As you can see, the S&P 500 peaked in late November 1968, a year before the US economy slipped into recession in late 1969. This is a pretty consistent pattern to what we’ve experienced in more modern cycles over the past 25 years as well.
For example, the S&P 500 peaked in March 2000 and the US entered recession in March 2001. And, the S&P 500 peaked in October 2007 with the US recession kicking off about two months later in December 2007. That’s why stocks are considered a leading indicator of economic conditions.
The pattern in commodities is what’s interesting.
In the 1968 to 1972 cycle, commodity prices bottomed in September 1968 roughly two months before the S&P 500 peak in November. Commodities then rallied into the end of 1968 and straight through 1969 even as the S&P 500 entered a bear market.
Finally, just as the recession began in December 1969 (labeled on the chart), commodities took off on a blistering rally while the stock market collapsed, entering the worst phase of the 1968-70 bear market.
Commodity prices rallies straight through the recession of 1969-70 while stocks sold off to a low in late May 1970. Again, the S&P 500 was a leading indicator for the economy with bear market lows in place about six months before the economy exited recession in November 1970.
One more point to note is that through this entire period from 1968 to 1972, the Bloomberg Commodity Index outperformed the S&P 500, rising about 50% compared to less than 22% for the S&P 500.
Here’s the next cycle of the Great Inflation era:

Source: Bloomberg, NBER
I constructed this chart in the same matter as my last chart – it shows the cumulative price change for the S&P 500 in blue and the Bloomberg Commodity Index in orange from November 30, 1971 through March 31, 1977. This represents the two years before and following the November 1973 to March 1975 recession.
The amplitude of the swings are more dramatic than in 1968 to 1972, but the pattern is similar – commodity prices started to rally around the time the S&P 500 peaked for the cycle in early 1973. Then, when the US recession started in November 1973, the sell-off in the S&P 500 worsened while the rally in the Bloomberg Commodity Index accelerated to the upside.
On a cumulative basis, commodity prices soared almost 325% over the period covered by my chart while the S&P 500 was up a paltry 4.71%.
Even the period around the mild and short-lived 1990-91 recession followed a similar pattern in terms of cycle timing:
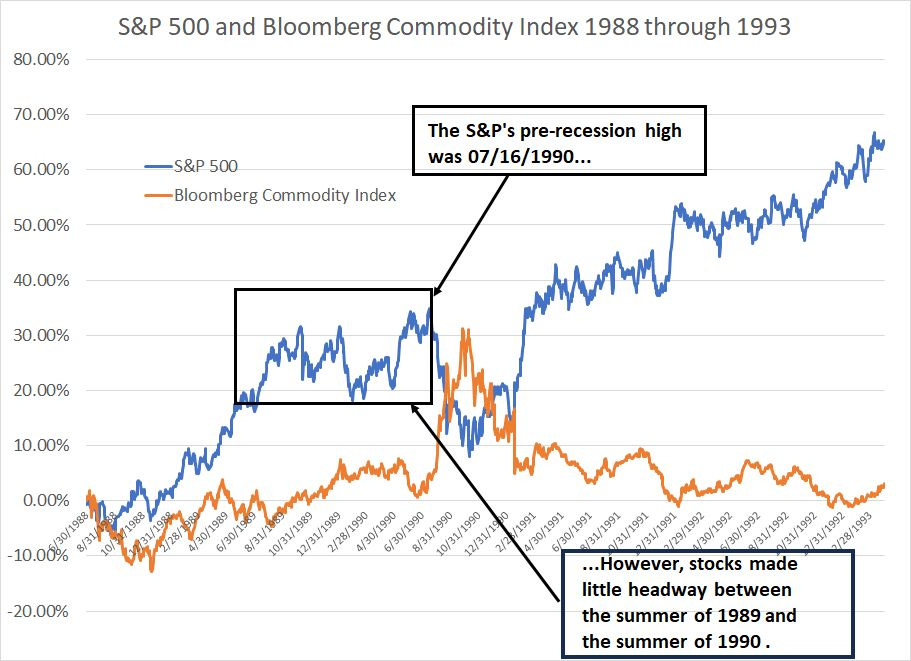
Source: Bloomberg, NBER
Most investors don’t regard the mild recession between July 1990 and March 1991 as an inflationary cycle. However, contrary to popular lore, inflation was a problem in this era – the core CPI inflation rate accelerated from under 4% in early 1987 to 4.9% at the end of March 1990 and a peak of 5.6% in early 1991.
The Fed hiked rates from under 6% in late 1986 to 8.75% at the end of 1988 and a peak of 9.75% in February 1989. Granted, that’s not a 1970’s style inflationary spiral, but it clearly represents a far more inflationary cycle than anything we experienced from 2000 - 2021.
The absolute peak for the stock market came in July 1990, corresponding to the start of the US recession as defined by NBER in the same month. However, that’s a bit misleading since the S&P 500 made little headway between the summer of 1989 and the summer of 1990; the July 1990 high was just a marginal new nominal peak.
What’s interesting here is that the Bloomberg Commodity Index found a low in June 1990, just before the S&P 500 reached its ultimate peak prior to recession. Commodities then exploded to the upside reaching a peak in October 1990.
Granted, the first Gulf War between April 1990 and February 1991 was a significant factor in the spike in the Bloomberg Commodity Index at the start of the 1990-91 recession. However, we have even more powerful fundamental supply-side tailwinds for commodities right now; the 1990-91 cycle illustrates that commodities have frequently rallied straight through inflationary recessions and bear markets for the S&P 500.
Let’s look at the current pattern:

Source: Bloomberg
This chart presents the cumulative change in the S&P 500 and the Bloomberg Commodity Index since December 31, 2020.
As you can see, both indices performed well through 2021, then in 2022 the S&P 500 peaked and entered a bear market while the Bloomberg Commodity Index soared. The S&P 500 found a low in late 2022 though it has yet to exceed its early 2022 peak. Commodities also retraced most of their H1 2022 rally with the Bloomberg Commodity Index trading back to where it was in late 2021 in May of this year.
This is all entirely consistent with the pattern ahead of recessions in 1969-70 and 1973-75.
After all, commodities saw significant pullbacks in 1968 and 1971-72. In both cases, commodities found an important low and began significant rallies just before the S&P 500 peaked. As I showed you earlier, the rally in the Bloomberg Commodity Index then accelerated as the US economy slipped into recession in late 1969 and late 1973.
This cycle, the Bloomberg Commodity Index found a low at the end of May following a significant correction in late 2022 and early 2023. If the inflationary recession pattern holds, we should look for a top in the S&P 500 later this year, the start of a recession and an accelerated rally in commodities.
At a minimum, this trip through financial history illustrates one key lesson:
Recession is NOT a reason to sell commodities in inflationary cycles; in fact, it’s usually bullish for commodities and bearish for stocks.
DISCLAIMER: This article is not investment advice and represents the opinions of its author, Elliott Gue. The Free Market Speculator is NOT a securities broker/dealer or an investment advisor. You are responsible for your own investment decisions. All information contained in our newsletters and posts should be independently verified with the companies mentioned, and readers should always conduct their own research and due diligence and consider obtaining professional advice before making any investment decision.