

Correction Likely, Unlikely "The" Top
Correction Likely, Unlikely "The" Top

So far in 2024 the stock market playbook looks a lot like 2023.
Take a look:
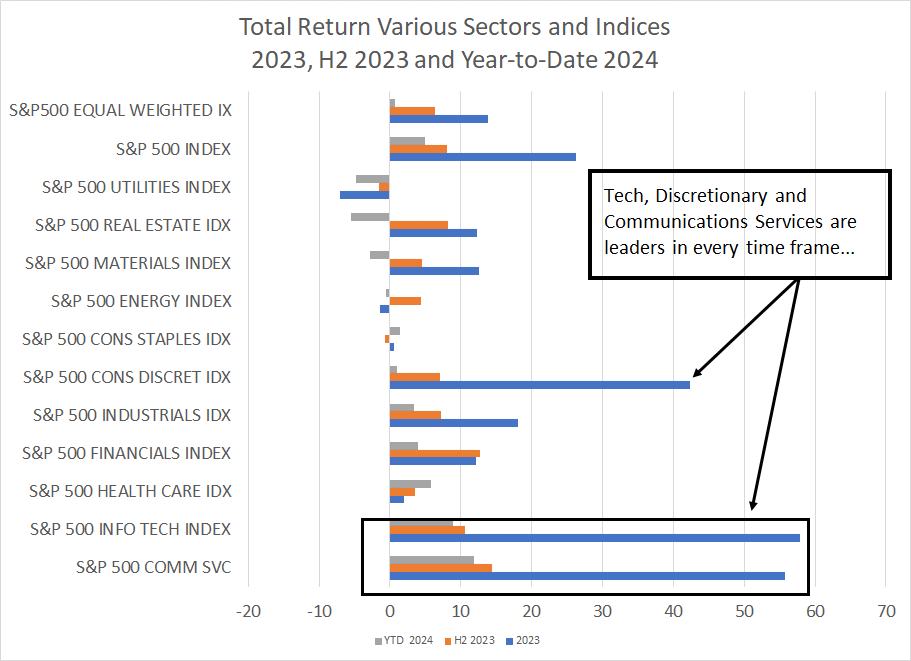
Source: Bloomberg
This chart shows returns for the S&P 500, S&P 500 Equal Weight Index and every economic sector index in the S&P 500 on three different time frames – full-year 2023, second half (H2) 2023 and year-to-date 2024.
As you can see, technology, communications services and consumer discretionary are leaders across these 3 time frames and large-caps continue to dominate with the S&P 500 jumping almost 5% so far this year compared to a gain of 0.7% for the equal-weighted version of the same index.
A few weeks ago in “Valuations May Surprise You,” I wrote that outperformance of these key groups isn’t entirely unreasonable. After all, they have been, and remain, notable islands of growth in an otherwise growth-challenged market.
Just look at this:
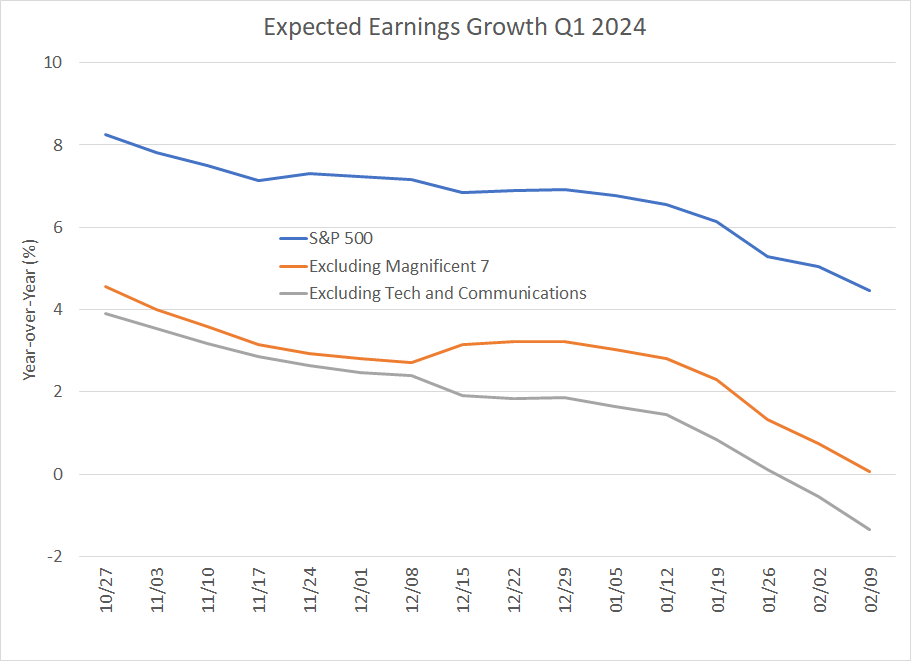
Source: Bloomberg
This chart shows earnings growth estimates for the S&P 500 in Q1 2024 (the current quarter ended March 31st) since late October.
Granted, growth estimates for the S&P 500 are down a bit over that time frame; yet, year-over-year growth of 4.5% is healthy overall.
This growth is almost entirely the result of the 7 largest stocks in the S&P 500 – that’s the so-called Magnificent 7 growth and technology names. Without these 7 stocks, Q1 2024 earnings growth is expected to be just 0.1% year-over-year.
And, if we exclude those two sectors that have outperformed since the beginning of 2023 – technology and communications services – the S&P 500’s profit recession is expected to endure with Q1 2024 earnings growth expected to be -1.3% compared to the same period one year ago.
I’ll be the first to tell you I think the broader stock market is overvalued right now in absolute terms. I’d go so far as to say that in 5 years’ time we’re likely to look back on the current market environment and themes like artificial intelligence (AI) in much the same way we do the dot-com mania and Nasdaq Bubble of the late 1990s.
However, right now, technology, communications services and the Magnificent 7 offer not only superior earnings growth, but the only significant growth in the S&P 500. It’s no wonder investors continue to gravitate toward these groups and shun most other sectors of the market, at least on a relative basis.
I continue to believe the road ahead for markets and the economy is likely to get bumpier as we move through 2024. However, as I pointed out last week, at least some data points, such as the ISM Manufacturing Indices, point to some reacceleration of US economic growth into early 2024. Meanwhile, bank reserves continue to climb despite the Fed’s rate hikes and quantitative tightening campaign.
The most recent Senior Loan Officer Opinion Survey (SLOOS) from the Federal Reserve, released at the end of January, contained some compelling nuggets:
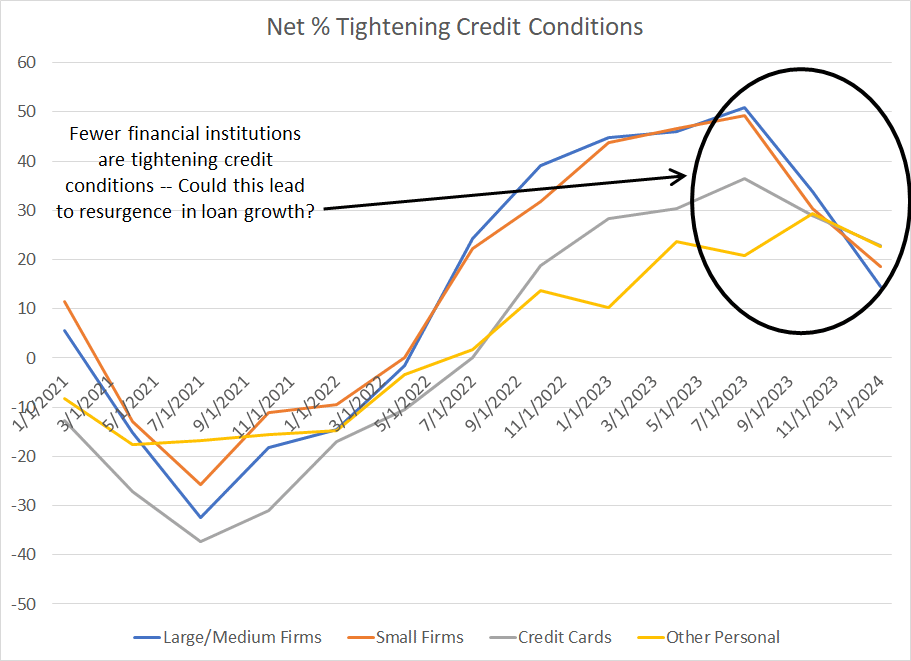
Source: Bloomberg, Federal Reserve
This chart shows the results of the Fed’s quarterly survey of loan officers.
When the net tightening percent is positive that means more financial institutions are tightening credit rather than loosening credit; the opposite holds when this figure is negative.
So, as you can see, banks are still tightening lending standards on balance for all four types of loans I’ve listed, including both business and consumer loans. However, fewer banks are tightening credit today than was the case last summer.
This survey is only released with a lag; however, it suggests there may even be scope for growth in lending activity as we move through 2024. That’s going to tend to be a positive for economic growth, at least over the intermediate term.
In the short term – over the next few weeks – I see an increasing risk of a pullback or correction.
I wrote about weakening market breadth at some length in last week’s update. Let’s look at a similar chart for the S&P 500 and breadth on the NYSE this week:
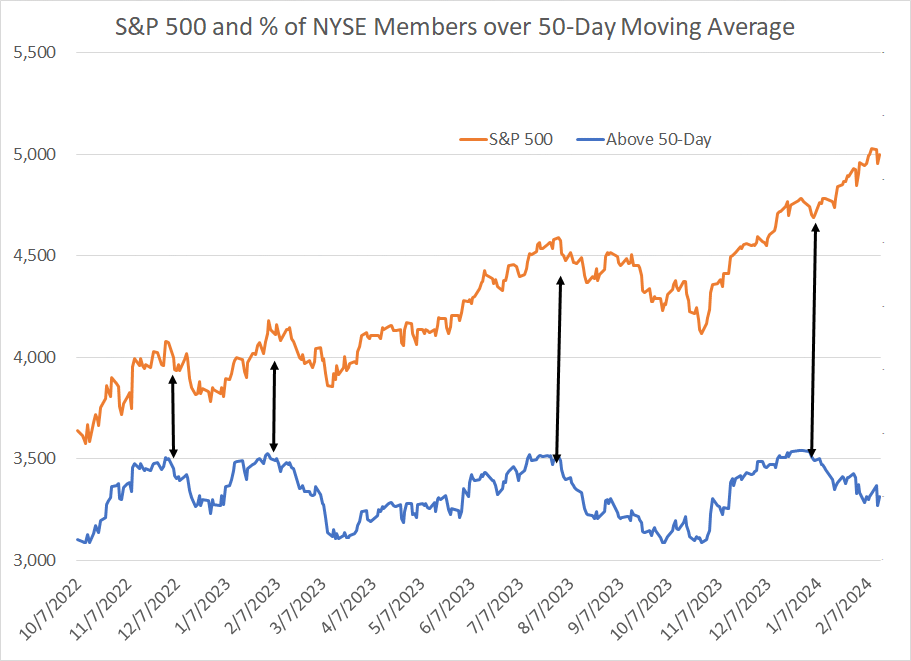
Source: Bloomberg
This chart shows the S&P 500 (orange line) and the percentage of stocks on the NYSE trading above their 50-day moving averages (blue line) since late 2022. As you can see, market breadth tends to peak some time before the S&P 500; this is because those Magnificent 7 mega-caps can continue to support the index even as most stocks see selling pressure.
However, as market breadth deteriorates, the S&P 500 usually follows.
In this case, breadth on this basis peaked back in December and the S&P 500 has continued to rally – this is the most obvious and extreme divergence you can see on my chart. Certainly, this can continue for some time more; however, following Tuesday’s bloodbath, only 43.2% of NYSE stocks were trading above their 50-day moving averages, the lowest since early November of last year.
The lower this number, the more heavy lifting the largest stocks must do to keep the index moving higher.
The bottom line is that I continue to see a correction ahead for the broader market, including both the Nasdaq 100 and the S&P 500. Meanwhile, my intermediate term economic indicators are holding up well, so I doubt a pullback will market the top of this rally – I’d be inclined to buy the dip.
DISCLAIMER: This article is not investment advice and represents the opinions of its author, Elliott Gue. The Free Market Speculator is NOT a securities broker/dealer or an investment advisor. You are responsible for your own investment decisions. All information contained in our newsletters and posts should be independently verified with the companies mentioned, and readers should always conduct their own research and due diligence and consider obtaining professional advice before making any investment decision.