
Data Distortions are Dovish
The DOGE Deferred Resignation Program (DRP) hits today...

We’ve covered a ton of ground in FMS over the past two weeks including my detailed short and long-term outlook for silver in light of the surge in prices so far this year titled “Final Warning: The Gold-Silver Indicator Flashing $100 for Silver.”
On September 25th, I covered my thoughts on the recent market rotation in favor of small capitalization stocks titled “The Size Effect.”
And, of course, in the last paid-tier issue of FMS, “The Fed, Small Caps and Portfolio Shifts,” I recommended several changes in the model portfolio.
Let’s look at how the broader market and economy are setting up as we enter the final quarter of 2025, starting with this:
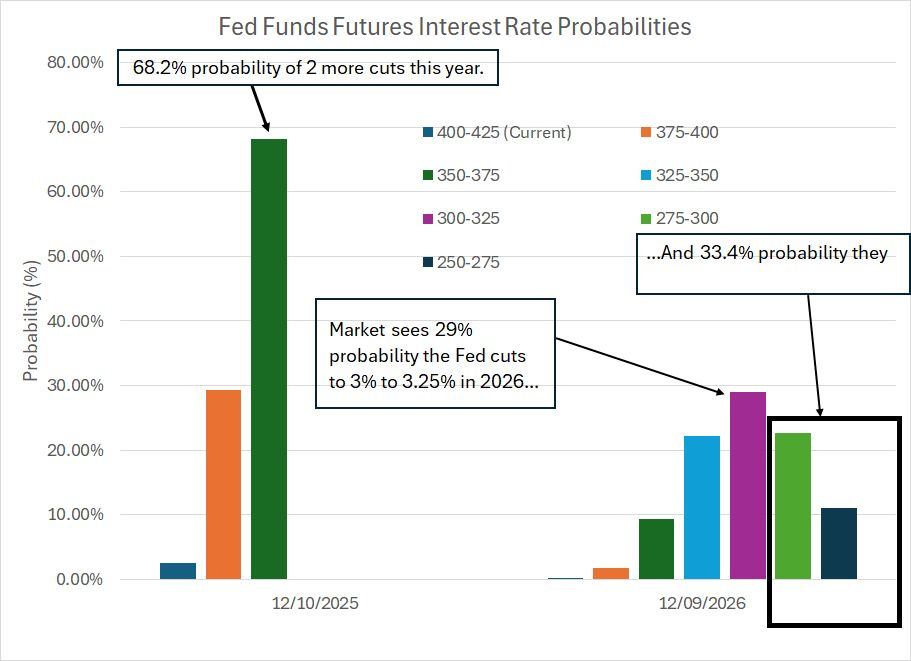
Source: CME FedWatch
This chart shows probabilities based on the Fed Funds futures markets for Fed policy through the final meeting this year (December 10, 2025) and next year (December 9, 2026).
Currently, markets see the Fed cutting two more times – a total of 50 basis points – this year from the current rate of 400 to 425 basis points (4.00% to 4.25%) to a target range of 350-375 by the end of the year. Meanwhile, the probability of a 25-basis point cut at the central bank’s next meeting, set for October 29th stands at 89.3% (not pictured on my chart).
Through 2026, the market has priced a roughly 29% probability the Fed cuts to 3.00% to 3.25% and a 33.4% probability they cut to below 3% next year.
In short, while there’s some uncertainty and debate about the timing of rate cuts, the direction of rates is clearly lower. Keep in mind that in the middle of next year, Jerome Powell’s term as Chairman of the Federal Reserve expires and President Trump is likely to appoint a more dovish successor.
As a simple rule of thumb, rate cuts are bullish for equities unless the market is concerned about recession and the Fed is cutting because it’s worried about a deteriorating economic outlook.
In this case, as I’ve covered at some length in recent issues, the Fed is worried about the health of the labor market. However, in my view that remains more an issue surrounding data quality than real signs of weakness or, at a minimum, softness in labor market conditions strong enough to be consistent with rising risk of an economic downturn.
I’ve covered the Bureau of Labor Statistics’ (BLS) data quality issues at some length in recent issues, so I won’t belabor the point today.
Suffice it to say that there are two main issues.
First, a decline in participation rates for the Household and Establishment Surveys. The percentage of recipients who respond to the government’s surveys has been falling for years, and that drop has turned precipitous since the 2020 COVID lockdown recession.
Recall how the BLS revision cycles work. For example, BLS released its August jobs number on September 5th and will revise it again with release of the September jobs report this Friday October 3rd (unless delayed by government shutdown) and a second time with release of the October jobs data on Friday, November 7th.
Survey response rates for the Establishment Survey at the time of the first BLS estimate have been hovering in the 40% to 45% range in recent months, climbing to 90% or higher by the time BLS releases its second and final revision to the initial preliminary estimate.
That means by the time of that second revision in early November, our read on the health of the labor market in August will be closer to the truth; however, by then the data on August jobs will be stale.
Waiting two extra months to get a valid read on labor market conditions 3 months in the past is just too long of a lag for the Fed. And there will remain a huge question mark hanging over the first and second look at each month’s payrolls data.
Second, the Fed’s preliminary benchmark revisions released earlier this month showed a massive 911,000 downward revision to payrolls over the period from April 2024 through March 2025. This estimate is based on detailed unemployment insurance records collected from the individual states, not the Establishment and Household Surveys.
It’s a far more accurate count though it’s released with an even longer lag; specifically, the preliminary benchmark revision released in early September pertains to jobs created or lost between 6 and 18 months ago.
I’ve heard some pundits and talking heads in the media blaming businesses’ (and consumers’) untimely survey responses for the poor quality of BLS data.
You can certainly blame falling survey responses for the ballooning size of first and second revisions to BLS data in recent years; however, that’s not a valid rationale for the huge scale of benchmark revisions over the past two years since they’re not based on those surveys. There’s clearly a deeper issue at work – a significant problem with the models BLS uses to convert survey data into monthly payrolls and unemployment rate estimates.
In my view, dubious labor market data coupled with the Fed’s concerns about a weakening labor market gives the benefit of any doubt to the doves.
At the same time, I don’t see concrete signs the US economy, or the labor market, are slowing enough to indicate legitimate concerns about an imminent recession:
Quiescent Claims
Initial jobless claims represent first-time filings for unemployment benefits reported to BLS by the individual states.
The series is released weekly, so it’s a higher frequency dataset that’s prone to some week-to-week noise. Nevertheless, historically when we see evidence of a weakening labor market in the monthly BLS employment data that should be confirmed by signs of a rise in claims.
That’s just not happening:
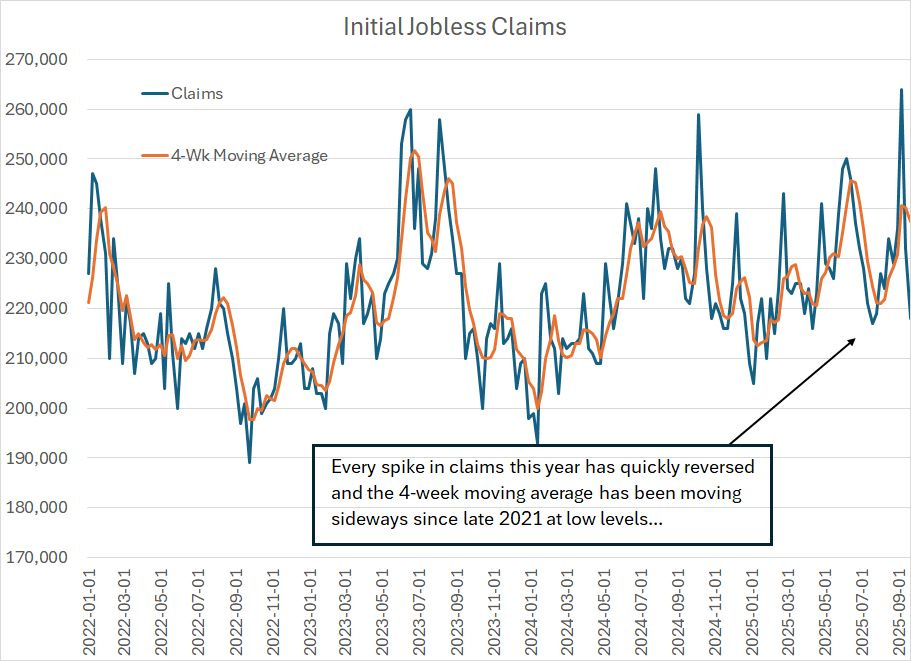
Source: Federal Reserve Bank of St. Louis, BLS
This chart shows the raw weekly claims data as a blue line and the 4-week moving average as an orange line since January 2022.
Granted, there have been some spikes and dips in claims over this period; however, claims are clearly stuck in a range between roughly 210,000 and 260,000 over this nearly four-year period.
In early September, we saw a one-week spike to over 260,000, the highest one week reading since October 2021; however, that’s quickly faded in the subsequent weeks and the 4-week moving average turned lower in the most recent week.
Just as important, is the absolute level of claims. And, weekly claims in the 250,000 range represent a very strong labor market from a long-term perspective. In my view, we’ll need to see a sustained move to near or above 300,000 per week to confirm a true softening in labor market conditions and we’re just not there yet, not even close.
Watch Government Jobs Data
One additional factor I’m watching is data on government payrolls, particularly federal government payrolls.
In recent years, federal payrolls provided an unusually large boost to the monthly BLS employment reports. However, that’s changing, and effective today an estimated 100,000 to 150,000 federal payrolls will vanish due to the Department of Government Efficiency’s (DOGE) Deferred Resignation Program (DRP) offered earlier this year.
Recall that the DRP allowed federal employees to submit their resignation effective September 30, 2025, while receiving pay and benefits through today’s date, the official end of the fiscal year for the federal government.
Since federal employees who took the DRP offer are officially on paid administrative leave through today, they are “employed” by the Bureau of Labor Statistics (BLS) definition. BLS conducts its Establishment survey through the week that contains the 12th of each calendar month, so these federal layoffs should not begin to show up in the BLS non-farm payrolls data series until the October jobs report is released in early November.
However, we are already seeing weakness in payrolls this year in the Washington DC metro area:

Source: Federal Reserve Bank of St. Louis, BLS
The Washington DC Metropolitan Statistical Area (MSA) includes DC itself as well as parts of Virginia, Maryland, and West Virginia, so it’s a big region that accounted for almost 3.39 million payrolls in the August BLS jobs report released in early September.
This chart shows total – government and private sector – payrolls for the DC MSA as an orange line (right-hand scale) since December 2020. For comparison, the blue line shows payrolls from the entire US excluding the DC MSA over the same period (left-hand scale).
As you can see, payrolls growth from the DC MSA outpaced the rest of the US through most of this period, particularly through 2023 and 2024. That’s due to a combination of a rise in direct government employment as well as payrolls that are associated with expansion in the size of the federal government.
After all, more federal employees means more demand for employees at restaurants and stores in the region as well. Meanwhile, employees at a defense or lobbying firm wouldn’t technically be government employees though, obviously, they’re supported directly or indirectly, by growth in the size of the government.
And of course, DC MSA doesn’t account for all government jobs. There are plenty of federal employees working in other states as well as payrolls associated with private companies that depend on government contracts (spending).
However, in my view, payrolls in the DCA MSA is a decent proxy for the health of federal spending and employment. And you can clearly see growth here flattered the nonfarm payrolls data for much of 2023, 2024 and into early this year, but hit a proverbial wall starting in May 2025.
And this is before the imminent loss of payrolls due to DRP.
Let me be clear that I don’t think this is enough to tip the US economy into recession. Indeed, in my opinion, the rapid expansion of federal employment and private “government-associated” payrolls in recent years was unsustainable and unhealthy.
However, I wouldn’t be at all surprised to see a severe downturn in government payrolls distort BLS payrolls estimates in coming months and lead to some nasty-looking employment reports as the loss of federal jobs has knock-on impacts. In effect, just as (excess) growth in federal payrolls dressed up employment data in 2023-24, it’s likely to act as a bit of a headwind for the same series over the next few months.
That’s likely some additional support for the doves at the Fed.
Look under all that noise and we have a central bank likely to ease rates in coming months coupled with an economy that’s stable or strengthening.
DISCLAIMER: This article is not investment advice and represents the opinions of its author, Elliott Gue. The Free Market Speculator is NOT a securities broker/dealer or an investment advisor. You are responsible for your own investment decisions. All information contained in our newsletters and posts should be independently verified with the companies mentioned, and readers should always conduct their own research and due diligence and consider obtaining professional advice before making any investment decision.
That’s a pretty bullish set-up for stocks in the near-term in my view, particularly as we enter the strongest three months of the year from a seasonal perspective.
To paraphrase John Maynard Keynes, when the facts change, I’ll change my mind, but that’s what I’m seeing right now.
For readers who missed my note earlier today, the first issue of the new Energy Bulletin publication will be out this Thursday afternoon.
Here’s a quick update of the FMS Model Portfolio table:
Keep reading with a 7-day free trial
Subscribe to The Free Market Speculator to keep reading this post and get 7 days of free access to the full post archives.