

Deconstructing Market Returns
Deconstructing Market Returns
Looking for cheap, unloved stocks with improving momentum

Returns from holding stocks can be deconstructed into three main drivers:
Changes in earnings (profits) for the portfolio of stocks you own, or the index in question.
Changes in the multiple paid for those earnings (the price to earnings ratio).
Dividends paid.
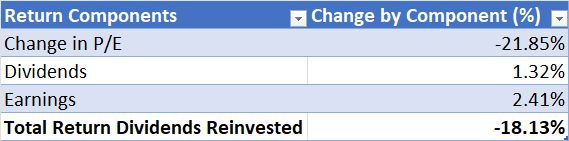
For example, let’s consider the S&P 500’s total return of -18.13% in 2022 on a dividends-reinvested basis.
The S&P 500 price change from the close on December 31, 2021 through the end of 2022, was -19.44%, so that means dividends paid and reinvested improved returns to the tune of +1.31%.
We can then turn to the price change in the S&P 500 last year. The S&P 500 closed on December 31, 2021 at 4,766.18, declining 926.68 points (19.44%) to 3,839.50 on December 30, 2022, the final trading day of the year.
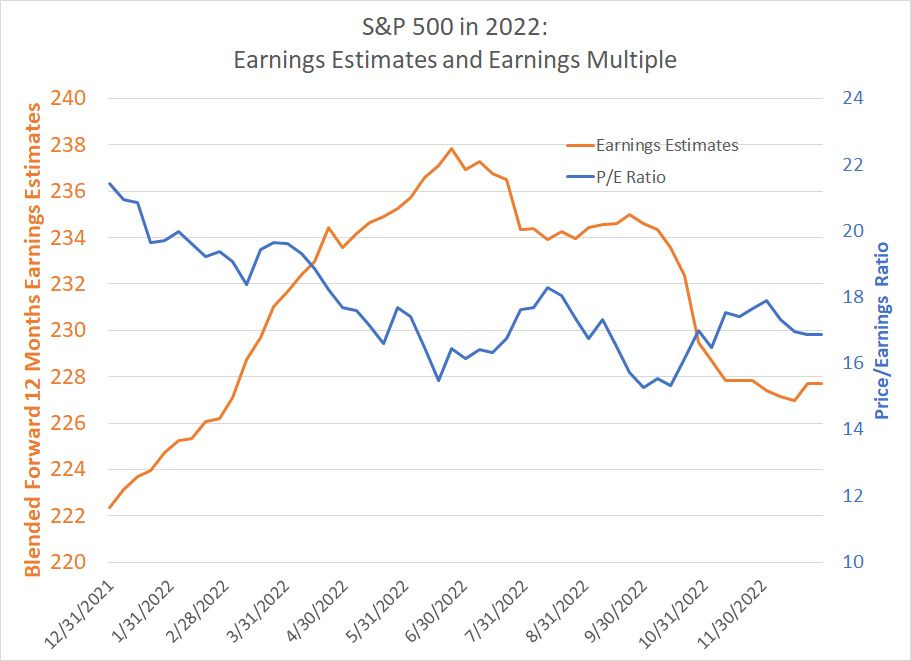
Here’s a look at earnings and the P/E multiple for the index last year:
Source: Bloomberg
The orange line shows the path of Wall Street consensus earnings estimates for the S&P 500 over the course of 2022 on a blended forward 12-month basis. As you can see, earnings estimates rose through the first half of the year, then began falling into year-end.
However, what’s interesting is at the end of last year, earnings estimates for the S&P 500 were still higher than at the end of 2021 to the tune of 2.41%.
Put in a different way, if we hold the price-to-earnings ratio for the S&P 500 constant at the year-end 2021 level, the S&P 500 would have been up about 114.70 points in 2022 rather than falling by the 926.68 points I mentioned earlier.
Simply put, the entire decline in the stock market last year was due to a significant fall in the price-to-earnings multiple from 21.44 times at the end of 2021 to 16.86 times at the end of 2022.
Here’s a look at the breakdown of all 3 return drivers for the S&P 500 last year:
Source: Bloomberg
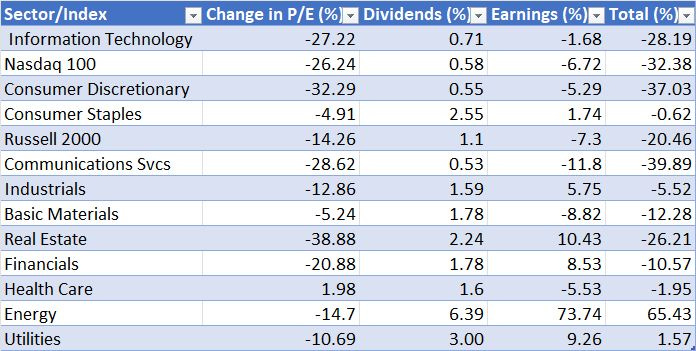
And, here’s a table showing the same basic calculation for each of the 11 sector indices in the S&P 500 as well as the Nasdaq 100 and Russell 2000 last year:
Source: Bloomberg
Every one of the indices in my table experienced a headwind from declining earnings multiples in 2022 except for the S&P 500 Health Care Index where expanding valuations added almost 2% to the overall return for the year.
Meanwhile, growth-focused indices and sectors such as the S&P 500 Information Technology Index, the Nasdaq 100, Consumer Discretionary and Communications services saw some of the largest declines in multiples in 2022. That’s because these are so-called “long duration” groups, more sensitive to the prevailing level of interest rates and inflation conditions.
Let me explain. Consider a stock like NVIDIA (NSDQ: NVDA) which trades at a little over 60 times forward earnings estimates for the fiscal year ended January 2024 and pays a paltry 4 cent per quarter dividend, which equates to a yield of 0.03% at the current quote.
Clearly, most investors aren’t buying NVDA for its dividend. And the truth is that most aren’t buying NVDA for its earnings potential over the next two or three years either -- current Wall Street consensus shows NVDA earning $7.81 in the current fiscal year, $10.82 next year and $12.99 the year after that. Add up expected earnings over the next 3 years and you get about $31.62 in profits, which represents just 6.7% of NVDA’s current share price.
Presumably, investors are buying NVDA today because of its longer -term growth potential and its exposure to the artificial intelligence (AI) growth trend.
It’s logical investors would be willing to pay a higher current multiple to earnings for a company that’s growing as fast as NVDA, but that multiple will be extremely sensitive to the discount factor you apply to future earnings.
Back to brass tacks: All companies, whether growth or value stocks, are worth the present value of all future profits and cash flows. To calculate the present value of $10 in earnings expected to be generated in 10 years’ time, we must apply some sort of discount factor. And two of the most important components of the discount factor are the prevailing level of interest rates and the inflation rate.
That’s logical also. After all, if the inflation rate is 5%, meaning the purchasing power of $1 declines by 5% annualized, you’re going to need to apply a higher discount factor to future profits than if the inflation rate is 1% or 2%. A rational investor would demand a return well above 5% annualized on their money to compensate for the risk of holding a stock and offset the expected loss in purchasing power over time.
Same with interest rates. After all, the current short-term risk-free T-Bill rate is 5%+, so are you really going to want to hold a stock if your expected return is just 5% -- why not buy the T-Bill and have a good night’s sleep?
That 70’s Show
Last year, the toxic combination of rising inflation and rising interest rates boosted the discount rate investors apply to earnings. And that has the most profound impact on companies valued based on longer-term growth prospects.
That’s long-duration stocks like NVIDIA, rather than a name like Exxon Mobil (NYSE: XOM), which is expected to generate more than $26.50 in profits per share over the next 3 years alone, an amount equivalent to 26%+ of the current share price.
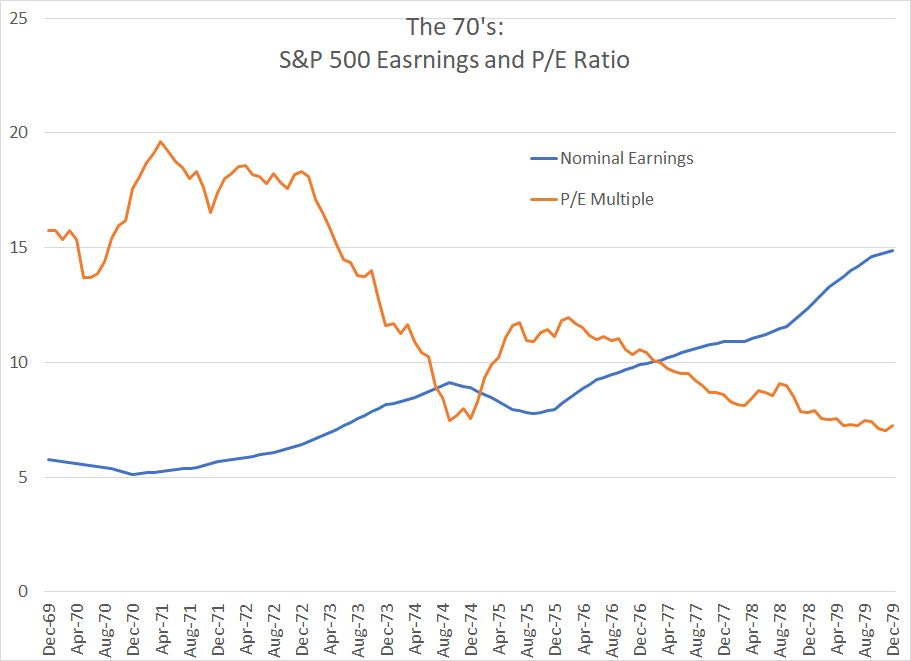
That also explains the S&P 500’s trading patterns in the late 1970’s quite well:
Source: Professor Robert Shiller Yale University
This chart shows the nominal earnings (NOT inflation-adjusted) for the S&P 500 from the end of 1969 through the end of 1979. As you can see, profits for the S&P 500 on a per index unit basis nearly tripled over this decade.
And look at earnings coming out of the 1973-1975 recession – from the summer of 1975 through the end of the decade, the S&P 500 saw strong earnings growth.
However, remember that’s on a nominal basis – by December 1979 you needed $141.25 to have the same purchasing power as $100 in August 1975. The Fed funds rate also rose from less than 5% in late 1975 to as high as 15.5% in November 1979 and 20% by early 1980.
So, while earnings rose for the S&P 500 the toxic combo of high inflation and high interest rates increased the discount factors investors applied to future earnings and catalyzed a corresponding drop in valuations – the P/E multiple for the S&P 500 plummeted from more than 19 times in April 1971 and 12 times in late 1975 to just 7 times earnings in late 1979.
That’s also a major reason why short duration sectors like energy performed best in the 1970s while growth stocks were notable underperformers.
So, that brings me to this year:
It’s all About Expanding Multiples
So far, this year has been a sort of mirror image of 2022 (and the late 70’s).
I performed a similar return deconstruction for 2023 year-to-date, adding in the 7 largest stocks in the Nasdaq 100, which are responsible for the lion’s share of market returns this year:

Source: Bloomberg
As you can see, just as falling valuations were responsible for most of last year’s sell-off, rising multiples have driven market returns so far in 2023.
Amid all the talk of a soft landing and “no recession” scenario, Wall Street earnings estimates for the S&P 500 are up less than 1% year-to-date and dividends reinvested have chipped in just over 1% to market returns. The biggest driver by a long shot is a major rise in valuations for a handful of heavily weighted and long-duration “growth” sectors in the S&P 500 including technology, consumer discretionary and communications services.
And look at the individual names in the bottom half of my table.
NVIDIA and Meta (formerly known as Facebook) have seen a significant increase in earnings estimates year-to-date; however, expanding multiples have turbocharged that increase, contributing almost one-third of NVDA’s year-to-date total return and two-thirds for Meta.
While expanding multiples are a legitimate driver of market returns in certain market environments, I believe this exposes the market to two major risks in the second half of the year.
First, when stocks get more expensive that implies investor expectations regarding growth prospects are rising, leaving investors more vulnerable to disappointment.
Last night, Netflix (NFLX) reported earnings that beat Wall Street expectations, but not by enough to please Wall Street, sending the stock tumbling 8% at the open.Trading at about 40 times forward earnings estimates as of the closing bell yesterday and up almost 62% year-to-date, NFLX was already priced for perfection.
So too results from Tesla (TSLA) that have the stock off more than 7% today even though the company beat on both the top and bottom lines last night.
The bigger risk lies ahead with most of the other long duration stocks in my table above due to report between late this month and early August – any whiff of disappointment is pure poison for stocks that are rallying based mainly on rising valuations year-to-date.
In my view the risk is particularly high for stocks leveraged to the artificial intelligence trend like MSFT and NVDA. If growth doesn’t quite live up to lofty expectations, the degree of multiple expansion we’ve seen so far this year is tough to justify.
The second problem is the rally’s dependence on rising earnings multiples makes it vulnerable to any changes in the outlook for inflation or interest rates. For example, if the economy really is headed for a soft landing rather than recession as I expect, then why would the Fed start cutting rates aggressively in the New Year as is currently baked into the Fed Funds futures market?
The Fed has been pretty clear they’re worried about a resurgence in inflation if they ease prematurely, and if the economy continues to muddle through, it’s unlikely they’d be in a hurry to cut rates.
Last week the Consumer Price Index inflation report was cooler-than-expected, but that’s not the first time that’s happened since the big surge in inflation in mid 2021. And year-over-year inflation data is flattered by the base effect; that’s because we’re comparing the current level of prices to last summer when inflation peaked on a year-over-year basis). What if inflation were to remain stubbornly high rather than continuing to drift down toward the central bank’s 2% target?
In short, the market seems to be saying the US is headed back to a low-inflation, low-rate regime much like the period from 2009-2020. Given the current tight labor market and upward pressure on commodity prices, such a scenario looks unlikely in my view and in a higher-for-longer rate and inflation environment, it’s tough to support the level of multiple expansion we’ve experienced so far in 2023.
Again, none of this means the market will turn lower near term; after all, short-term technical trends and momentum remain positive.
However, it’s further evidence of the top-heavy nature of the rally so far this year and the S&P 500’s dependence on a handful of long duration growth names.
If the rally is to continue, we’ll need to see some signs of broadening out -- more sectors and stocks will need to participate in the upside.
The good news is that valuations for many groups are far less demanding; indeed, despite the strong broader market rally, many stocks and industry groups are less crowded and already priced for recession this year.
One primary exampleis commodities. This week, Bank of America released its monthly Global Fund Manager Survey, reporting that long big US technology stocks is the most crowded trade right now for active fund managers.
Even more shocking in my view is that a whopping 78% of fund managers surveyed expect lower global inflation rates in the next 12 months; as I said, valuations for sectors like tech are tough to support unless you believe we’re headed back to a low-inflation, low-growth, and low interest rate environment. With most fund managers apparently banking on further declines in inflation, there’s significant risk sticky-high prices could derail the growth stock heavy rally.
Meanwhile, fund managers are the most underweight on commodity markets they’ve been since the height of the COVID lockdown collapse in May 2020. We’re reaching peak pessimism on commodities and related stocks just as prices begin to break higher.
And it’s not just energy:

Source: Bloomberg
This chart shows the Bloomberg Agriculture Sub-Index, which tracks the prices of a long list of soft commodities including corn, soybeans, wheat, cotton, coffee and sugar. As you can see, the long bear market in these commodities came to an end in 2020 and this index jumped higher last year breaking out to roughly the highest levels in a decade.
While we’ve seen some retrenchment from last year’s peak , the index appears to have found a low, consolidated for several months, and is now on the rise again. Indeed, wheat prices have spiked in recent days as Ukraine reported significant crop destruction following Russian bombing and Russia pulled out of a deal that had allowed grain exports from both countries following Russia’s invasion early last year.
This calls into question the consensus view food inflation has peaked this cycle.
In the Free Market Speculator model portfolio I’ve been bolstering our exposure to commodities for the last few weeks including recommendations designed to take advantage of rising natural gas prices, oil and, of course, agricultural commodities. With momentum improving, I’m likely to further increase exposure to these stock this summer.
These are all groups that are positioned well to lead any market advance in the back half of this year, and, unlike technology and growth stocks, these stocks are cheap, unloved and underowned.
DISCLAIMER: This article is not investment advice and represents the opinions of its author, Elliott Gue. The Free Market Speculator is NOT a securities broker/dealer or an investment advisor. You are responsible for your own investment decisions. All information contained in our newsletters and posts should be independently verified with the companies mentioned, and readers should always conduct their own research and due diligence and consider obtaining professional advice before making any investment decision.
Thanks for a great article, as usual. However, I think the following reasoning is incorrect:
"So, while earnings rose for the S&P 500 the toxic combo of high inflation and high interest rates increased the discount factors investors applied to future earnings and catalyzed a corresponding drop in valuations – the P/E multiple for the S&P 500 plummeted from more than 19 times in April 1971 and 12 times in late 1975 to just 7 times earnings in late 1979."
Of course, I'm not denying that PE multiples declined over this period. I'm objecting to the implication that it was rational for them to decline due to high rates of inflation and interest .
Let's suppose, for the sake of argument, that this was an average decade apart from elevated inflation and correspondingly elevated interest rates. In other words, let's assume that real interest rates and real earnings growth rates were average. Then real discount rates would also remain average, and there would be no rational reason for PE multiples to be lower than average.
Yes, in nominal terms, discount rates would be higher. But nominal earnings growth would be correspondingly higher too, because of inflation. They would cancel out.
Now, obviously I'm describing an ideal situation in which inflation has no overall effect, because everything is inflating at the same rate. The reality of inflation is more complicated. But as far as I can see your thesis is not based on such complications. It's a simple argument from higher discount rates, and I believe that argument is invalid.
P.S. I think your argument would be valid if it was based on interest rates being elevated by _more_ than inflation. In other words, if real interest rates were abnormally high. And perhaps that was indeed the case in that period. Perhaps that's what you meant by "the toxic combo of high inflation and high interest rates", but that's not clear.