

Deficits, Debt and Downgrades
Deficits, Debt and Downgrades
The Fitch US debt downgrade isn't the big news this week...

Fitch Ratings stole the headlines this week, downgrading the US sovereign debt rating by one level from AAA to AA+.
However, despite the breathless commentary in the mainstream financial media, the move wasn’t a shock as Fitch warned back in late May it was considering a downgrade, putting the US credit rating on negative watch.
Accordingly, US Treasury Bond futures and yields barely budged late Tuesday, or overnight, on the Fitch news.
The more impactful bit of news for markets was the Treasury Borrowing Advisory Committee (TBAC) quarterly refunding announcement released at 8:30 AM Wednesday, which sparked a simultaneous sell-off in both equity and bond futures (jump in yields).
Take a look:

Source: Bloomberg, SIFMA, US Treasury
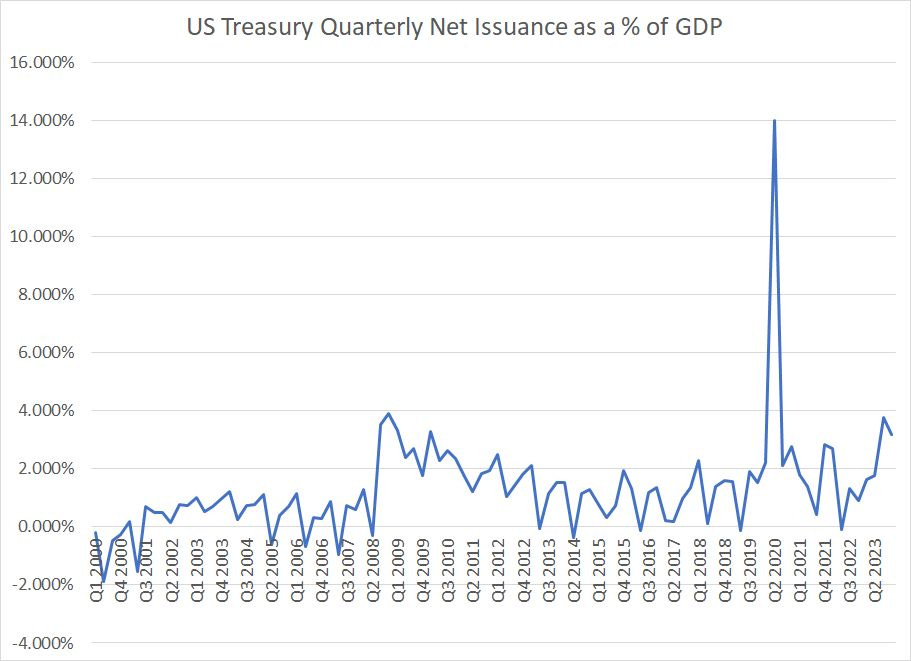
This chart shows net Treasury issuance by quarter since Q1 2000 as calculated by the Securities Industry and Financial Markets Association (SIFMA). Data for Q3 and Q4 2023 is based on TBAC’s latest estimates released on Wednesday morning.
As you can see, Treasury expects to raise more than $1 trillion in Q3 2023 in net debt – this is cash raised on top of the amount of maturing debt. In Q4 2023, TBAC is estimating the Treasury will need to raise a total of $852 billion in new debt bringing the total financing needs in the second half of the current calendar year to just under $1.86 trillion.
The only other quarter in history that can approach the current level of net Treasury issuance is Q2 2020, the height of the COVID lockdown recession and associated government spending, where Treasury raised a record of more than $2.75 trillion.
While the Treasury was expected to raise a ton of cash in Q3 and Q4 following resolution of the debt ceiling impasse back in June, the scale of issuance still managed to exceed expectations – TBAC’s own estimates released in May projected Q3 2023 net borrowing of $733 billion and Wall Street’s estimates ranged from around $800 to $900 billion just before the release.
More broadly, just look at that chart – clearly the Great Recession and Financial Crisis of 2007-09 ushered in a new era of government profligacy as quarterly borrowing needs have increased ever since. And the situation doesn’t look any less worrying if we look at quarterly net issuance as a percentage of annualized GDP:
Source: Bloomberg, SIFMA, US Treasury
What’s particularly interesting about all this is that the government isn’t just borrowing amid the depths of a US recession as it did in the 2007-09 era and the early stages of the ensuing economic recovery. Rather, the US government’s borrowing is in the context of a generally strong US economy since 2021 with unemployment near multi-decade lows.
The government is spending pro-cyclically rather than counter-cyclically.
Is there really any wonder the combination of heavy borrowing, massive deficits and ultra-low interest rates helped ignite inflation over the past three years?
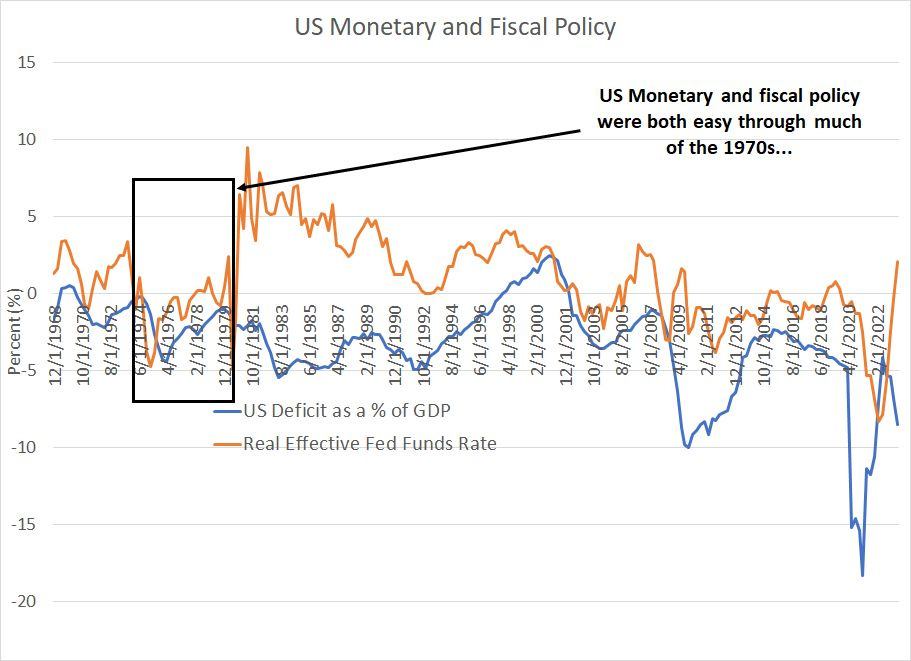
After all, look at the conduct of monetary and fiscal policy in the 1970s and compare it to the current situation:
Source: Bloomberg
This chart shows the quarter US government deficit as a percentage of GDP in blue – deficits show up as a negative number and surpluses as a positive number – as well as the current real effective funds rate (I used the year-over-year change in CPI).
So, negative real rates generally represent monetary stimulus and deficits represent fiscal stimulus. In the 1970s the US government generally ran significant budget deficits while, for most of the decade, the real Fed funds rate was negative.
In the 1980s US government budget deficits increased mainly due to higher defense spending, but that was offset by higher, positive real interest rates, which helped quell the gain in prices.
However, the sheer scale of coordinated monetary and fiscal stimulus following the COVID lockdown recessions in 2020 is unprecedented in the postwar era for the US.
Stimulus of this magnitude can probably be absorbed amid a deep recession like 2007-09 without causing much inflation. However, when you see coordinated stimulus of this magnitude when the economy is growing as it was by the second half of 2020, the results are predictable.
Longer term concerns about deficits and debt aside, Treasury’s quarterly refunding statement is troubling for a second reason.
Crowding Out Part II
Back in my May 30th post “Crowding Out,” I wrote about a potential negative side effect of the debt ceiling resolution.
Let me summarize in brief.
The Treasury General Account (TGA) is essentially the US government’s current/checking account held at the Federal Reserve. When the Treasury hit the debt ceiling in January it was no longer able to issue new Treasury bonds and bills to raise cash needed to fund the government’s yawning budget deficit (almost 8.5% of GDP in Q2 2023).
As a result, Treasury faced a steady decline TGA balances, which reached a low of less than $23 billion in early June, down from around $430 billion as of calendar yearend 2022.
The debt ceiling deal reached in early June freed the government from those borrowing restrictions, and Treasury planned a wave of debt sales immediately in June to build the TGA back to a more comfortable level of around $450 billion by the end of the month.
The problem is the TGA represents a liability on the Fed’s balance sheet in the same way a deposit you hold at your bank represents a liability on that bank’s balance sheet. So, when Treasury issues new debt to replenish the TGA, the size of total liabilities on the Fed’s balance sheet also rises; to make the balance sheet, well, “balance,” either assets held by the Fed need to increase or other liabilities need to decline to offset the TGA’s rise.
There were, and are, two main ways for that to happen.
First, bank reserves could decline. Reserves are deposits held by commercial banks at the central bank; if individuals or corporates buy Treasury bonds or bills, they’re likely to pay for those purchases using money withdrawn from a checking account. Such withdrawals would likely result in a decline in reserve balances banks hold at the Fed; banks would effectively draw down their reserves to fund withdrawals needed to pay for newly issued Treasury bonds.
Second, another major liability at the Fed is what’s called reverse repurchase (RRP) agreements.
The Reverse Repo facility is essentially a way for banks or other entities to park money at the Fed on a short-term basis and earn a yield that’s currently above 5% -- most of the cash in this facility represents assets of money market funds.
Bank reserves are the lifeblood of the economy since they underpin lending and credit activity across the economy. So, if new Treasury borrowing causes bank reserves to drop, that’s likely to result in a tightening of private credit across the economy and, by extension, would tend to slow economic activity.
However, if new Treasury issuance were to be funded by a decline in RRP the result, in terms of economic impact, is less onerous.
Of course, Treasury understands this risk. To avoid a destabilizing drop in reserves, they responded by selling mainly short-term Treasury Bills rather than longer-term Treasury Notes and Bonds to replenish the TGA back in June:
Source: Bloomberg, SIFMA, Treasury
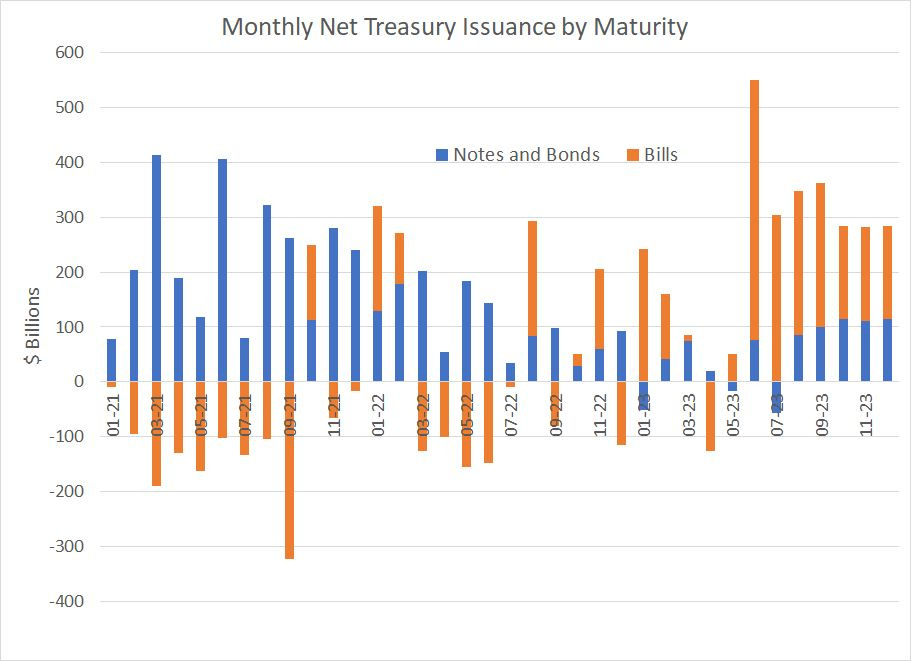
This chart shows the breakdown of Treasury net issuance since January 2021 and includes a simple estimate based on TBAC’s latest quarterly refunding estimates for Q3 and Q4 2023.
As you can see, most of the heavy-lifting in the Treasury’s borrowing binge in June came in the form of T-Bills. In July that trend continued with Treasury actually showing a negative net issuance for notes and bonds (maturing bonds and notes exceeded new issuance).
The trend is set to end this month. In August, the Treasury plans net issuance of about $85 billion in new notes and bonds, rising to around $100 billion next month and $113.7 billion in October. That would represent the largest net issuance of new bonds and notes since June 2022.
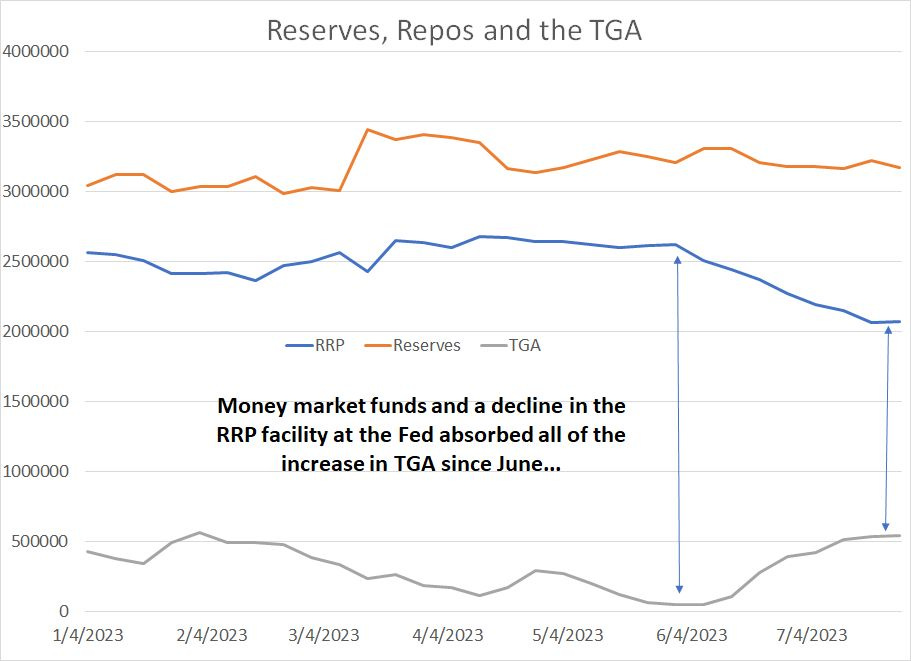
Money market funds can (and do) buy Treasury Bills, so the surge in Treasury bill issuance back in June and July was mainly absorbed by a decline in the RRP facility. Simply put, money market funds removed cash help in the Fed’s RRP facility and bought T-Bills because rates paid on bills is slightly higher than what’s available in RRP.
You can see it here:
Source: Bloomberg
As you can see, bank reserves have risen slightly this year and have remained flat since early June as the RRP has absorbed Treasury’s bill issuance since early June.
The problem is money market funds can’t buy longer-term Treasury notes and bonds and Treasury can’t meet all of its borrowing needs with 30- and 90-day T-Bills. So, over the next few months I do expect planned, stepped-up issuance of longer-term notes and bonds to lead to at least some decline in bank reserves.
Of course, this is in addition to the Fed’s ongoing quantitative tightening (QT):
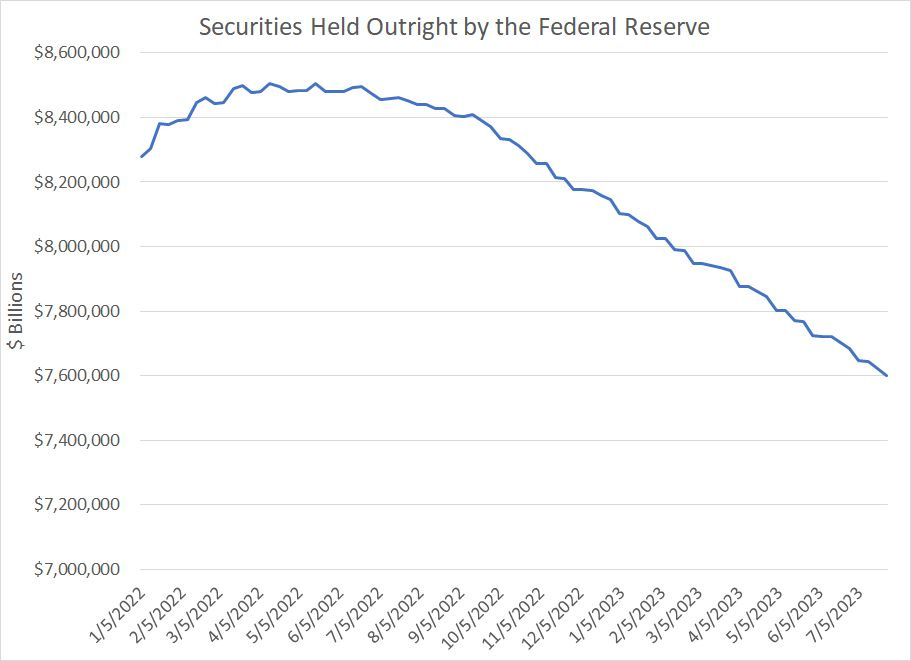
Source: Bloomberg, Federal Reserve
This chart shows the value of securities held outright by the Federal Reserve, primarily Treasuries and mortgage-backed securities (MBS). The central bank purchased these bonds under its quantitative easing campaign put in place amid the initial COVID outbreak in early 2020.
As you can see, the Fed started reducing its holdings of securities in mid-2022 and accelerated the pace of QT last autumn.
Securities are held on the Fed’s balance sheet as an asset, so by driving down the asset side of its balance sheet through QT, one of two things must happen: Either other assets held by the Fed must increase, or liabilities must fall to keep the Fed’s accounts in balance.
Put in a (slightly) different way, the Fed was buying US Treasuries under quantitative easing (QE), absorbing a significant portion of new Treasury issuance in recent years. With the Fed no longer buying, the Treasury must turn to either the private sector or foreign central banks to fund its borrowing needs.
So, again, that means the liabilities side of the Fed’s balance sheet must adjust. Bank reserves must fall as people draw down their commercial bank deposits to fund new Treasury issuance, or money market funds can draw down the RRP to buy new T-Bills.
As the Treasury’s borrowing needs continue to balloon, and the government is forced to rely more on bond and note issuance rather than T-Bills, it’s likely more of this adjustment burden will fall on bank reserves.
As I explained in my post earlier this week “It’s a Bull’s World,” none of this means we’ve seen the 2023 peak for the S&P 500.
However, I continue to believe there remain large, underappreciated risks facing the US economy and markets this year and, ultimately, buying US stocks at current inflated levels will produce sub-par long-term returns.
Wouldn’t it be ironic if growing signs of economic and market stress start showing up in coming months just after the Fed, and high-profile economists at major Wall Street banks start to talk up the prospects of a soft landing?
DISCLAIMER: This article is not investment advice and represents the opinions of its author, Elliott Gue. The Free Market Speculator is NOT a securities broker/dealer or an investment advisor. You are responsible for your own investment decisions. All information contained in our newsletters and posts should be independently verified with the companies mentioned, and readers should always conduct their own research and due diligence and consider obtaining professional advice before making any investment decision.
This article is gold! Why are there no comments?