

Earnings and the Deteriorating Market Outlook
Earnings and the Deteriorating Market Outlook
Why nothing good happens under the 200-day moving average

About half of all stocks in the S&P 500 have reported quarterly earnings through Friday’s close.
On the plus side, almost 79% have beaten consensus earnings expectations, in-line with last earnings season at 79.8% and better than the long-term average.
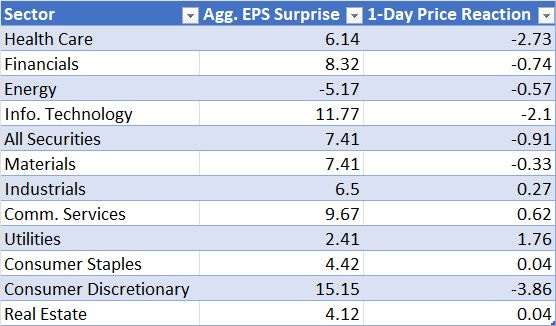
The bad news is stocks aren’t acting well following their results:
Source: Bloomberg
As you can see, the aggregate earnings beat for every sector in the S&P 500 except energy is positive; yet the average S&P 500 stock reporting to date falls about 0.91% in the day after its earnings release.
Particularly worrying in my view is the action in the Information Technology sector. The aggregate earnings beat so far this quarter stands at a whopping 11.8%; yet, the average tech stock reporting to date falls over 2% on the trading day following its earnings release.
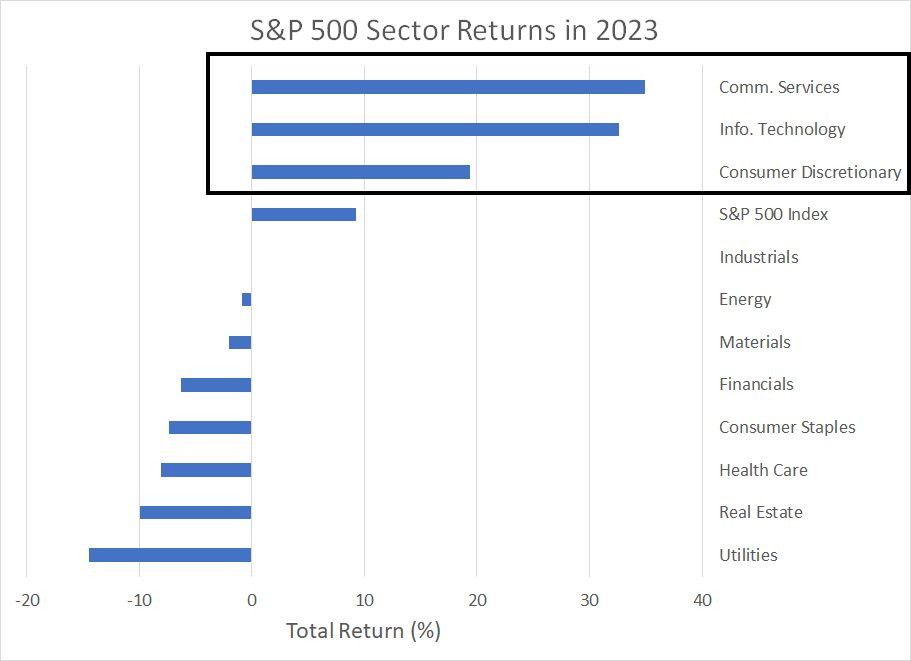
Recall that so far in 2023 only 3 of the 11 economic sector indices in the S&P 500 are producing positive returns:
Source: Bloomberg
Fortunately for the market capitalization weighted S&P 500, the three sectors that have performed well this year – Tech, Consumer Discretionary and Communications Services – produced outsized gains and comprise more than 47% of total index weight. That’s why the S&P 500 is up about 9% this year even as the Equal-Weighted version of the index is down about 2.7%.
Two of these market-leading sectors – tech and discretionary – have generated the strongest earnings beats so far in Q3 2023 reporting season, but have also experienced the most negative reactions to those earnings beats of any sector in the S&P 500.
A stock’s reaction to news always tells you more than the news itself.
In this case, the fact stocks in leading market sectors are both beating expectations and selling off on the news suggests either the “good” news was already priced into the stock leading up to the report and/or investors have decided to use good earnings news as an opportunity to book profits.
And take a look at this:

Source: Bloomberg
This chart depicts what’s known as earnings revision momentum (ERM) for the three leadership sectors in the S&P 500 – tech, discretionary and communications services – since late 2021.
This metric looks at 12-month forward analyst earnings estimates over a trailing 4-week period using the following formula:
(Positive Earnings Revisions - Negative Revisions) / Total Revisions
So a positive ERM means that analysts are generally raising their earnings estimates for stocks in that sector, while a negative ERM shows the opposite.
Historically, analysts are most active in altering their earnings estimates during quarterly earnings season – after all, that’s when companies update their results and, in some cases, offer explicit guidance about the outlook for their core businesses. Even when a company doesn’t offer long-term guidance, you can usually glean additional color by listening in on a particular company’s quarterly earnings call and, my personal favorite, the Q&A session with analysts that follows these calls.
If you look at my chart above, you’ll see I’ve labeled (roughly) each quarterly earnings reporting season since the end of 2021. So, you can see the evolution of earnings results and expectations for these three key sectors starting at the tail end of the 2020-2021 bull market, through the entire market sell-off last year, and amid the stock market recovery so far in 2023.
As you can see, Q4 2021 earnings season was decent, with a nice flurry of upside earnings revisions in January-February 2022. After that, the earnings picture notably deteriorated – earnings momentum was clearly negative for most of last year and saw only a modest and short-lived uptick around Q1, Q2 and Q3 2022 earnings reporting seasons.
That weakness also extended into this year as Q4 2022 reporting season in January-February 2023 also resulted in only a short-lived and modest blip higher in revision momentum.
The big shift started in Q1 2023 and Q2 2023 earnings seasons in April-May and July-August 2023 respectively when upward revisions dominated.
Against that backdrop, it’s not a huge surprise the period from end-March through end-July of this year was a great time to be invested in these 3 leading sectors with Technology up 20.3%, Discretionary up 17.4% and Communications Services up 20.9% compared to the S&P 500 up about 12.2%.
In other words, steady positive earnings revisions offered a powerful tailwind for much of the spring and summer of this year.
However, we’re now seeing a clear and notable deterioration again – earnings revision momentum is negative for all three leadership groups as we enter the heart of Q3 2023 earnings season. This suggests analysts are generally coming away from recent quarterly earnings reports with either explicit cautious guidance from management teams or at least some signs of uncertainty that are powerful enough to warrant reducing forward earnings estimates.
These headwinds are showing up in the charts of all three market leadership groups.
Let’s start with Consumer Discretionary:

Source: Bloomberg
You may have heard the old saw “Nothing good happens after 2 AM.”
Well, there’s a corollary in financial markets that nothing good happens under the 200-day simple moving average. This chart shows the S&P 500 Consumer Discretionary Index since late 2019 with the 200-day moving average overlaid in orange. This index is dominated by Amazon.com (NSDQ: AMZN) and Tesla (NSDQ: TSLA), which together account for a little over 40% of the index weight.
What’s interesting is this index popped over its 200-day moving average in May and rallied more than 20% to a peak in July. However, it’s been consistently downhill from there, and the index slipped back below its 200-day moving average on October 19th.
Even a blow-out earnings release and a near 7% rally in Amazon.com on Friday, the single largest component of the index, hasn’t been enough to push the index back over that key long-term moving average.
Technology and Communications Services both look healthier than discretionary; however, both are approaching key support levels and look vulnerable.
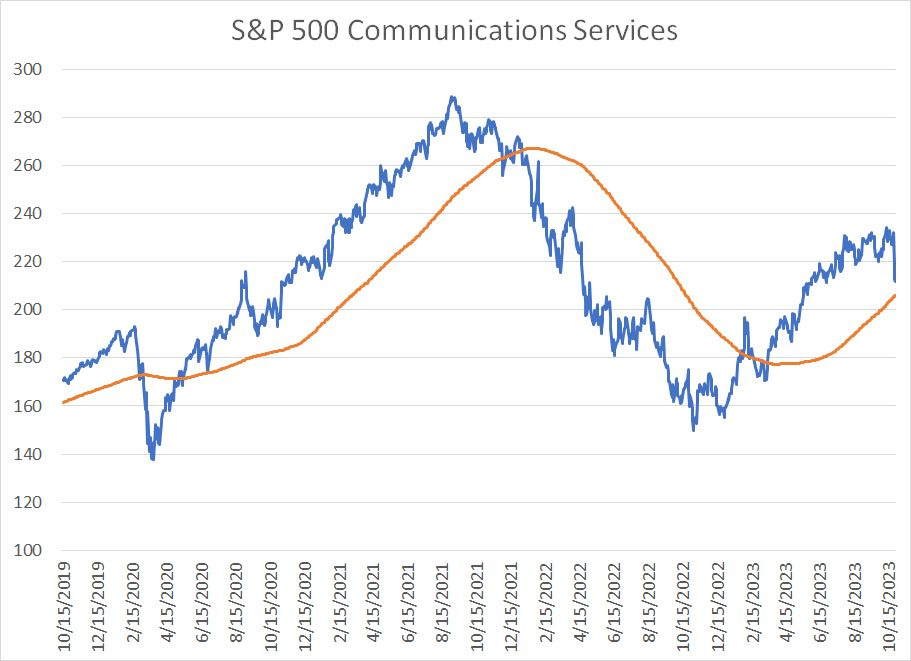
Here’s a look at Communications Services:
Source: Bloomberg
Once again, the 200-day simple moving average has been a useful guide for the intermediate to long-term trend for this sector index over the past four years – the break above the 200-day back in June 2020 and the break below the 200-day in late 2021/early 2022 both “worked” signaling powerful moves higher and lower respectively.
This index is still roughly 2% to 3% above its 200-day moving average, but it wouldn’t take much additional weakness as we move through earnings season for that to change.
Finally, here’s tech:

Source: Bloomberg
This may be the single most important chart to watch over the next few trading days for the simple reason it’s (by far) the largest sector in the S&P 500 and it’s the only leadership group which set a fresh all-time high in 2023.
As with Communications Services, the S&P 500 Technology Index is sitting about 2.5% above its 200-day moving average with industry heavyweight Apple (NSDQ: AAPL) due to report in early November. Should technology break down below its 200-day moving average on a closing basis that would likely end any hope of a year-end seasonal rally in the S&P 500 and would represent a gale-force headwind for the broader market into next year.
Often, successful investing (and trading) is more about trying to comprehend what markets are telling you than attempting to forecast the future. And right now, I can’t shake a sense that markets are shouting the US and global economy aren’t as healthy as some of the economic data might suggest.
Negative earnings revisions I just outlined, the bid we’ve seen in gold this month and in long-term Treasury bonds over the past few days all suggest a market that’s growing increasingly cautious about the future, and the soft-landing/immaculate disinflation narrative. Even more so, the steepening of the yield curve after a prolonged period of inversion is a time-worn sign of imminent recession.
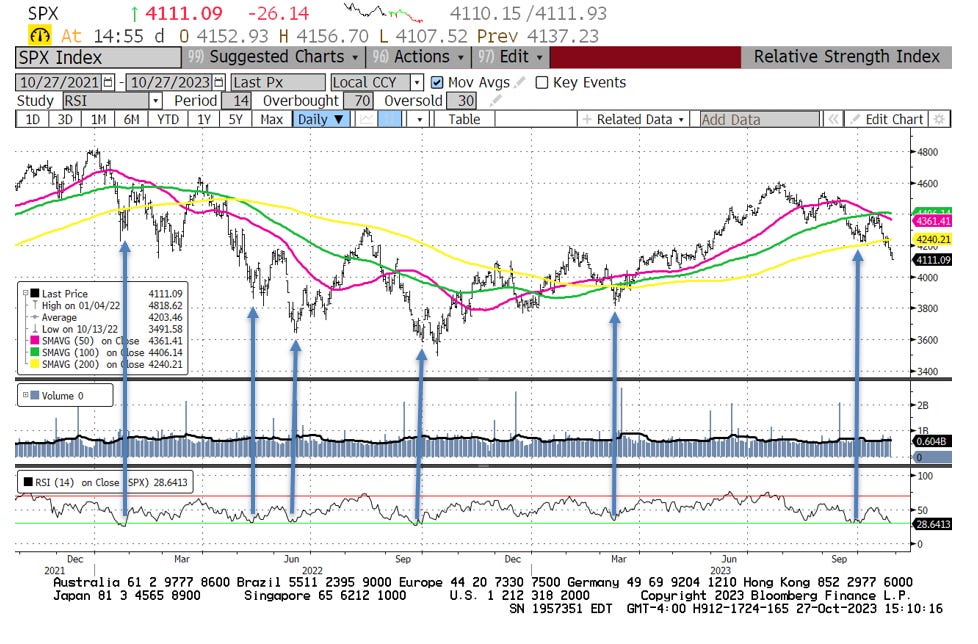
I’m always reluctant to get too bearish on stocks at this time of year because long-term probabilities heavily favor a year-end rally in the S&P 500. Also, in the short run, equity markets look oversold and due a bounce:
Source: Bloomberg
I like to watch the 14-day relative strength index (RSI) on the S&P 500 and, as you can see right now, it’s at 28.6, below the 30 level that defines oversold. As you can see from the arrows on my chart prior, similar episodes have tended to catalyze at least short-term rallies in the index.
However, my inclination would be to sell any such rallies.
Specifically, here are a few broader themes I’m watching, or continue to recommend, for the model portfolio in the paid tier of FMS:
We’re in an inflationary recession cycle and, as I explained in “Commodities, Recessions and Inflation,” commodities tend to see accelerated upside in inflationary cycles driven more by supply than demand — I continue to like energy, precious metals and agriculture-levered names.
If the US economy is weaker than the consensus believes as I expect, the Fed’s next move is more likely to be a cut than additional hikes and, as I explained in “About those Bonds…” I believe select US Treasury bond ETFs offer an asymmetric risk-reward proposition from current levels.
I already recommend a sizable cash position in the model portfolio, but am likely to recommend raising more cash on rallies while taking on some direct bearish exposure via inverse ETFs.
Often, late in an economic cycle you’ll see shifts in market leadership with money rotating out of the erstwhile leaders and into industry groups and markets that have lagged.
If you’re not yet a paid reader to FMS, I’m still offering 60-day free trials to the service via this link:
This offer closes Friday November 3rd.
DISCLAIMER: This article is not investment advice and represents the opinions of its author, Elliott Gue. The Free Market Speculator is NOT a securities broker/dealer or an investment advisor. You are responsible for your own investment decisions. All information contained in our newsletters and posts should be independently verified with the companies mentioned, and readers should always conduct their own research and due diligence and consider obtaining professional advice before making any investment decision.