

Earnings Season: Laggards Become Leaders
Earnings Season: Laggards Become Leaders
A pivotal week ahead for equity markets...

This week is pivotal for equity markets: A total of 165 S&P 500 companies with a combined market capitalization over $14.9 trillion are due to report quarterly results.
That’s around a third of total S&P market cap and includes index heavyweights Microsoft (NSDQ: MSFT) and Google (NSDQ: GOOGL) due to report after the close today as well as Meta (NSDQ: META) due out after the close tomorrow.
Of course, the other headline event this week is Fed decision day tomorrow. Fed Funds futures markets currently assign 95% probability the Fed hikes by 25 basis points this week; however, markets are looking for this to be the last hike of the cycle with futures penciling in a 38% shot the Fed hikes one final time at its November 1, 2023 meeting.
It's early but, thus far, earnings season has provided a few clues regarding market sentiment:

Source: Bloomberg
To create this table, I examined only S&P 500 companies that reported in the weeks ended July 14th and July 21st, eliminating results from companies with non-standard fiscal calendars, reporting back in June.
As you can see, 32 financial stocks have reported so far this quarter, dominating the early earnings season calendar.
Financials: Rotation and Sigh of Relief
Three-quarters of financial stocks reporting to date have beaten consensus Wall Street earnings estimates heading into the quarter and, even more important, the average 1-day return from financial stocks reporting so far is about 0.5% better than the S&P 500 on the same trading day.
And that’s even though the average financial stock reporting to date outperformed the S&P 500 by almost 3% in the four weeks leading up to their earning releases.
In other words, most financials have outperformed the market over the past month, exceeded earnings estimates for Q2 and then outperformed the S&P 500 in the trading day after their calls.
Generally, that’s the pattern I’d expect for a sector that’s benefiting from improving investor sentiment and investment inflows. However, it doesn’t appear the good news is fully priced into the stocks just yet since the average financial reporting to date manages to outperform the broader market following its release.
It's also worth watching the sub-sectors within financials.
The worst-performing group within financials so far this quarter is insurance, dominated by the 13%+ plunge in Progressive (NYSE: PGR) in the wake of its earnings release on July 13th. That appears to be a function of elevated catastrophic losses in Q2 2023 due to a series of weather events including thunderstorms, hail and tornados in the March through May period.
Catastrophic losses are part of the insurance business. The outsized negative reaction may be due, in part, to jitters ahead of the August-October period, the height of Atlantic hurricane season that often accounts for a surge in claims across the industry.
On the other hand, banks have generally seen positive results following earnings released to date.
While JP Morgan Chase (NYSE: JPM) only managed a small rally following its release on the 14th, the stock was up about 5% in the month before it reported earnings.
In addition, the stock broke above a key resistance level in the $145 -$147 region in late June and has held that support ever since:
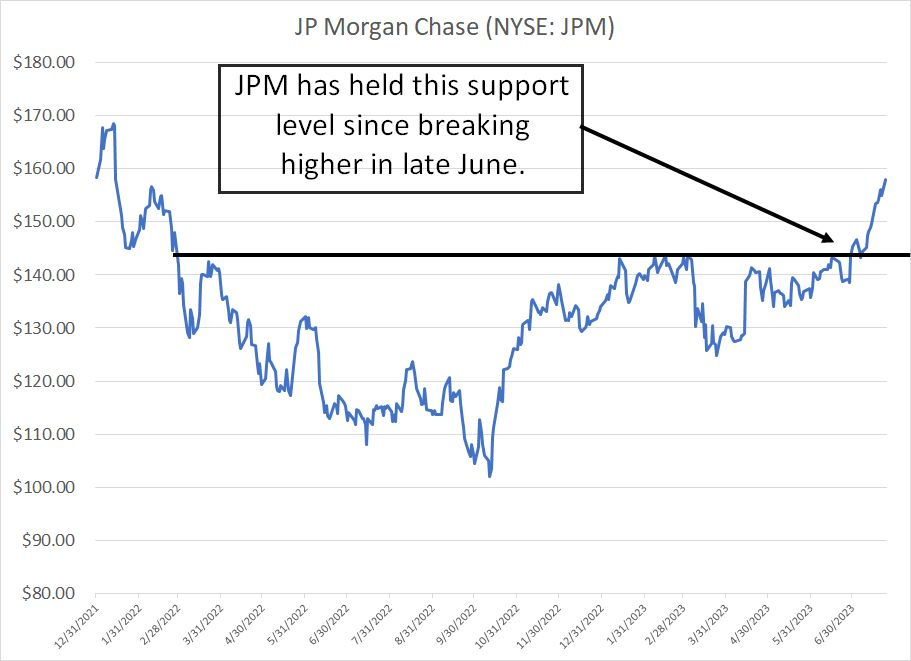
Source: Bloomberg
While not universally positive, it’s also encouraging to see strong post-earnings gains for several regional banks reporting to date, including a few names that were badly battered amid the mini crisis earlier this year.
Zions Bancorporation (NSDQ: ZION) surged almost 10% on the trading day after its July 19th earnings release after reporting a 3% quarter-over-quarter increase in customer deposits.
Of course, a primary concern swirling about the group earlier this year was that the failures of Silicon Valley Bank and Signature Bank could prompt massive deposit flight out of the regionals and into the largest banks subject to the most stringent capital requirements. Growing deposits at ZION, one of the banks considered more vulnerable to deposit flight, helps assuage those concerns.
ZION has now broken above an important technical resistance level on the charts:
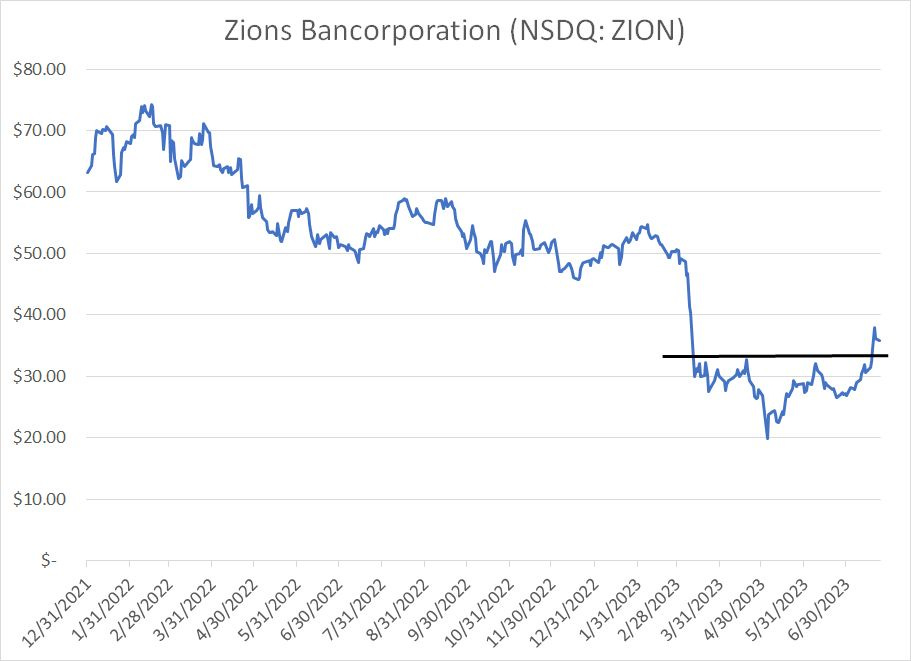
Source: Bloomberg
It’s worth noting that ZION, even after the recent rally, is still down more than 25% year-to-date, but the break above that $32.50 to $35 resistance level puts the stock back at the highest level since March 10th, the early days of the regional banking mess.
Other regionals including Keycorp (NYSE: KEY), Fifth Third (NSDQ: FITB) and M&T Bank (NYSE: MTB) also saw solid gains following their earnings releases over the past two weeks.
All told, I see two drivers for the sector’s positive reaction to earnings thus far this quarter.
First, it seems we’re starting to see the broader sector rotation I’ve been writing about since June:
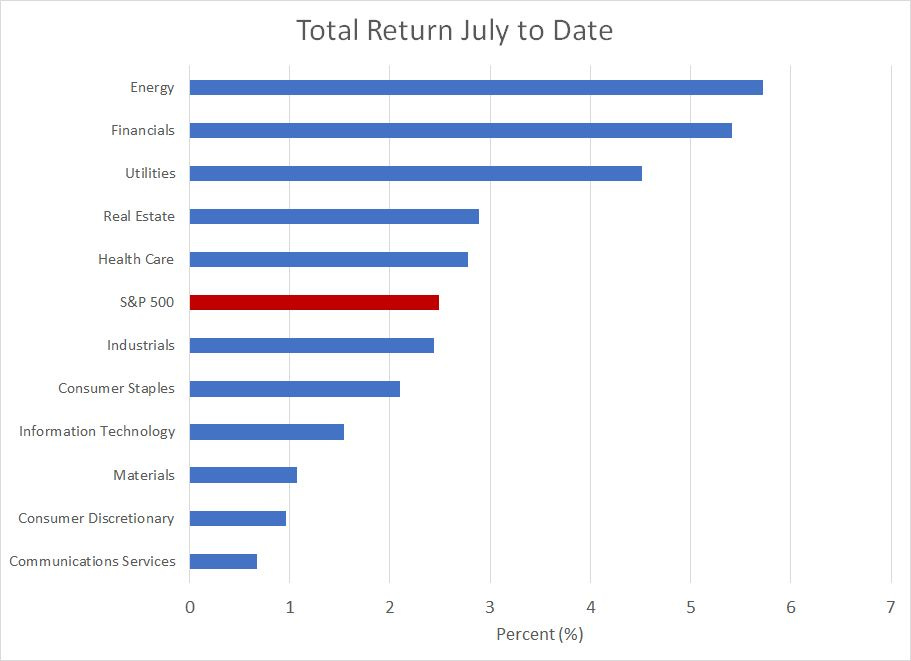
Source: Bloomberg
This chart shows the month-to-date performance for all 11 S&P 500 Economic Sector Indices as well as for the S&P 500 as a whole (red bar). As you can see, financials are the second-best performing group this month, up more than 5.4% and trailing only energy. That follows a -0.53% decline for the first six months of 2023, well behind the 16.9% rally in the S&P 500 over the same period.
Also note the three sectors that dominated returns for the first half of the year – technology, communications services, and consumer discretionary – all rank in the bottom four sectors on a return basis so far this month, underperforming the broader market by a significant margin.
Financials have a roughly 12.8% weight in the S&P 500, behind only technology (28%) and health care (13.5%), so any investor wishing to position for sector rotation out of the top-heavy, first-half growth leaders and into laggard groups would, by definition, be buying the financials right now.
The second factor driving financials is that some of the market’s worst fears amid the March-April regional banking crisis never materialized. While the collapse of a handful of large regionals did expose serious vulnerabilities in the group, we did not see the domino-like failures amid a contagious industry-wide run on the regional banks.
Regardless, I still see some key headwinds for the financials already showing up in quarterly results.
Specifically, while regional banks like Zion did manage to grow deposits, there was a price – in Q2 2023 the bank’s overall cost of funding stood at 1.27%, up from 0.47% in Q1 2023, an increase of 80 basis points.
Noninterest-bearing deposits shrank $4.6 billion in Q2 to $29.8 billion while the bank was forced to pay a higher rate of interest to attract customers for its interest-bearing deposit products.
Of course, this is a direct result of the ongoing rise in interest rates. When rates were near zero in early 2022, there was little economic incentive to shop around for the highest yields. However, with US money market funds and Treasury Bills yielding north of 5%, there’s a significant opportunity cost to holding significant sums in a noninterest bearing checking account, or a savings product with your local bank yielding well below T-Bills.
As rates rose more significantly between last summer and early 2023, consumers began to take notice, and banks are now having to pay up for deposits to avoid flight to higher yielding products.
Of course, rising rates also benefit banks by boosting the interest rate charged on loans. Commercial and industrial (C&I) loans, for example, charge floating rates with the rate re-setting higher as benchmarks like 3-Month T-Bill yields rise. The problem for banks like ZION is that interest charged on loans isn’t rising as quickly as interest paid on deposits, so the profit margin – the net interest margin (NIM) – for many banks is starting to get squeezed.
In ZION’s case, the yields on all loans increased from 5.3% in Q1 to 5.65%, a gain of 35 basis points compared to that 80 basis point bump in ZION’s funding costs I noted earlier. Overall net interest income – the total amount earned in interest paid on loans less the cost of deposits – fell to $591 million in Q2 with the NIM falling 41 basis points to 2.92%.
In addition, let’s not forget this:
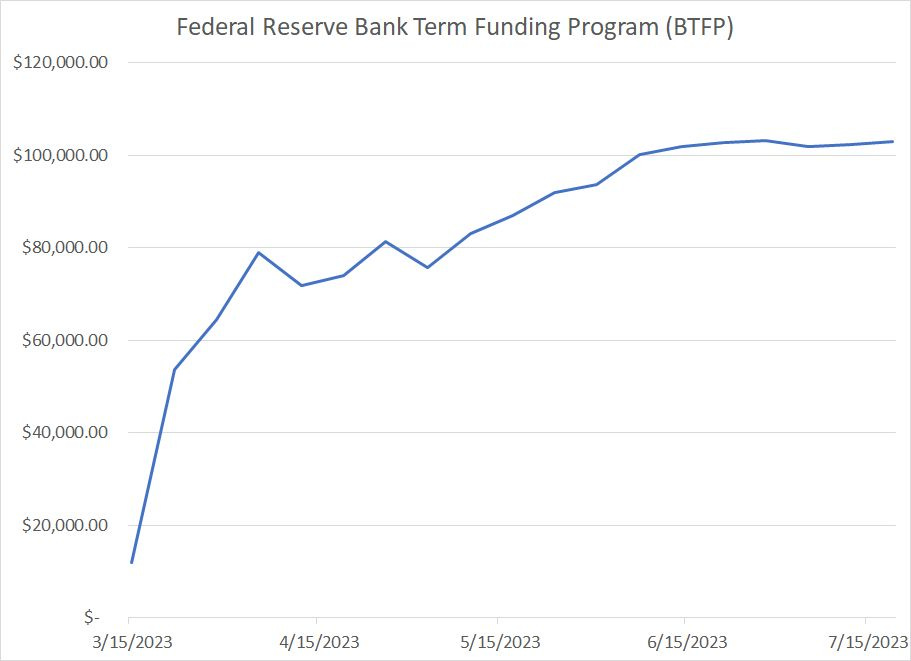
Source: Bloomberg, Federal Reserve
This chart shows total balances of loans outstanding for the Federal Reserve’s Bank Term Funding Program (BTFP), the facility created by the central bank in response to the regional banking mini crisis last spring. The BTFP allows banks to pledge securities –Treasury bonds and Mortgage-Backed Securities – as collateral against longer term loans from the Fed.
The idea was that if depositors were to withdraw their money from the regionals amid an industry-wide contagion, the banks might not be able to raise cash fast enough to make good on their deposits. When Silicon Valley Bank faced deposit flight earlier this year, their response was to sell down their securities portfolio at a steep loss, a decision which sparked the collapse of SVB and marked the start of the crisis.
The BTFP allowed the banks to borrow money from the Fed rather than selling their securities outright; even better, the Fed’s BTFP accepts Treasuries as collateral at face value rather than prevailing, lower market prices.
As you can see, this newly created facility is popular – as of the most recent weekly report from the Fed, banks in the US had already borrowed almost $103 billion using the BTFP facility, a level that’s been almost constant since May.
So, the question is this: Can we really declare the regional banking crisis solved when the banks are still borrowing more than $100 billion from the Fed through the BTFP?
Bottom line: Financial stocks are performing well and remain a prime beneficiary of the sector rotation I see continuing through the second half of 2023. The worst fears about regional contagion earlier this year have eased, and I see some of the regional banks as high-quality names trading at attractive valuations.
It’s tempting to add direct exposure to the regionals in the model portfolio. However, my lingering concern remains that the solvency and liquidity crisis that dogged the group last spring may simply morph into a profitability crisis later this year as rising deposit costs squeeze net interest margins further.
As I’ll explain in a moment, we do have modest exposure to the group via one of the exchange traded fund (ETF) holdings in the model portfolio. I’m comfortable with that diversified exposure at this time; in fact, I’m recommending you increase your allocation this week as I’ll explain the “Actions to Take” section below.
And that brings me to a second sector that’s showing encouraging trends through earnings season this quarter:
Energy on the Move
Flip back to my table of earnings performance quarter-to-date above and you’ll see only four energy stocks in the S&P 500 have reported earnings through the July 21st weekly close, so to say it’s early days is an understatement.
For the four stocks that have reported earnings, all have beaten consensus earnings estimates, but have underperformed the S&P 500 in the day following their release. At first blush that might seem like bad news. After all, when a company beats expectations, and the stock sells off following the news that can be a sign the best news was already baked in valuations ahead of the release.
Indeed, I’ve received a few questions from readers asking why stocks like oil service giant SLB (NYSE: SLB), formerly known as Schlumberger, sold off after beating analysts’ expectations on revenues and earnings.
In this case, I believe the answer lies in the final column in my table above – the performance of each stock in the 4 weeks leading up to their earnings release. In this case, the average energy stock reporting earnings so far this quarter outperformed the S&P 500 by a whopping 12 percentage points over just the four weeks before the release, by far the largest outperformance of any sector in the S&P 500 on this basis.
Following significant outperformance, the four energy stocks reporting thus far only underperformed by 0.6% on the trading day after their earnings calls. Simply put, it’s only natural a stock might see a bit of profit-taking after a blistering run higher; regardless, the selling pressure post-earnings has been mild in comparison to the run-up that preceded it.
I see three drivers of energy’s recent spate of outperformance.
First, much like the financials, the sector remains a beneficiary of ongoing rotation in favor of the market’s erstwhile laggards into the second half of the year. Energy was the second-worst performing index in the S&P 500 in the first half of the year, falling 5.55% and underperforming the S&P by over 20 percentage points, albeit following an historic 80+ percentage points of outperformance in 2022.
Energy is also a small sector, accounting for less than 5% of the S&P 500.
So, investors seeking to position for a broadening out of the rally in the second half would likely seek increased exposure to the sector. And, since it’s such a small group relative to, for example, financials it doesn’t take much of a shift in institutional investment allocations to drive significant outperformance.
I suspect that’s underway right now.
Second, as I’ve explained before, fundamentals and valuations tend to drive the stock market over the long-term; however, it’s sentiment that drives stocks in the short-to-intermediate term. And sentiment is particularly important to watch around the quarter and year-end periods, since these are times when institutional asset managers tend to rebalance their portfolios.
In particular, I watch for extremes:

Source: Bloomberg
This chart uses the weekly commitment of traders (COT) reports for both the US-traded West Texas Intermediate (WTI) crude oil futures and global benchmark Brent oil futures. Specifically, this chart shows the net position of managed money (speculators) in both oil futures markets as a Z-score based on the three- year average.
The current reading is -0.85, which suggests speculators hold a net position in oil that’s about 0.85 standard deviations below the three-year average. Generally, I look for a net position around 2 standard deviations below average to indicate extreme levels of negative sentiment toward oil markets. And, while the latest reading isn’t quite there, as you can see, sentiment has been consistently bearish for oil for much of 2023 and we’ve dipped on multiple occasions to that key -2 standard deviations signal region.
This is further backed up by results from the latest Bank of America Global Fund Manager’s survey, showing the biggest underweight for commodities since May 2020, the height of the COVID lockdown-driven commodity demand collapse.
Here’s a chart that caught my eye last week:
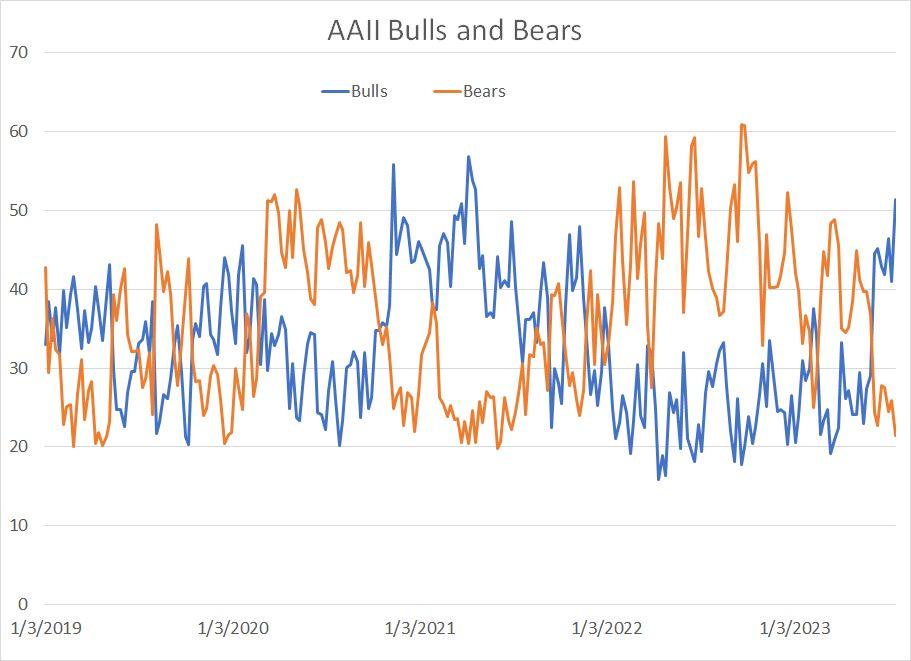
Source: Bloomberg, American Association of Individual Investors
This chart shows the results of a weekly survey conducted by the American Association of Individual Investors (AAII) asking participants whether they’re bullish or bearish on the stock market.
As you can see, the bulls in the survey recently jumped to the highest levels since April 2021 while bearish sentiment now sits at just 21.5% of those surveyed.
Yet, also last week, the Bank of America Global Fund Manager survey tells us institutional investors are still holding elevated cash positions, an underweight position in stocks and most expect either a recession or a period of weakening economic growth.
The most likely explanation for this disconnect is the bifurcated market so far in 2023 – you have some “story” and momentum stocks like Microsoft and Nvidia that have handily outperformed. These stocks tend to have a strong individual investor following, reflected in bullish sentiment in the AAII survey.
Meanwhile, more cyclical assets like bank stocks, energy stocks and commodities have lagged, reflecting persistent market concerns about a potential recession.
This is a tough set-up for the technology and growth momentum bulls heading into the peak of earnings season for the group this week and next – with sentiment already bullish and the stocks already up big, there’s risk any whiff of less-than-stellar news or guidance could prompt a round of profit taking.
The bar to impress investors this earnings season, and drive further upside in some stocks, has been set high.
Meanwhile sentiment towards the financials and energy stocks remains bearish; these stocks are already pricing in a good deal of bad news. Financials are rallying based on the view deposit flight from regional banks has stabilized.
And, as I argued in this service last month, the only way to square oil’s price weakness in the face of continued production cuts by OPEC and a seasonal surge in demand is if you expect a recession and significant demand destruction. With oil and energy stocks, already pricing in a hard landing, it doesn’t take a great deal of positive news to send the group sharply higher.
The third factor is markets appear to be beginning to fret over a second wave of global inflation later this year. This is a big topic, and one I’ll leave to a future post, however it’s notable the 10-year US breakeven inflation rate – a market derived measure of average inflation expectations over the next decade – recently jumped to almost 2.4%, the highest level since early March and up about 18 basis points in less than a week.
Of course, one of the primary beneficiaries of resurgent inflation, especially if the Fed’s enthusiasm for its 2% target wavers, is likely to be commodities.
In this week’s issue, I’m boosting recommended exposure to two positions that have been performing well of late and look posed for further gains.
Here’s a rundown of the portfolio changes I’m recommending:
Keep reading with a 7-day free trial
Subscribe to The Free Market Speculator to keep reading this post and get 7 days of free access to the full post archives.