
Energy’s Hidden Correlations
Quantifying the "Escalation Alpha" in your energy portfolio

The energy market narratives around Operation Epic Fury seem to change multiple times each trading day with perhaps a dozen reversals each weekend.
We’ve had “deescalation days” such as Friday April 17th when Iranian Foreign Minister Abbas Araghchi announced that the Strait of Hormuz was “completely open” for commercial traffic. West Texas Intermediate (WTI) Oil prices plummeted $10.84/bbl on that news, about an 11.5% decline, and stocks rallied.
And, of course, we’ve had conflict “escalation days” such as Monday April 20th (the very next trading day) when oil prices jumped almost 7% following a weekend where Iranian officials walked back the promise to keep the Strait of Hormuz open.
However, what’s most interesting isn’t the day-to-day and headline-to-headline reversals we’ve seen, or the endless debates in the mainstream media about what’s likely to happen next. Rather, for investors the crucial point to understand is how different subgroups within energy respond to escalation and deescalation headlines.
So, let’s dive into the data:
Ten Weeks Later
It’s been over 10 weeks since the start of the conflict with Iran. And since the close on Friday February 27th, essentially the final trading day before the start of Epic Fury, the S&P 500 Energy Index is up about 3.6% while the S&P 500 is up 7.9%.
(The S&P 500 Energy Index is still outperforming the broader market by a roughly 21 percentage point margin year-to-date despite some modest underperformance since the start of the conflict in Iran).
To keep it simple and objective, let’s define an escalation day as a day when oil prices rise, and a deescalation day as the opposite.
Let’s start with Diamondback Energy (NSDQ: FANG), a large US-based Exploration & Production (E&P) company with operations in the Permian Basin. Since FANG is a pure upstream play – they produce and sell crude oil – and has no operations in the Middle East conflict zone, I’d expect the stock to be a beneficiary of “escalation days.”
For those of you unfamiliar with Diamondback, I explained how higher oil prices feed through into FANG’s free cash flow and how the company is responding to the recent spike in oil in my Sunday Deep Dive over the weekend titled “The $95 Question: Why US Shale isn’t Blasting Off.”
I’d expect the stock to outperform the S&P 500 Energy Index when the Iranian conflict escalates, and oil prices rise, because FANG benefits directly from higher oil prices.
In addition to that, fewer barrels flowing out of the Persian Gulf means there’s a need for additional barrels from other suppliers; the US is an obvious winner, because it’s the world’s largest oil producer and US energy supplies are more secure than supply from almost any other country in the world.
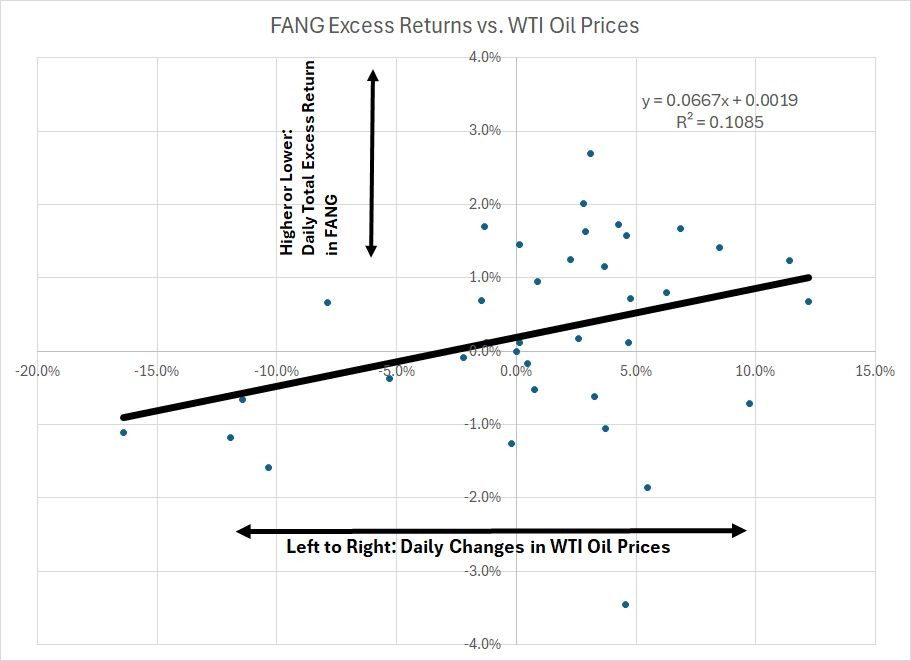
So, let’s do a simple regression of the excess daily total return in FANG -- Daily Return in FANG less the return from the S&P 500 Energy Index – and plot that against the corresponding daily change in WTI oil prices:
Source: Yahoo Finance, Retrieved Using Python Script
Each blue dot in this chart represents a single trading day. The vertical axis (up and down) represents the daily excess return in FANG (return in FANG less return in S&P 500 Energy) and the horizontal axis (left to right) represents the corresponding daily return in WTI.
To paraphrase the late, great George Peppard, I love it when a plan comes together.
This chart shows a clear positive correlation – that thick, upward-sloping black trendline – between excess returns in FANG and rising oil prices. On escalation days, FANG tends to beat the S&P 500 Energy Index as we posited earlier.
Unlock the “Energy Alpha”
Get 30 days of premium research—completely free.
The energy market narratives surrounding Operation Epic Fury are shifting by the hour. While the mainstream media debates the headlines, we are diving into the data to show you which stocks actually benefit from conflict escalation—and which ones are the big winners when the region settles down.
Don’t trade on headlines alone. Join the professionals who look through the noise to find the real market signals.
I’ve added the equation for this trendline to the chart as well as the R-Squared Value, the coefficient of determination.
The R-squared ranges from 0 to 100% and for this relationship it’s about 10.85%. That means that about 10.85% of the excess return in FANG can be explained by the daily change in WTI.
While that might seem low, R-squared values in financial markets are notoriously low, especially on daily data, which is inherently noisy. And, even more important, the relationship is statistically significant.
However, not all sub-sectors within energy have positive leverage to escalation days:
Services Granularity
Consider the oil and natural gas services business.
These companies don’t make money by producing and selling crude oil or natural gas. Instead, these companies perform key work, and supply components, to the upstream energy sector, which includes shale producers like FANG as well as the supermajors like Exxon Mobil (NYSE; XOM) and Chevron (NYSE: CVX).
In essence, capital spending (CAPEX) on the part of the global oil and gas production industry represents the revenue base of the services firms.
