

Europe's Renewable Energy Crisis
Europe's Renewable Energy Crisis
The European energy crisis isn't over

On February 19th, I published “The False Triumph of Alternative Energy,” part of an occasional series I write in The Free Market Speculator called Myths, Half-Truths and Misinformation.
In this series, my goal is to present a common, oft-repeated market or economic myth and explain, in the simplest terms possible, why it’s untrue, misleading or dangerous.
This issue is an extension of my February 19th post addressing a common myth I hear repeated in markets these days, particularly by activists on social media sites like Twitter. It’s a dangerous misconception that has vast implications for energy markets over the next few years including natural gas and nuclear power.
Simply put, some market participants appear to believe Europe has “solved” its regional energy crisis. A related point I’ll address today is the idea that Europe’s energy crisis, and the spike in global oil and gas prices, is solely due to the fallout of Russia’s invasion of Ukraine.
Let’s start with this:
Source: Bloomberg
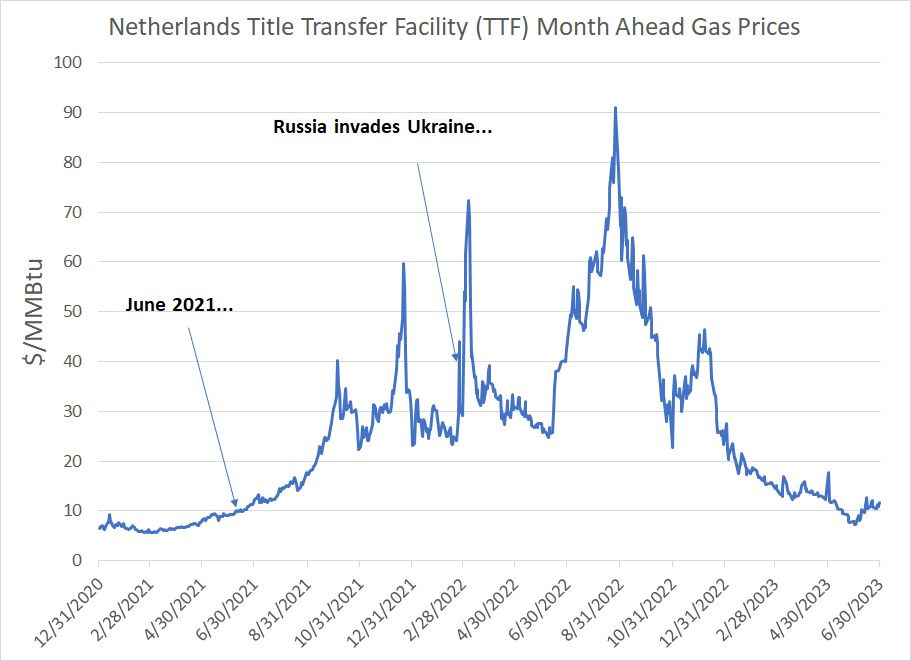
This chart shows month-ahead Netherlands TTF natural gas prices rebased in terms of $/MMBtu, the US pricing standard. EU gas prices on this basis tumbled more than 90% from their August 2022 peak to spring lows.
However, as I said, there’s a serious misconception the EU gas price spike is solely due to Russia’s invasion of Ukraine and the subsequent halt in EU gas imports from Russia. As you can see in this chart, the big break higher in natural gas came as far back as the middle of 2021; by the autumn of that year, prices were already testing the $40/MMBtu range on this basis.
This is months before Russia invaded Ukraine at the end of February 2022.
Rather, the problem Europe faces is more of a long-term structural and seasonal issue:
Source: Bloomberg
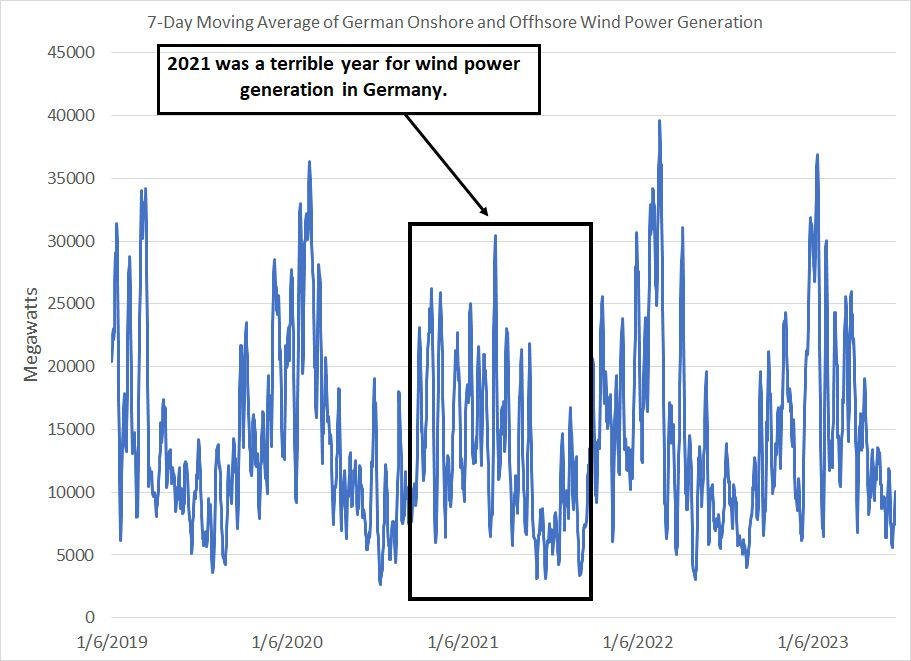
In recent years, many EU countries, in particular Germany, have become increasingly reliant on wind and other renewable energy sources to generate electricity. Wind is inherently intermittent, and in most of the EU, average wind velocities are higher in the winter than in the summer months.
Thus, you can see the pattern here – German power generation from onshore and offshore wind turbines is solid in winter and weak in summer.
And, while Germany continues to build out wind power capacity, rated capacity is meaningless when wind velocities are too low – more turbines doesn’t equate to more power if those turbines aren’t spinning at an efficient rate:

Source: Bloomberg
This chart shows total German installed wind capacity and average generation in the months of January-March and June-August since 2015.
German wind power capacity jumped 48.8% between 2015 and 2022 to a whopping 66,315 megawatts. And there has been a commensurate jump in wind power generation in the windier months of the year (January – March); indeed, average daily wind generation in the first three months of last year was 103.2% higher than in the same three months of 2015.
However, look at average generation in the summer months when wind velocities are lower – in 2022 average summer power output from Germany’s wind turbines was up less than 25% from the summer of 2015. And, in the summer of 2022, wind power generation was LESS than in the summer of 2017 despite 19.3% growth in total German onshore and offshore wind turbine capacity in the intervening years.
So, look at these two charts above and you’ll see that 2021 was a terrible year for German electricity generation from wind, particularly in the first few months of the year.
Fossil fuels — gas and coal — filled that gap, leaving Germany and the rest of the EU in a weak position from a gas storage standpoint to provide heating in the winter of 2021/22:
Source: Bloomberg
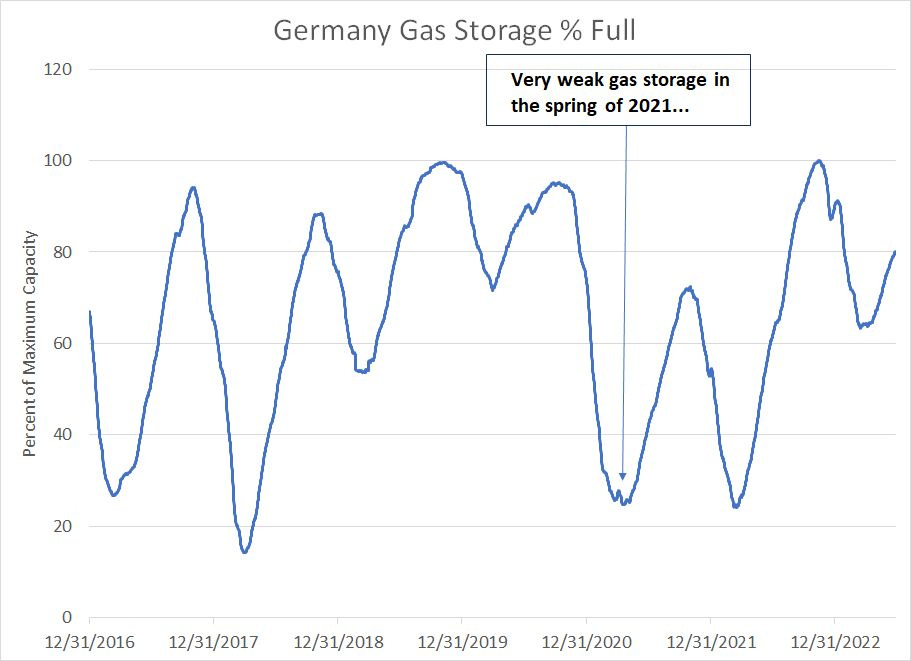
As you can see here, weak renewables generation in 2021 contributed to the collapse in gas storage in the spring of that year, which was the proximate catalyst for the surge in EU gas prices in the spring and summer of 2021.
In 2022 and 2023, Europe benefited from better conditions for renewables generation than in the prior year as well as an unusually warm winter in 2022/23, which allowed storage to build back toward 100% of capacity.
And the low for storage this past spring in Germany was about 65% of capacity, which is well above what we’ve seen in most recent years. So, Germany is well supplied with gas right now.
This trend also aided Germany last winter:
Source: Bloomberg
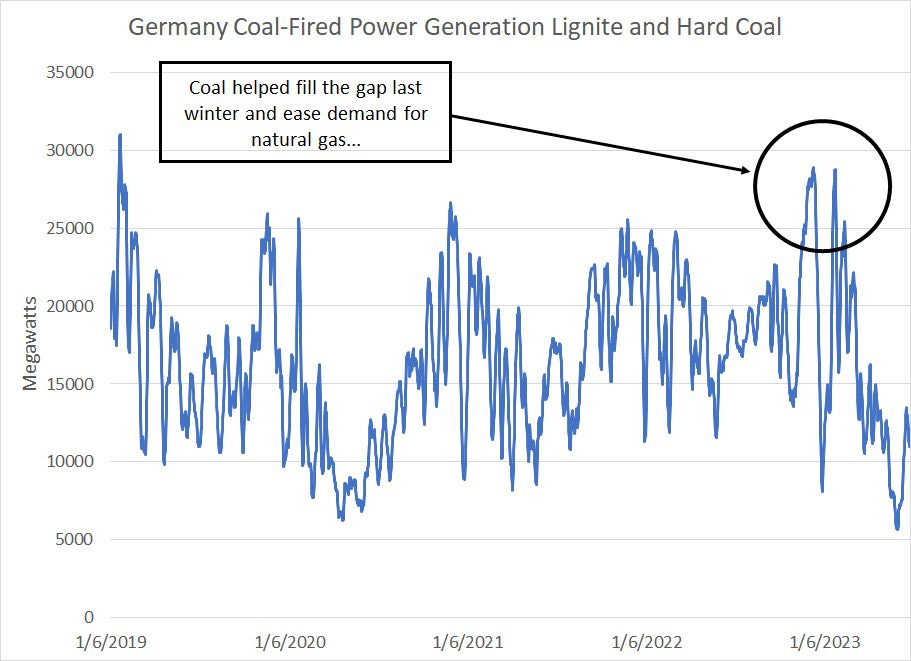
This chart shows the 7-day moving average of German electricity generation from hard coal and lignite (brown) coal.
As you can see, last year Germany relied heavily on coal-fired power facilities to fill the gap caused by the need to reduce consumption of high-cost natural gas, particularly in the winter months (circled). In 2022 a whole, electricity generation from coal jumped 9.7% year-over-year to over 180 terrawatt-hours.
However, it’s not hard to see how this could all go wrong once again in coming years. Should Germany and the rest of Europe experience a hot summer or a cold winter that results in a jump in demand, it’s tough to see how the region could avoid a large drawdown in gas storage that sends prices sharply higher.
Atmospheric conditions could exacerbate the trend. For example, right now, north-west Europe is experiencing a one-two punch of higher-than-normal temperatures that increase energy demand and lower-than-average wind velocities, which cuts power output from wind turbines.
Further, a few recent trends in Germany serve to increase its vulnerability to future weather-related shocks:
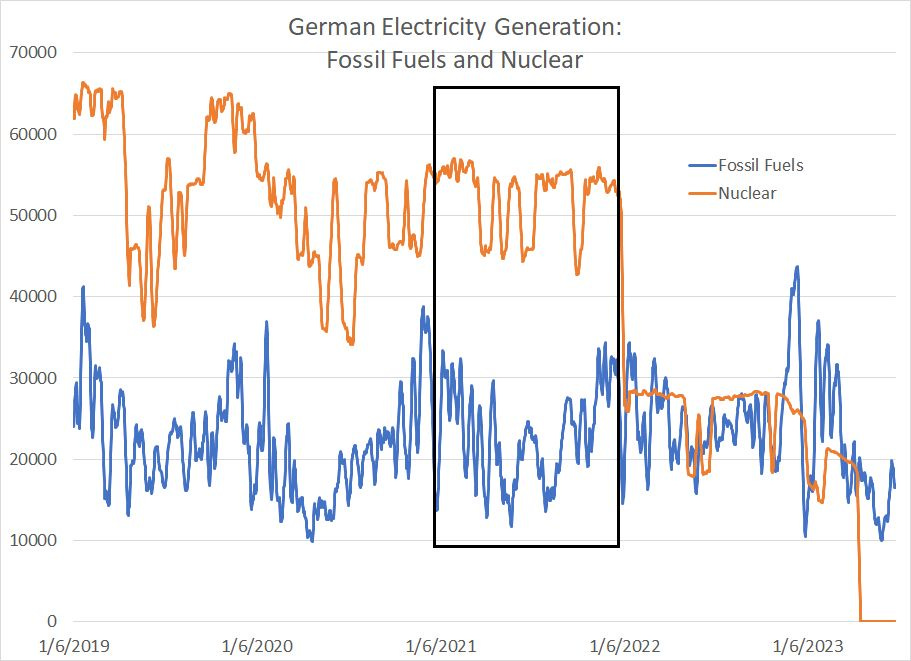
Source: Bloomberg
This chart shows the 7-day moving average of Germany electricity generation from three fossil fuels – natural gas, hard coal and lignite coal – as well as from nuclear facilities.
As you can see, one bright spot back in 2021 was Germany’s remaining nuclear reactors, which fed in a high and stable amount of power, offsetting weak renewables generation. However, since that time Germany has shuttered its last remaining nuclear facilities and generation has dropped to zero.
Let’s put this into perspective.
In 2021, nuclear comprised 11.7% of the country’s total power generation, falling to about 6% in 2022 and nothing going forward as the nation is irrevocably decommissioning its last reactors. Should Germany experience elevated power demand or weak renewables output, nuclear will not be there to soften the blow.
It’s also worth noting that while coal saved the European electric grid last year, burning more coal, particularly the dirtiest lignite coal, is inconsistent with the region’s environmental goals and plans to dramatically reduce carbon dioxide emissions in coming years. Should European countries go ahead with plans to phase out coal-fired power facilities that further hampers their capacity to react to future spikes in natural gas prices or offset poor renewable generation conditions.
Finally, in Germany most households do not use electricity for heating. It’s estimated that roughly half have natural gas heating systems while a quarter rely on crude oil derivatives.
Some longer-term plans to phase out gas and oil-fired heating systems or encourage the use of electric heat pumps could be expected to further increase demand for electricity in the winter months straining the nation’s intermittent generation mix.
And that brings us to this:
Growth in LNG and Competition for Cargoes
Last year, Europe turned to liquefied natural gas (LNG) cargoes to offset the drop in Russian gas imports:
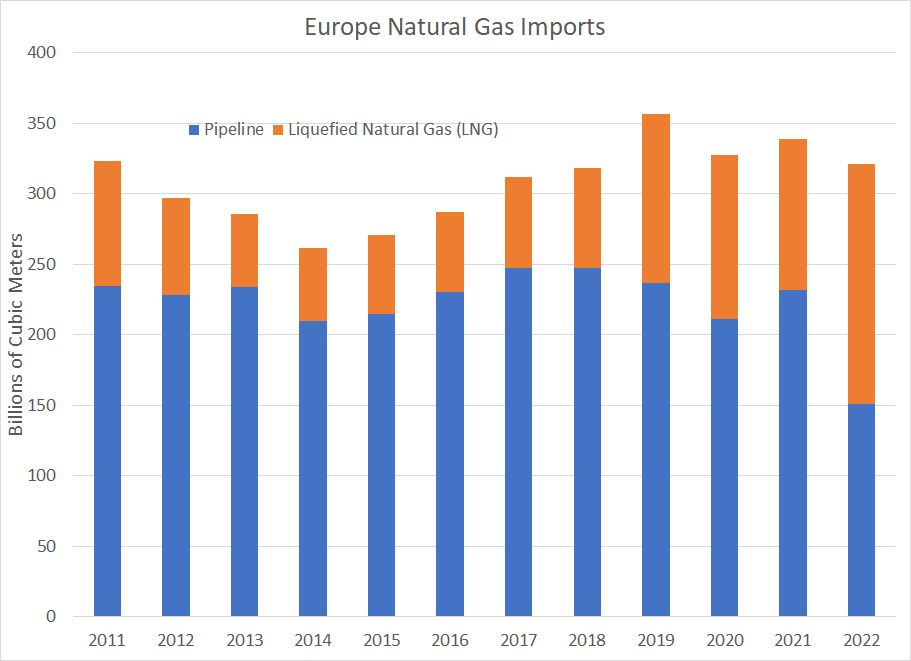
Source: Bloomberg
As you can see, Europe’s natural gas imports via pipeline dropped from around two-thirds of total gas imports in 2020 to less than half in 2022 (47%) and further declines are likely this year. After all, the Nord Stream natural gas pipelines from Russia to the EU were sabotaged in September 2022, so for much of last year Europe was still receiving some gas via pipelines from Russia.
This puts Europe increasingly in competition with other major importers of LNG around the world including Japan, China and South Korea for available supply.
This also puts a floor under European gas prices:
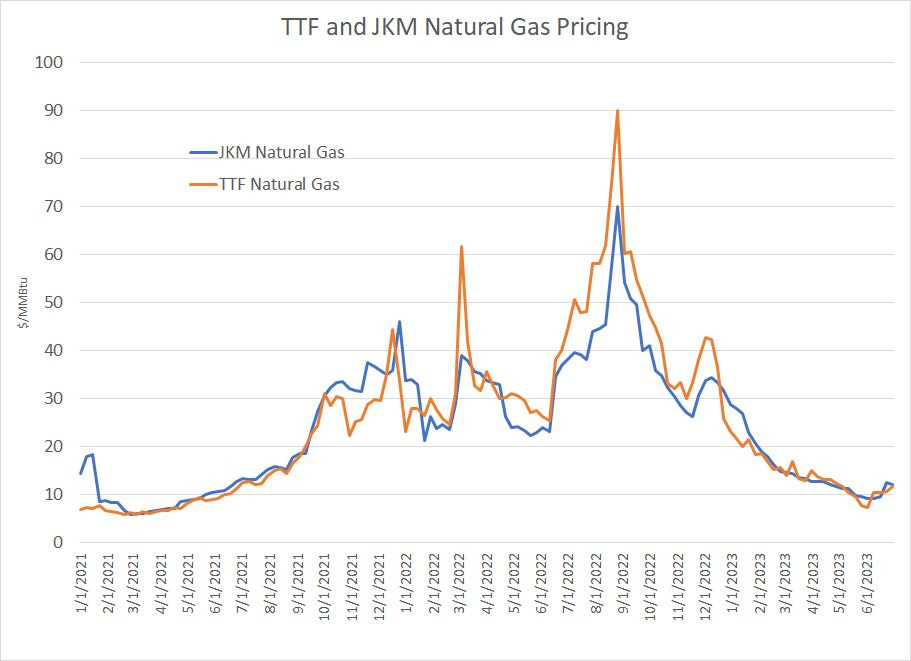
Source: Bloomberg
This chart shows European and Asian natural gas prices both in US $/MMBtu. The European benchmark is the Netherlands Title Transfer Facility (TTF), while the Asian benchmark is the Japan-Korea Marker (JKM) price.
When TTF is higher than JKM, Europe is going to tend to attract spot cargoes of LNG supplies; the opposite is true when JKM is higher than TTF. As you can see, Europe’s desire to replenish gas storage last year meant the TTF benchmark typically traded above JKM.
In the last few months, however, JKM has rallied to a level above TTF on a few occasions, which will tend to make it more attractive to export to Asian markets rather than Europe.
Longer term, given the need for Europe to attract LNG cargoes and meet demand for gas, Asian gas demand and pricing represents a floor for EU gas prices.
This is bad news for European energy costs, but it’s great news for LNG exporters including the US, where several new LNG export terminals are due for start-up over the next few years:

Source: Bloomberg
Elevated TTF and JKM prices will also increasingly put a floor under US natural gas pricing.
As this chart shows, US LNG exports were negligible prior to 2016 and insignificant to the massive US gas market prior to 2019; however, since the beginning of 2019, US LNG exports have more than tripled to around 12.5 bcf/day.
The Energy Information Administration projects a jump to more than 14 bcf/day by the end of 2014 (next year) due to the start-up of the Golden Pass LNG export facility in Texas by the second half of 2024. By January 2026, a series of expansions should boost export capacity to near 20 bcf/day, a level that represents more than 21% of current US gas production.
In the short-run, increased LNG demand is irrelevant to the US gas market, which is why I was bearish US gas prices for muck of last year following the spring spike.
Prices north of $5/MMBtu provide a strong economic incentive for US producers to increase production and, while US LNG export capacity will grow longer term, in the short run it’s fixed. With US LNG exports already near capacity in the first half of 2022, there was little scope for US producers to directly benefit from sky-high EU energy prices.
However, the collapse in natgas prices below $2/MMBtu this spring is unsustainable longer term and we’re not returning to the 2009-2020 era of structurally low US gas prices due to chronic oversupply. Summer heat is already boosting US demand, while US producers have responded to low gas prices in the first half of this year by slashing CAPEX and rig counts, resulting in falling production from key US plays.
Meanwhile, the US gas price curve has a distinct upward slope into late 2024 and early 2025; this reflects the reality US LNG export capacity is set to rise sharply, and Europe and Asia will need to import more LNG in coming years. This provides a structural price floor for US gas prices.
In the short to intermediate-term, I believe a hot summer and/or cold winter this year could expose the supply vulnerabilities in Europe (and the US) turbocharging the recovery in gas prices back above $4/MMBtu.
Further, I believe there’s value in US gas producers right now mainly because the extreme sell-off in US gas prices starting in Q4 2022 raised concerns of a return to the 2009-2020 depressed gas price environment. As gas prices recover and evidence grows the long-term outlook is far more constructive, I see gas producers closing the gap with fair value estimates.
Given the June surge in the group, it’s unclear how much longer these values will persist.
DISCLAIMER: This article is not investment advice and represents the opinions of its author, Elliott Gue. The Free Market Speculator is NOT a securities broker/dealer or an investment advisor. You are responsible for your own investment decisions. All information contained in our newsletters and posts should be independently verified with the companies mentioned, and readers should always conduct their own research and due diligence and consider obtaining professional advice before making any investment decision.
i have no interest in playing "gotcha".
my reading of the summer vs. winter graph is : more energy generated in the summer months.
are the summer months switched with the winter months ?