

Follow the Money
Follow the Money
Something odd happened Thursday

Back in the May 30th issue of FMS, “Crowding Out,” I wrote about how a deal to raise the US debt ceiling could have unfortunate side effects for market liquidity and, by extension, equities.
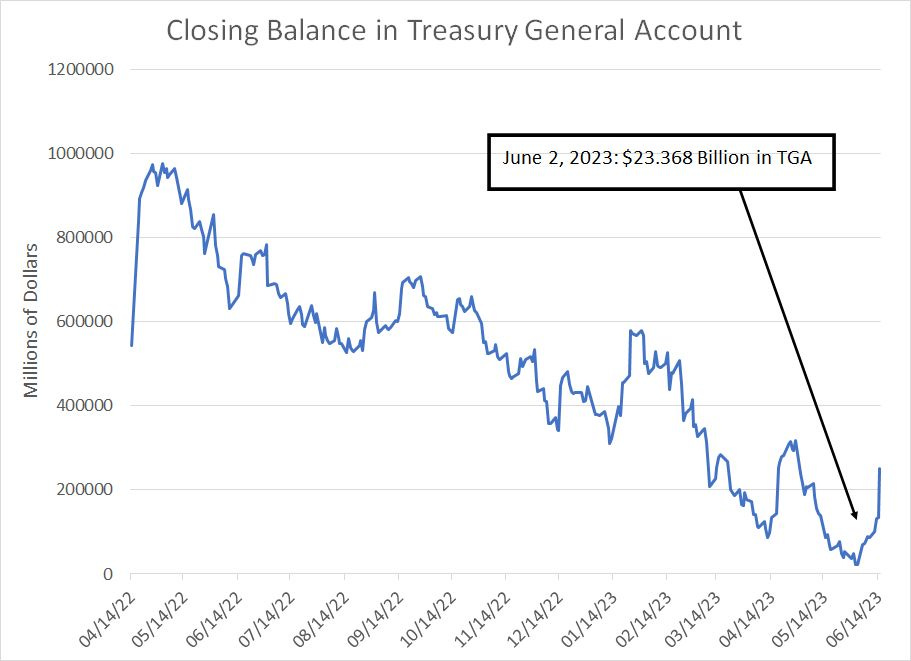
Specifically, as of the close on Friday June 2nd, the US Treasury General Account – the government’s “checking” account at the Fed – held only $23.368 billion. While that might seem like a lot of money, the government had over $265 billion in the TGA as of April 19th, as US individual income tax receipts began to pour in, so a balance under $25 billion is far from comfortable.
Following a debt deal, however, I posited the Treasury was likely to kick off a flurry of Treasury Bond and Treasury Bill auctions to replenish their depleted coffers.
Well, Treasury is starting to do just that:
Source: US Treasury Daily Treasury Statement (DTS)
As of Wednesday June 14th (last Wednesday), the Treasury General Account (TGA) stood at $134.857 billion, which is the number the Fed reported in its weekly H.4 report, released on Thursday after the market close.
Recall the H.4 report is essentially a weekly account of the Fed’s balance sheet, where the TGA shows up as a liability for the same reason that deposits you hold with your bank show up as a liability on that’ bank’s balance sheet. Simply put, this represents money the bank (or the Fed in Treasury’s case) must make available on demand.
And, by looking at the Daily Treasury Statement (DTS) we also know that on Thursday the 15th, the last day for which we have data, the TGA swelled even further, reaching $250.417 billion.
That’s a one-day gain of $115.56 billion and the TGA has banked over $227 billion since the nadir on June 2nd.
So, where is this cash coming from?
Debt and Taxes
Fortunately, the same Daily Treasury Statement allows us to answer that question.
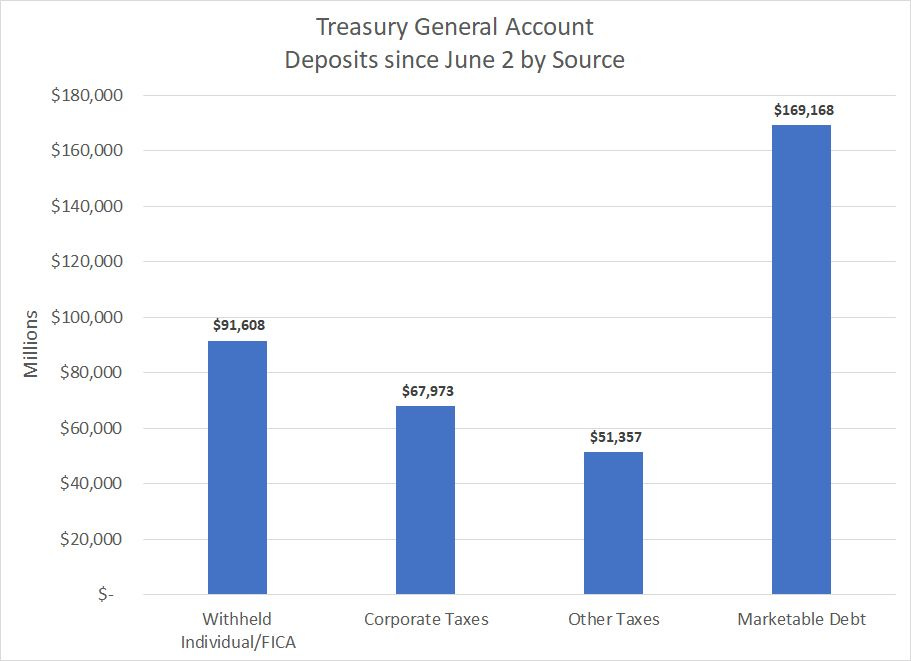
I won’t go through every line item on the statement, but since June 2nd, here are the largest deposits into TGA:
Source: US Treasury
As you can see, individual taxes and FICA (Social Security and Medicare), corporate tax receipts and various other taxes were all significant contributors to the federal coffers this month. Indeed, all tax receipts since June 2nd add up to nearly $211 billion.
However, the biggest single source of new funds is proceeds from the sale of public debt net of redemptions — new Treasury Bills and Notes less the amounts paid out to redeem maturing debt. That shouldn’t come as a huge surprise since the Treasury has been using so-called extraordinary measures since January to circumvent a breach of the debt ceiling and needs to reverse those extraordinary accounting gimmicks once the debt ceiling is raised. And that’s in addition to normal monthly spending and, of course, a desire to replenish the TGA.
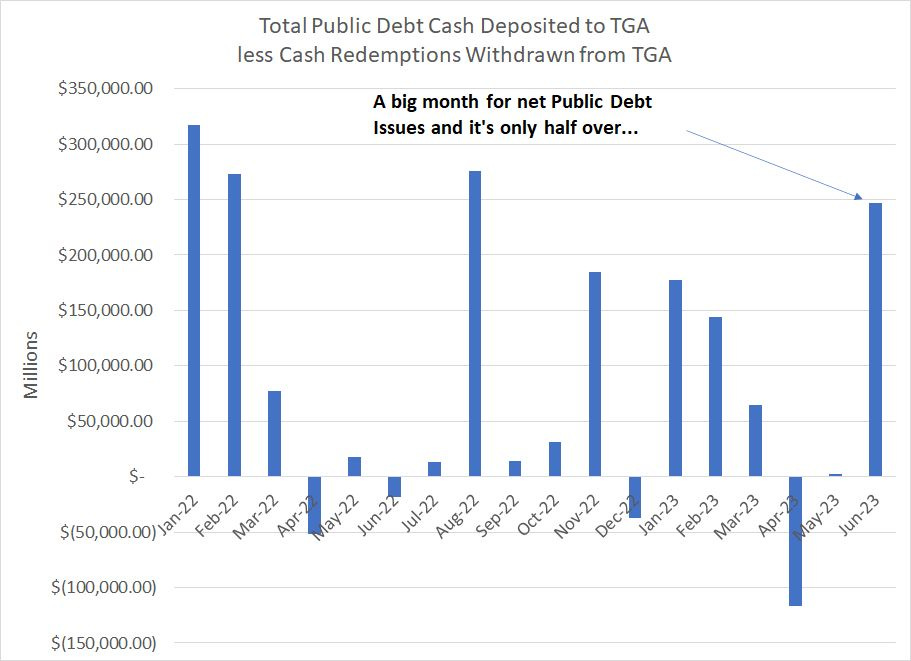
Here’s a look at net Treasury public debt issues on a cash basis since January 2022:
Source: Bloomberg
To calculate this I examined “Table IIIB” in the Daily Treasury Statement. For each month, this represents all cash deposited to TGA from new public debt issues less all cash withdrawn from TGA due to debt redemptions. In other words, it’s the change in TGA that can be attributed to net cash received from debt marketed to the public.
As you can see, June is already looking like a strong month for debt sales and the month is only half over.
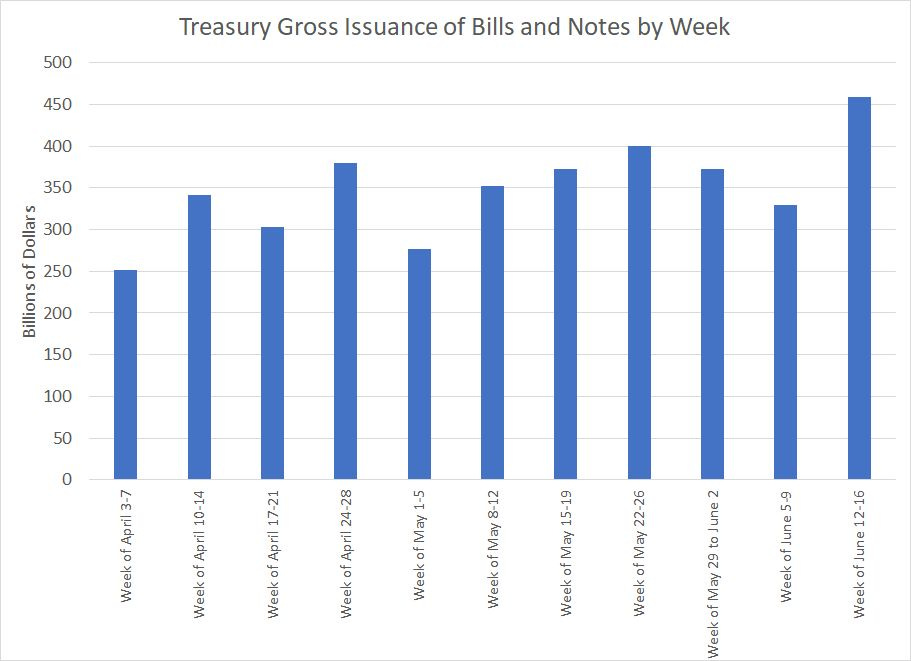
And here’s a look at scheduled Treasury auctions in recent weeks:
Source: Bloomberg
As you can see, Treasury did step up its auctions of new bills and notes in the week just ended and has plans to sell additional debt of $173 billion today (Tuesday June 20th), consisting of $65 billion in 13-week (3-Month) T-Bills, $58 billion in 26-week (6 -Month) bills and $50 billion in 42-day so-called “Cash Management Bills.”
As I explained in “Crowding Out,” the reason the Treasury’s stepped-up borrowing is important has to do with where this money comes from — “who” is lending money to the US government.
And to follow the money, we need to understand the interplay between the Treasury’s Daily Statement and the Fed’s Balance sheet.
The Fed’s H.4 Balance Sheet
The Federal Reserve’s H.4 statement is released weekly on Thursdays around 4:30 PM Eastern Time, just after the close of equity markets.
The H.4 shows both the assets and liabilities of the central bank both as of the close of business on Wednesday and on an average basis over the prior week.
So, let’s start with the liabilities side as of the close of business on Wednesday June 14th:
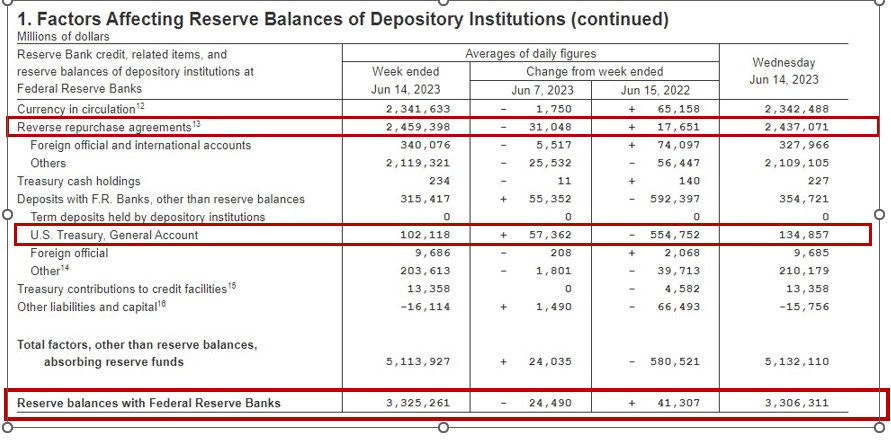
Source: Federal Reserve
I’ve highlighted three line items in red boxes: Treasury General Account, Reverse repurchase agreements (often abbreviated as RRP) and Reserve balances with Federal Reserve Banks.
Let’s start with the TGA, looking at the column on the far right side of this table that corresponds to the June 14, 2023 close. You’ll note the Fed reported the TGA balance at $134.857 billion, which corresponds to the data on the Treasury Daily Statement for June 14th as I highlighted earlier.
We do know that on Thursday the TGA nearly doubled in size in a single day, reaching a balance of over $250 billion. This will not be reported on the Fed’s balance sheet until this Thursday June 22 when the central bank releases its weekly H.4 report.
For now, however, let’s just deal with the data we have as of June 14th.
So, as I noted at the beginning of today’s issue, the TGA is a liability for the Fed and the total liabilities on the Fed’s balance sheet sum to about $8.438 trillion. As with all balance sheets, total assets must equal total liabilities so when the TGA increases in size, that must balanced by one of two things:
A commensurate increase in the Fed’s total assets.
A decline in other liabilities.
A good rule of thumb to remember in coming weeks is that if you’re trying to discern the potential short-term market impact of monetary and fiscal policy, it’s most important to pay attention to the liabilities side of the balance sheet.
In this case, as the TGA rises, the most likely balancing factors are a commensurate decline in the other two line items I’ve boxed in red: Reverse Repurchase Agreements (RRP) and Bank Reserves.
So, let’s break it down by looking at the change in the Fed’s balance sheet between the end of May and the June 14th close:
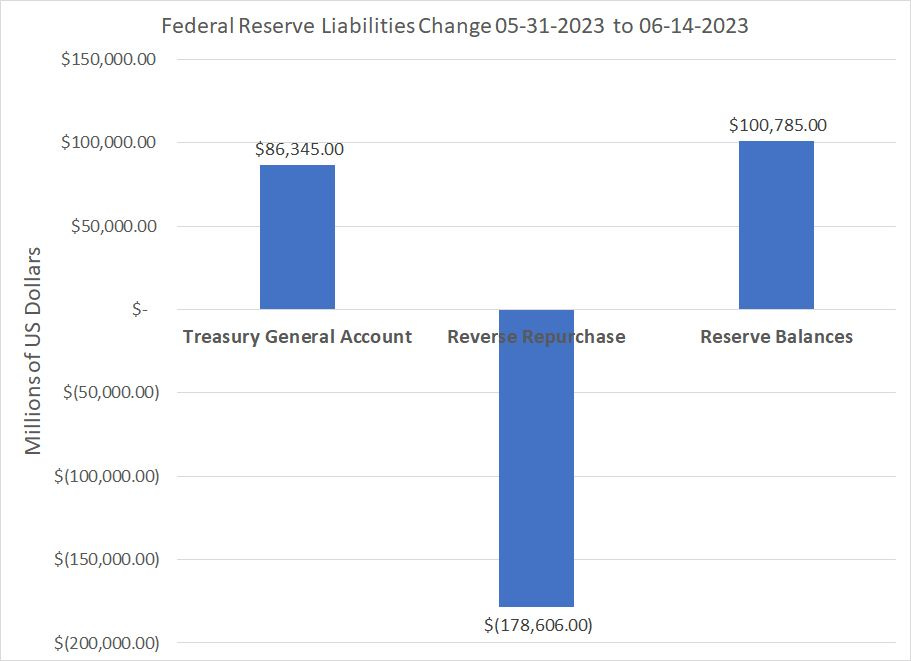
Source: Federal Reserve
As you can see, the Treasury General Account has increased to the tune of over $86 billion over this period, but bank reserves have increased even more than that by over $100 billion.
Since both the TGA and reserves are liabilities for the Fed, that $185+ billion increase must be offset by a decline in liabilities elsewhere across the system. In this case, the Reverse Repo facility has done the heavy lifting, declining by close to $180 billion in just the two-week period ended June 14th.
From an economic standpoint, an increase in the TGA, offset by a decline in the RRP is the most benign outcome possible.
That’s because the RRP allows institutional investors to “park” money at the Fed and earn a yield close to the Fed Funds Rate. Most of the money there represents assets held in money market funds – if you own a money market fund, it’s likely at least some of the assets held in that fund are held in RRP.
Money market funds are designed to hold short term, high quality fixed income investments, primarily short-term bonds issued by the US government or agencies of the government. So, the RRP is fair game for these funds and they can also buy and hold short-term Treasury bills such as the 13 and 26-week T-Bills and 42-day Cash Management Bills the Treasury plans to auction today.
However, money market funds can’t buy longer-term Treasury bonds.
So, what’s happened is that Treasury has been very careful over the past two weeks about how, and how quickly, it tries to replenish the TGA.
The vast majority of the debt Treasury has issued so far this month consists of short-term bills and, recently, yields on bills have been more favorable than yields in the reverse repo facility. So, money market funds are pulling money out of RRP and plowing that money into newly issued short-term Treasury debt.
From a Fed balance sheet perspective, that shows up as an increase in the TGA (liability) offset by a decline in reverse repos (another liability):
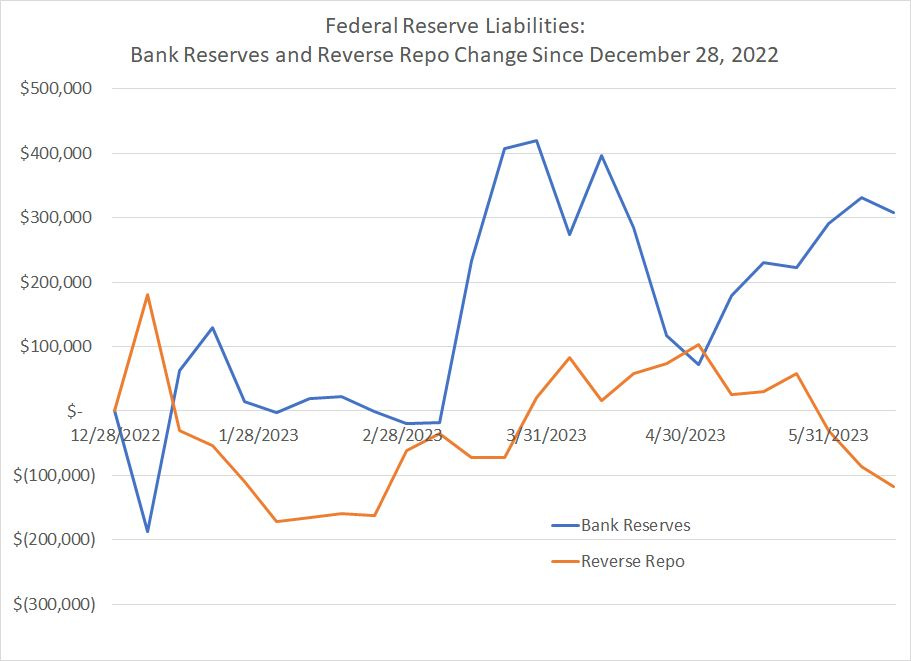
Source: Bloomberg, Federal Reserve
This chart shows the cumulative change in these two crucial Fed liabilities since December 28, 2022 (the last H.4 Report of 2022). As you can see, bank reserves have actually risen generally this year while the RRP has declined.
To date, there has been no discernible impact on bank reserves from the Treasury’s stepped-up borrowing needs. That’s crucial as these reserves represent money banks hold on deposit at the Fed and it’s these reserves that underpin all the lending and credit extended through the US banking system.
However, keep in mind this data is all from the Fed’s H.4 statement through June 14th and we know that the TGA increased at additional $115+ billion on Thursday June 15th, the day after the Fed’s weekly H.4 report.
And the Treasury Daily Statement reveals that for the first time this month, the US Treasury issued significant quantities of longer-term Treasury Notes (debt with a term of 2-10 years) and Treasury Bonds (20 and 30-year debt).
Indeed, on Thursday, the Treasury indicated it deposited a net $68.88 billion into the TGA from public debt issuance net of redemptions. This included net issuance of Treasury Notes totaling $27.37 billion and $18 billion in Treasury Bonds; longer-term bonds that money market funds are not eligible to purchase accounted for nearly two-thirds of the $68.88 billion deposited to TGA on Thursday from debt issuance net of redemptions.
And, Treasury actually redeemed $12.4 billion more in Treasury Bills than it issued and only reported net issuance of $374 million (that’s with an “m,” not a “b”) in short-term cash management bonds.
So, let’s look at thee same data in a slightly different way:
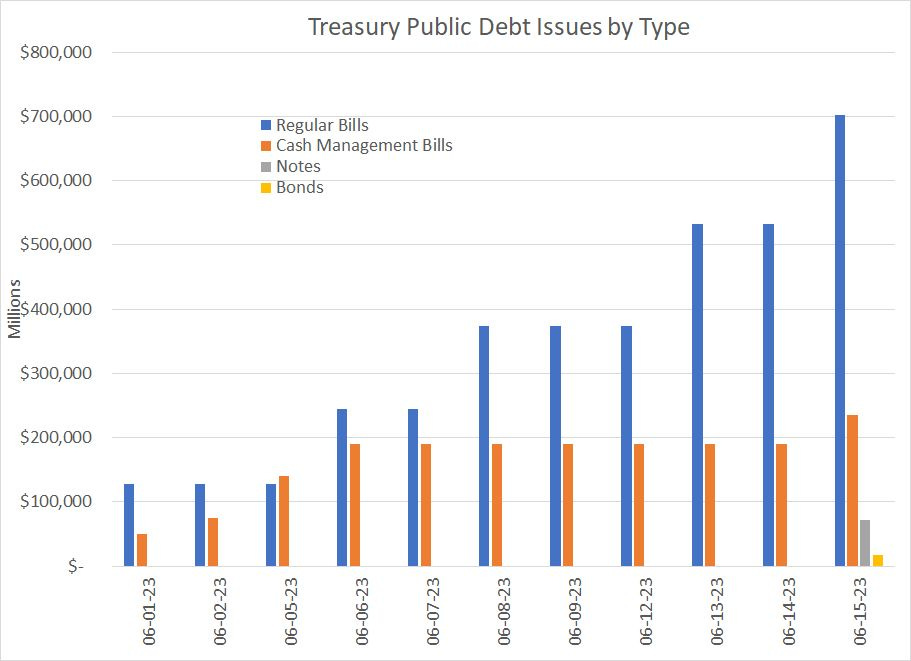
Source: US Treasury
This chart shows the cumulative monthly issuance of public debt securities broken down into four main types. Note that this is NOT net of redemptions, it’s a gross issues number.
As you can see, the Treasury has relied heavily on short-term debt issues — T-Bills and short-term Cash Management Bills — so far this month. These are issues that would be eligible for purchase by money market funds , so there’s a good chance some of the money loaned to the government is coming from RRP.
However, starting on Thursday the 15th, the day AFTER the Fed’s H.4. release, you can see that surge in note and bond issuance. These are securities that money market funds can’t buy because this debt has a maturity 2+ years into the future.
So, who bought the longer term issues the Treasury reported last Thursday?
Well, the truth is that we have no way to know for sure. However, it’s likely to have been individuals (directly or indirectly), corporates or banks that bought these securities. And it’s also likely a significant portion of these purchases were paid for by drawing down bank deposits at commercial banks.
Of course, it’s possible individuals redeemed money held in money market funds to purchase this Treasury debt, but that looks unlikely. After all, the Investment Company Institute (ICI) reported that on the 14th US money market funds held over $5.452 trillion in assets, up from $5.420 at the end of last month.
Watch Those Reserves
The bigger issue is that these trends have further, a LOT further, to run.
While the government has started issuing debt to replenish the TGA, there’s likely a long way to go before the TGA returns to a more comfortable level. This process is only just starting, and there’s weeks of heighted Treasury issuance ahead.
To date, the Treasury has minimized the impact of debt issuance by selling mainly bills that can be purchased by money market funds. However, eventually, the government is likely to issue more longer-term bonds that can’t be purchased by these funds and, therefore, can’t be offset by a drop in reverse repos.
I suspect increased Treasury issuance will have at least some impact on reserves this summer.
And this isn’t just an exercise in theory:

Source: Bloomberg, Federal Reserve
This chart shows the total level of reserves (blue line) since early 2022 and the closing price of the S&P 500 (orange) since early 2022.
There’s a pretty clear correlation between the overall level of bank reserves and the stock market where rising reserves are bullish for the S&P 500.
Since early March of this year, bank reserves have recovered notably though we remain far below the 2021-22 peak levels. Some of this is due to the Fed’s efforts to stabilize the banking system back in March by lending money to regional banks against their portfolios of Treasury bond and mortgage-backed securities assets.
Also helping was, ironically, the debt ceiling fight in Washington. With Treasury unable to borrow freely, issuance fell as did the balance in the TGA. Of course, just as a rise in the TGA must be offset by a fall in other Fed liabilities, a fall in the TGA earlier this year was (partly) offset by a rise in liabilities including bank reserves.
More specifically, when an individual buys a Treasury Bond, they usually pay for that debt by drawing down money held on deposit at a commercial bank; ultimately when the Treasury borrows money that tends to show up in the form of falling bank reserves. So, less government borrowing tends to support reserves and, by extension, credit through the banking system.
Also note that while bank reserves are still growing, the pace of growth has begun to tail off, suggesting that we may already be seeing some impact from the rise in TGA though that’s (so far) been swamped by the drop in reverse repos.
It’s All by Design
The tight correlation between bank reserves and the S&P 500 isn’t a huge surprise because reserves represent the conduct of monetary policy.
When bank reserves are rising, that’s a sign there’s excess liquidity in the banking systems and, likely, a rise in deposits. This is why quantitative easing (QE) works — when the Fed buys Treasuries, the size of total assets on its balance sheet rises, and that’s offset by a rise in liabilities (reserves, TGA and RRP mainly.)
And it’s also why quantitative tightening (QT) works — when the value of Treasuries on the asset side of the Fed’s balance sheet falls that must be counterbalanced by a fall in Fed liabilities including reserves.
Reserves are also, as I’ve just outlined, one way in which monetary and fiscal policy interact — stepped up Treasury borrowing will, eventually, result in a decline in commercial bank deposits and “crowd out” private investment.
Put bluntly, if bank reserves don’t fall enough, inflation is likely to continue running well above the Fed’s target, forcing the central bank to either accept high inflation or continue tightening.
And if bank reserves fall meaningfully…I’ll let you look at the chart above to ascertain what that means for the S&P 500.
As the Fed made clear last week, inflation is still too high and growth too strong, so this process of monetary tightening likely has further to run. When it does start to “bite,” we’ll likely see that in the form of further decline in reserves reported in the weekly H.4 release from the Fed.
For now, equity markets continue to ignore any storm clouds on the horizon – the Nasdaq 100 rallied 3.8% last week and the S&P 500 was up 2.2%. Even the Equal-Weight versions of these two indices rallied by 3% and 2.5% respectively, so you could say that breadth improved, albeit slightly.
And that’s not entirely unusual for the stock market. After all, the S&P 500 and Nasdaq 100 were up 20.6% and 23.2% respectively from June 2006 through June 2007, rallying right into the teeth of the worst recession and credit crunch since the Great Depression.
None of this means the stock market is about to peak or can’t run further this summer. However, the combination of slowing economic growth, tightening monetary policy, a Treasury desperate to replenish the TGA and frothy valuations in certain market segments isn’t a favorable backdrop for the stock market over the intermediate term.
Rising rates and falling bank reserves are particularly bad news for growth stocks and the Nasdaq; indeed, last year’s big drop in growth can be attributed mainly to tighter monetary policy.
In the model portfolio that’s part of the paid tier of The Free Market Speculator, I continue to add recommendations selectively. In general, I am looking for stocks that fit in one of two main categories:
More cyclical names that are already pricing in a likely US recession. These stocks are already cheap, pricing in a ton of bad news about the economy, and trading at or near trough-like valuations in a downcycle.
Stocks with significant growth potential trading at reasonable valuations. Generally, I also look for names with some sort of definable “catalyst” to drive upside in the near term.
I’ve had some e-mail requests from readers who missed out on my 30-day free trial offer for the paid tier of FMS last month which I closed on June 2nd. So, I’ve decided to open up that offer once again through the Fourth of July (exactly two weeks from today). It’s available via this link:
DISCLAIMER: This article is not investment advice and represents the opinions of its author, Elliott Gue. The Free Market Speculator is NOT a securities broker/dealer or an investment advisor. You are responsible for your own investment decisions. All information contained in our newsletters and posts should be independently verified with the companies mentioned, and readers should always conduct their own research and due diligence and consider obtaining professional advice before making any investment decision.