

Further Downside Ahead for Stocks
Further Downside Ahead for Stocks
Why the 25% decline so far this year is just an appetizer for what's to come.

We can break down the price of any stock or equity index into two fundamentals: Expected earnings and the earnings multiple (price-to-earnings ratio).
For example, on the last trading day of 2021, the S&P 500 closed at 4,766.18 and we can deconstruct that into expected 12-month forward earnings of $215.25 per index unit at the time and a multiple of 22.143 (22.143 multiplied by 215.25 equals roughly 4,766).
On Friday September 30, the S&P 500 closed at 3,585.62, which we can disaggregate into Wall Street earnings estimates for the index over the next 12 months at $229.81 per index unit and a multiple of 15.60 times.
As you can see, the decline in the S&P 500 so far this year is entirely due to a decline in the price-to-earnings multiple investors are willing to pay for stocks, not a decline in the outlook for corporate earnings.
So, that brings me to this important question:
What Drives Earnings Multiples?
There are several factors that drive P/E multiples for the S&P 500; however, one of the most important is short-term interest rates and the near-term outlook for Fed policy.
Take a look:

Source: Bloomberg
This chart attempts to answer one, simple question:
What’s the expected peak for the Fed Funds rate in the current cycle?
To create this chart, I examined the next nine Eurodollar futures contracts. Currently, the front month Eurodollar futures is the “EDZ2” contract, which expires in December of this year and the ninth Eurodollar futures contract is the “EDZ4” contract, which expires in December 2024.
Eurodollars represent a short-term (3-month) interest rate on US dollar deposits held outside the US; the Eurodollar rate tracks short-term US interest rates and the Fed Funds rate closely and it’s an extremely liquid market.
Eurodollar futures allow us to evaluate market expectations for prevailing short-term rates well into the future.
My chart above represents the maximum yield implied by Eurodollar futures contracts over the next 2 years. This chart represents a good proxy for expected peak US interest rates.
This chart begins at the end of June 2021, and you can clearly see expectations for Fed rate hikes were quite subdued at that time – for most of the summer 2021, the peak expected Fed funds rate was around 1%.
Starting in the autumn of 2021 and accelerating into early 2022, the market ratcheted higher expectations for the peak Fed Funds rate and, after last month’s much hotter-than-expected inflation numbers, that’s surged as high as 4.95%, retreating slightly by the end of last week.
What’s shocking is how closely this series correlates to the earnings multiple for the S&P 500:
Source: Bloomberg
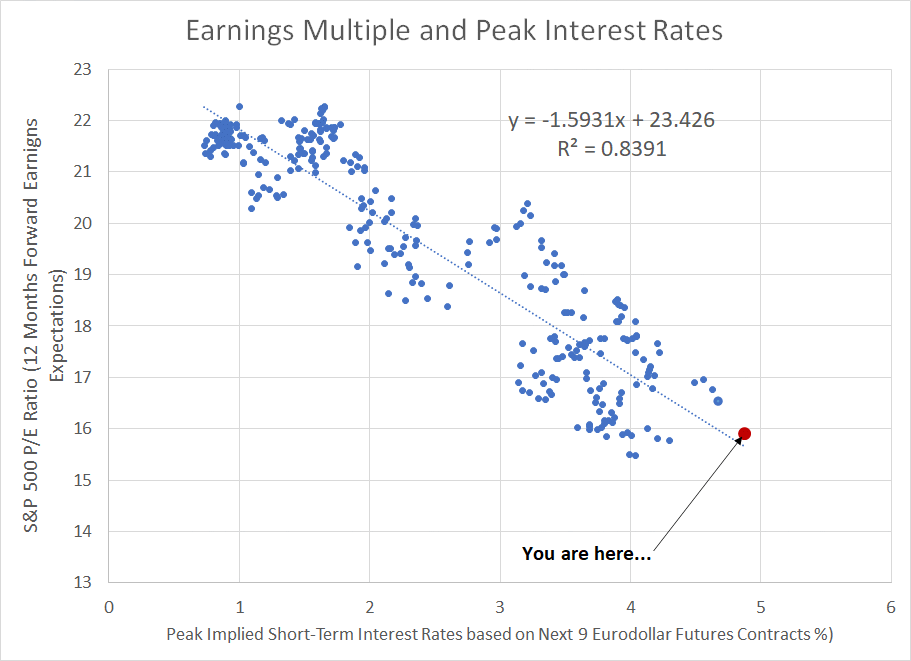
To create this chart, I’ve plotted the peak rates data based on the Eurodollar futures I just showed you on the x-axis (horizontal axis) against the contemporaneous earnings multiple for the S&P 500 on the y-axis (vertical axis).
As you can see, there’s a clear negative correlation here based on daily data since the end of June 2021 – as expected peak US rates rise (move to the right on the chart), the earnings multiple for the S&P 500 declines (lower on the chart).
The dotted trendline here was plotted using a technique called ordinary least squares and you can see the R-squared value for the trendline is a whopping 83.91%.
Simply put, that means market expectations for the maximum Fed Funds rate over the next two years explain almost 84% of the forward price-to-earnings multiple for the S&P 500 since the end of June 2021 (more than a year ago).
I’ve labeled the current datapoint as a red dot, which lies only slightly above the plotted trendline. What that means is the current forward price-to-earnings multiple for the S&P 500 is higher than this simple model would predict, the deviation is less than 100 points.
In short, markets have already priced in a terminal Fed Funds rate well north of 4.5%.
Of course, if inflation were to continue to run hot and the Fed must hike significantly more than currently expected to a terminal rate of 5%+ that could imply further downside for the P/E multiple. However, for now investors have already priced in the next 150 basis points of Fed rate hikes by driving down the market’s P/E multiple.
The relationship between rates and P/E multiples is entirely logical.
You see, stocks represent an ownership stake in a business and the value of a business is equal to the discounted present value of all future cash flows generated by that company. Money has time value, such that $10 today is worth more than $10 paid in 5 years’ time -- the only issue is how much less.
The answer has to do with the discount factor – the higher the discount factor applied to future cash flows, the less investors are willing to pay for future earnings and free cash flow. And the discount factor is correlated to prevailing interest rates – when the Fed hikes, the discount factor increases, which reduces the market’s P/E ratio.
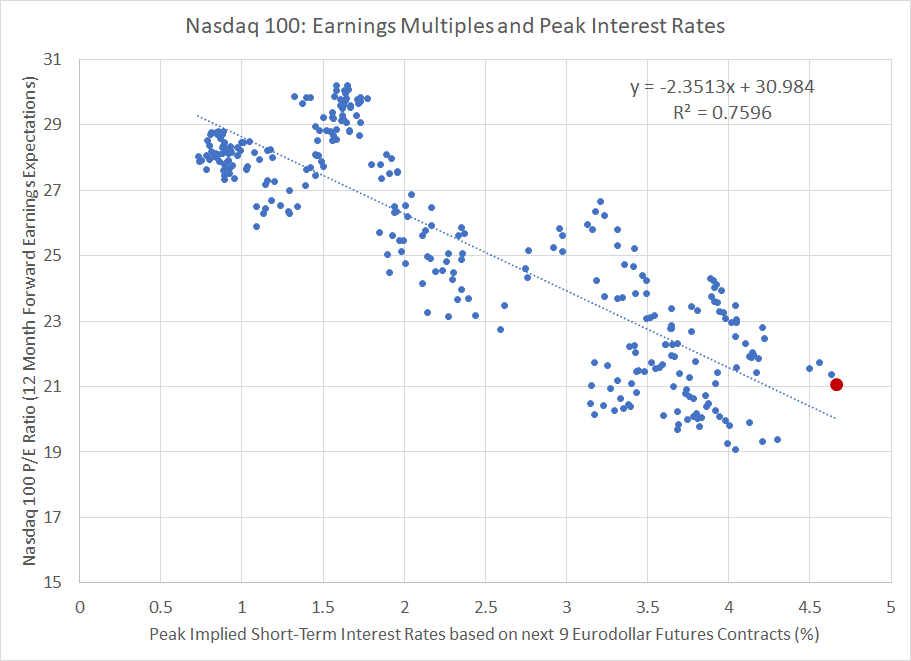
This also explains why the P/E ratio for the Nasdaq 100 is even more sensitive to interest rates that the S&P 500:
Source: Bloomberg
In this case, short-term interest rates “explain” about 76% of the Nasdaq 100’s earnings multiple since the end of June 2021.
Look at the equation I’ve overlaid on the chart.
As you can see the slope of this equation is -2.3513 compared to just -1.5931 for the S&P 500; essentially, that means every increase in peak rate expectations has a significantly larger downward impact on the P/E ratio for the Nasdaq 100 than for the S&P 500.
However, recall that there are two main fundamentals behind the price of an index like the S&P 500 – the P/E multiple I just outlined and expected future corporate earnings.
And that brings me to this:
The Bear’s Second Act
I’m looking for the next wave of the equity bear market to be driven primarily by economic weakness and downward revisions to corporate earnings expectations rather than solely multiple compression (a falling P/E ratio).
To date, Wall Street expectations for S&P 500 and Nasdaq 100 earnings over the next 12 months have been buoyant:

Source: Bloomberg
As you can see, Wall Street earnings estimates for the S&P 500 peaked over the summer, but have barely fallen since that time, remaining within 5% of the early July peak.
For the Nasdaq, the situation is a bit worse – estimates peaked on July 1st and are now down about 7.1%. However, as with the S&P 500, most of the recent selling pressure is down to rising rates (and a lower earnings multiple) rather than declining estimates for future earnings.
However, this is completely normal at this stage of the cycle.
Consider Wall Street earnings estimates for the S&P 500 from mid-1999 through the end of 2002.
As a reminder, in this cycle the S&P 500 peaked in late March 2000 and entered a mild recession a year later in March 2001. The recession was over by the end of 2001; however, the stock market didn’t bottom until October 2002.
S&P 500 estimates declined by a little over 15% from the cycle peak in October 2000 to the cycle low in December 2001. In other words, analysts started to reduce their estimates for corporate earnings AFTER the peak of the stock market and before the economy entered recession.
The pattern in 2006-09 was similar, though the scope of decline in corporate profit expectations was much larger due to the severity of the Great Recession of that era.
In this cycle Wall Street estimates hit a cycle high in July 2008, long after the market peak in October 2007 and the start of the recession in December 2007. The total decline from high to low was roughly 42% with estimates finding a low in March 2009, around the time the market bottomed and about 3 months before the end of recession in June 2009.
This point is crucial: The largest declines in both bear markets came AFTER analysts started to reduce their earnings estimates and price in a US recession.
Specifically, the entire decline of the 2000-02 bear market in the S&P 500 was 750 index points and 88% of that decline came after September 2000 when analysts started to reduce their estimates for S&P 500 earnings.
In 2007-09, the maximum point decline was 890 points with 68% of that coming after Wall Street expectations for future earnings began to decline in July 2008.
If the historical pattern holds then the 24.8% sell-off in the S&P in the first nine months of this year is just an appetizer for what’s to come. The decline in earnings estimates for the S&P 500 and Nasdaq Composite as more analysts begin to factor a recession into their models should bring about the more powerful and painful second act of the bear market.
What About the Pivot?
At this point, some of you may be wondering about a potential Fed “pivot” on rates in 2023 as the economy sinks into recession.
After all, following along with the analysis I just outlined, if the market starts to price in potential future rate cuts, this should drive down the discount rate applied to future cash flows and inflate P/E multiples once again.
However, historically when the economy enters recession and corporate earnings begin to contract, the relationship between P/E multiples and rate expectations breaks down.
Take a look:

Source: Bloomberg
This chart is a reprise of the scatter plots I showed you earlier comparing the peak rate implied by Eurodollar futures over the ensuing 2 years on the x-axis against the contemporaneous P/E multiple for the S&P 500 based on forward 12-month earnings estimates.
The only difference is that instead of basing this chart on data since June 30, 2021, this scatterplot represents daily data from January 2008 through to December 2009. The US economy was in recession from December 2007 through June 2009, and the Federal Reserve was cutting interest rates for most of the period covered by this chart.
As you can see, there’s not much of a relationship at all – the R-squared value drops to less than 18%. However, what’s even more shocking is the relationship here flips to a positive correlation.
What that means is falling interest rates, and rising expectations for future rate cuts, actually drove down the earnings multiple in 2008-09.
There’s some logic to that too.
After all, when the Fed is cutting rates, it’s usually a sign the economy is at risk of recession or, in this case, is already slipping into recession. As you might expect, recessions represent a time of increased uncertainty surrounding corporate earnings and the outlook for future cash flows and when uncertainty is on the rise, a rational investor is likely to demand a higher risk premium (lower earnings multiple and higher discount rate) to compensate for the risk of owning stocks.
Be Careful What You Wish For
The main argument advanced by equity bulls in recent months has been inflation is already peaking and will decline into 2023, allowing the Fed to cease hiking interest rates.
Some have even been looking for the Fed to pivot and start cutting rates in 2023; indeed, this was baked into Fed Funds futures expectations as recently as early September.
The bulls would argue that such a pivot – and lower interest rates – would prompt a “risk” rally powered by rising earnings multiples. Since earnings multiples for tech stocks and the Nasdaq tend to have higher sensitivity to rates than the S&P 500, the bulls’ logic holds these badly battered groups would be the big winners from such a pivot.
However, I see two gaping holes in this argument.
First, Jerome Powell’s speech in Jackson Hole in late August coupled with last month’s hot reading on inflation cast doubt on the entire idea of “peak” inflation.
The Cleveland Fed’s Trimmed Mean and Median indices are alternative measures of inflation that seek to eliminate components which add significantly or subtract significantly in a given month. The idea is to remove “outlier” CPI components that might bias the widely reported headline and core numbers higher or lower.
These measures both soared to record highs of +6.7% year-over-year for median and 7.2% for trimmed mean respectively based on data since the end of 1983.
On this basis, peak inflation looks like a mirage.
Thus, to bring down sky-high inflation in coming months, the Fed is likely to continue hiking interest rates and ultimately to keep rates in the 4%+ range for a prolonged period.
There may even be more upside to short-term rates should inflation continue to run hot into early 2023, keeping downward pressure on P/E multiples.
Second, the bullish scenario assumes the US will avoid recession – both an economic downturn and an “earnings recession” where profit estimates for the S&P 500 decline significantly.
That’s because a Fed “pivot” on rates in response to rising risk of an economic downturn – the lynchpin of the bulls’ argument -- does NOT boost earnings multiples as it would do in more normal economic environments as the 2007-09 experience illustrates.
Instead, increased economic uncertainty and risk to S&P 500 earnings tend to prompt investors to demand a higher equity risk premium – lower earnings multiple -- to take on volatility inherent in owning stocks.
Let me be more blunt: When the Fed does pivot, it won’t be good news but a signal the US recession is underway.
Since I expect recession and weakness in corporate earnings to power the next leg lower for the broader market, I believe the next big downside catalyst for the S&P 500 will be the upcoming Q3 2022 earnings season. Q3 reporting season is due to kick off around October 14th with a handful of major financials reporting results, so the time to act is now.
DISCLAIMER: This article is not investment advice and represents the opinions of its author, Elliott Gue. The Free Market Speculator is NOT a securities broker/dealer or an investment advisor. You are responsible for your own investment decisions. All information contained in our newsletters and posts should be independently verified with the companies mentioned, and readers should always conduct their own research and due diligence and consider obtaining professional advice before making any investment decision.