

Gold's Autumn Resilience
Gold's Autumn Resilience
Soaring interest rates, a strong dollar and rising gold prices

Gold prices have been on a rollercoaster ride over the past few weeks.
First, gold slumped from around $1,900 per ounce in late September to just over $1,800 in early October and, more recently, gold has recovered to around $1,960 an ounce.
Back in a late-March issue of The Free Market Speculator, “The Golden Rules,” I outlined a simple fundamental model I use for tracking gold prices based on two inputs, the US Dollar Index (DXY) and the level of real interest rates, the latter defined as the yield on 5-Year Treasury Inflation-Protected Securities (TIPS).
Specifically, the model seeks to explain 5-week percentage changes in the price of gold using contemporaneous 5-week changes in the DXY and 5-Year TIPS yields. I estimated the model based on data from 1997 through the end of 2020.
(If you’re interested in exploring the logic of the model, I suggest reading The Golden Rules post as background).
The model isn’t perfect — far from it — however, with an R-squared of about 26%, this simple, two-variable model has significant utility in explaining why gold moves as it does over time. Generally, in the out-of-sample period for the model — since the end of 2020 — it’s tracked the directional changes in gold quite well though price of gold is more volatile than the model would suggest.
And that brings me to this:
I’ve had a few readers ask me why the price of gold has been so strong over the past couple of weeks given the US Dollar Index is trading near the highest levels so far this year and the yield on 5-year TIPS currently stands at 2.6%, the highest since late 2008, some 15 years ago.
So, let’s take a look:
Source: Bloomberg, Free Market Speculator
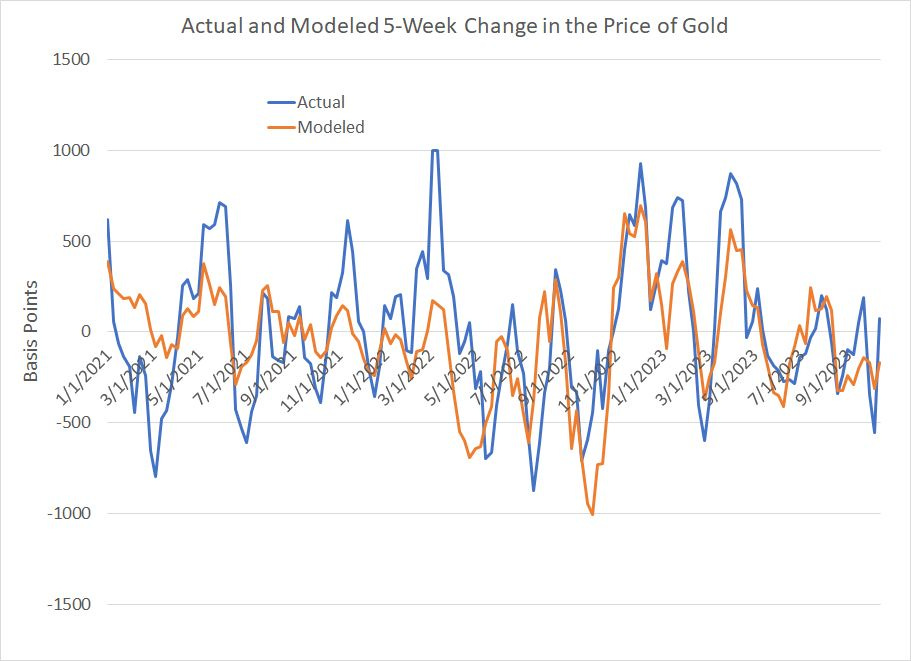
This chart shows the modeled 5-week change in the price of gold based on the two input variables I just outlined in orange and the actual 5-week change in the price of gold in blue. I’ve plotted the model and actual data since early 2021, and since the model is based on weekly data, I’ve updated it through the end of last week (Friday, October 13th).
I must admit I was a bit surprised when I updated this chart.
My gut reaction was the surge in gold prices in recent weeks would be tough to justify given strength in the dollar and soaring real rates. However, the reality is that gold prices really aren’t that strong relative to these core fundamentals.
Yes, the model suggests gold prices “should” be lower by around 1.7% over the 5 weeks ended October 13th and they were actually slightly higher to the tune of about 0.75%. So, the model was wrong, and directionally wrong about gold, however, the degree of the “miss” here pales in comparison to what we saw back in early 2022 around the Russian invasion of Ukraine.
Simply put, the model suggests gold prices should be a bit weaker over the past 5 weeks and they’re actually up less than 1%. That’s hardly an Earth-shattering conclusion — still, it’s worth considering what might be driving this (mild) divergence.
Heightened Geopolitical Risks
My first thought was it might be down to the terrorist attacks in Israel and subsequent concerns about geopolitical instability in the Middle East. That’s a sensible hypothesis; gold prices, for example, jumped short-term following the September 11, 2001 terrorist attacks in the US.
However, take a look at this:
Source: Bloomberg
In recent years exchange-traded funds (ETFs) like the SPDR Gold Shares (NYSE: GLD) have become an increasingly popular and inexpensive way for investors to gain quick exposure to gold in their portfolios.
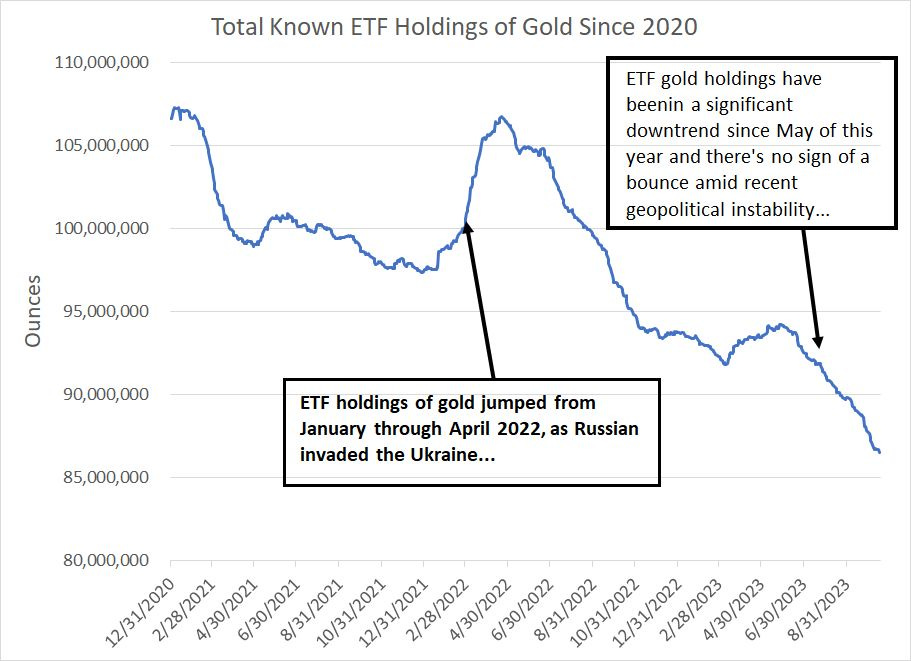
This chart tracks the total known ETF holdings of gold around the world since the end of 2020.
As you can see, ETF holdings of gold spiked back in early 2022, starting around a month before Russia’s invasion of Ukraine. The spike in ETF gold holdings was significant and persisted until late April 2022.
Flip back to my chart of the gold model above and you’ll see it dramatically underestimated the rally in gold back in early 2022. In my view, it’s reasonable to posit two points:
Investors were buying gold in early 2022 as a hedge against geopolitical instability and related inflation risks.
Relentless demand for gold from ETFs helped drive the price spike in the yellow metal that exceeded what you’d expect to see given the basic, underlying moves in the US dollar and real rates.
However, what’s interesting is that we’re seeing the exact opposite trend this month — investors have been relentlessly selling gold ETFs, and there’s little or no sign of a turn since the attacks in Israel almost two weeks ago now.
So, while the geopolitical risks argument might appear logical, you’d expect to see investors looking to hedge these risks buying gold via ETFs and that’s just not happening.
Physical Demand and Diwali
India is one of the largest markets for gold in the world, particularly gold jewelry seen as auspicious and a store of wealth.
Historically, physical demand for gold in India spikes around the time of Diwali, the Festival of Lights, which falls on November 12th this year. Indeed, this may explain some of the seasonality in gold:

Source: Bloomberg
Based on data over the past 20 years, the months of November through January are seasonally bullish for gold prices. That could well be due to Diwali as well as, of course, jewelry purchases around Christmas.
That could also explain some of the recent strength in gold. However, this effect doesn’t typically get started until November and the magnitude doesn’t look adequate to explain the recent surge in gold prices.
Further, monsoon rains account for about 70% of India’s irrigation and rainfall hit a five-year low this year due primarily to El Nino. Historically, that hurts rural incomes, which are key to Indian gold demand this time of year. So, seasonal physical demand doesn’t seem a particularly compelling factor driving gold’s resilience.
So, that brings me to this:
An Inflationary Recency Bias
Investors suffer from recency bias, a tendency to overestimate the importance of recent events and experiences when forecasting the future.
In this case, that means using a post-2000 cyclical template for gold when a 1970s model is more appropriate:
Source: Bloomberg
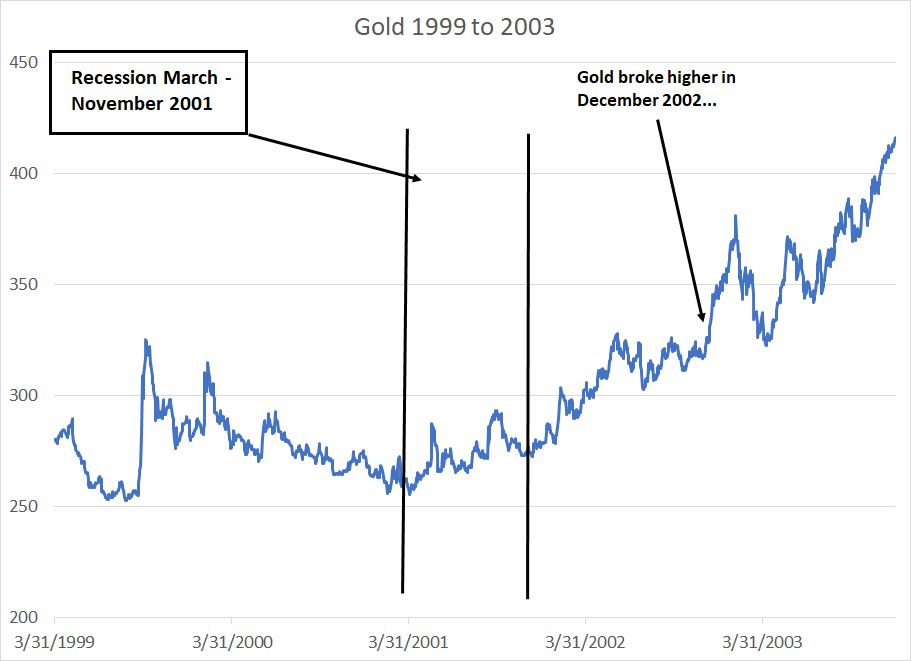
This chart shows the price of gold from March 1999 through December 2003.
In this cycle, the S&P 500 peaked in March 2000 and entered a long, severe bear market that didn’t bottom until the fall of 2002. Per NBER the US economy entered a short, mild recession from March 2001 through November of the same year.
The Federal Reserve last hiked interest rates in May 2000 and made its first (surprise) cut in January 2001. And, finally, the US dollar Index peaked near multi-year highs in June 2001 and the weak dollar trade continued until April 2008.
As you can see, gold prices were pretty quiet through this cycle.
Not only was gold roughly flat through the recession of 2001, but it got no boost from a weakening dollar starting in mid-2001, did not act as a flight-to-safety trade amid stock market weakness in 2000-01, did not respond positively to Fed rate cuts starting in early 2001 and saw only a short term spike around the September 2001 terrorist attacks.
Indeed, gold did not break meaningfully above its late-90s peak until December 2002 after the recession and bear market were over.
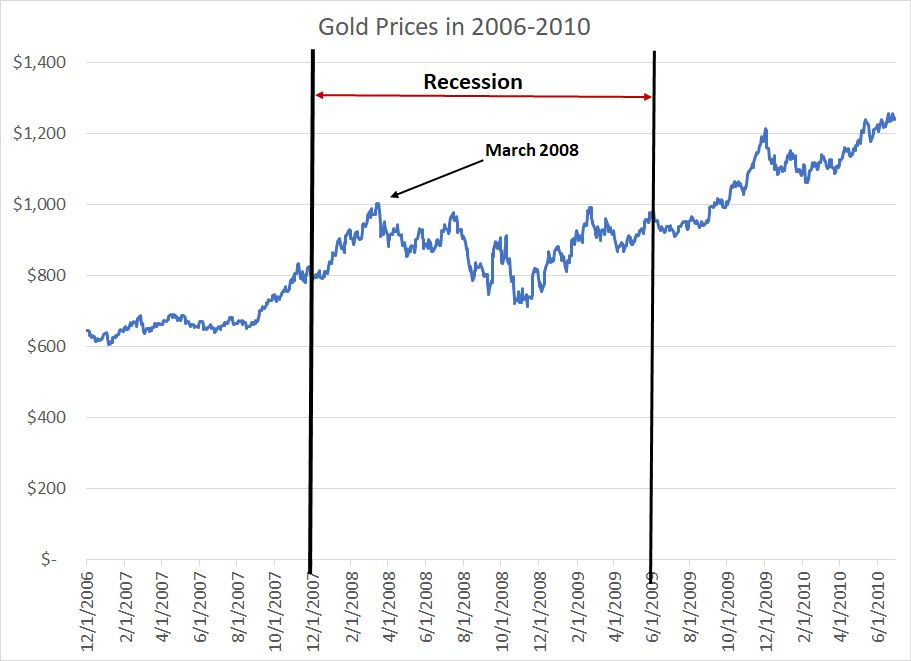
Here’s the 2007-09 cycle:
Source: Bloomberg
Same pattern here.
Gold actually rallied a bit heading into the recession of 2007-09 but peaked early in the contraction (March 2008) and sold off alongside stocks through most of 2008. Once again, the price of gold was broadly flat through this cycle and did not break meaningfully higher until after the recession and S&P 500 bear market of October 2007-March 2009 was long over.
However, look back at the 1970s:
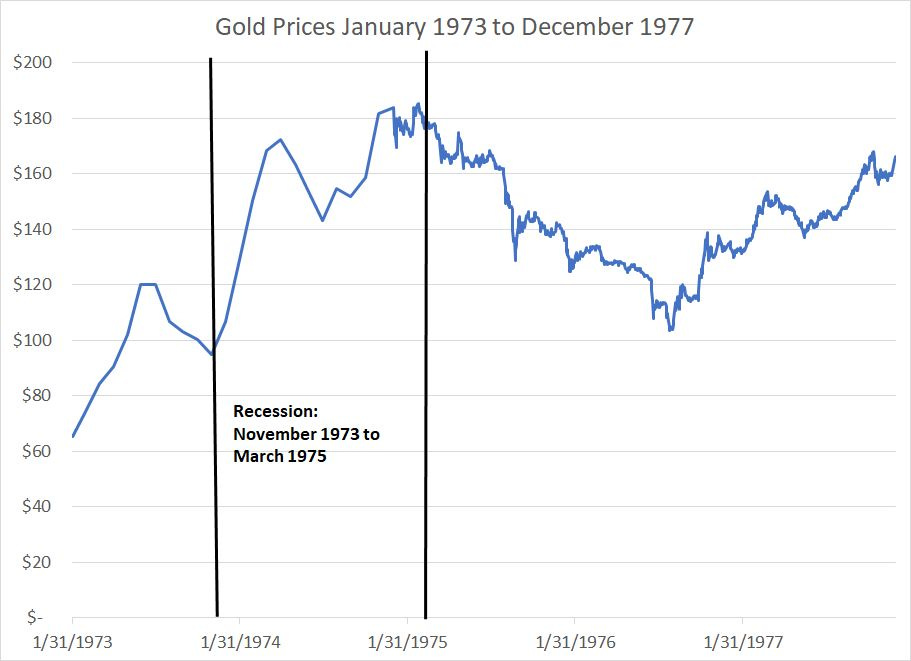
Source: Bloomberg
As you can see, the US recession of this period was from November 1973 to March 1975 and gold was strong ahead of the recession of this era. Indeed, in contrast to the 2000-02 and 2007-09 experience, the rally in gold actually accelerated around the the start of recession in 1973 and didn’t peak until the economy was in recovery in early 1975.
(Gold then bottomed in 1976 and exploded higher to a higher high in January 1980).
Gold performed well in the 1973-75 cycle despite:
A 21% rally in the US dollar Index from the summer of 1973 through to January 1974.
A surge in the effective Fed Funds rate from 5.5% in January 1973 to a peak of over 14% in July 1974.
In other words, it appears the basic fundamental drivers for gold — real rates and the dollar — which have worked so well since the late 1990s amid low inflation were less important in the inflationary cycles of the 70’s and early 80’s.
This is the same effect I analyzed at some length for the broader Bloomberg Commodity Index in the September 5, 2023 issue of FMS “Commodities, Recession and Inflation.”
Here’s the bottom line:

Source: Bloomberg
Gold prices peaked more than a decade ago around $1,900/oz, pulled back to a low in 2015-16 and finally broke above that 2011 high in 2020.
That’s a near decade-long basing pattern I’ve labeled on this chart above.
As you can see, gold has tested and failed to close above that $2,000 to $2,050/oz zone on three separate occasions since the summer of 2020.
The conventional wisdom right now is surging real interest rates and a strong US dollar should thwart the yellow metal’s efforts to break that well-established resistance zone.
This conventional wisdom is based on the same logic that underpins the gold model I mentioned earlier — a model that’s been a useful guide since the late 1990s. Similarly, if you’re like me you’ve probably ready countless articles over the past few weeks arguing that oil prices “should” fall due to weakening demand, a consequence of high prices and weaker economic growth.
However, I’d posit that this well-worn, modern commodity playbook is inappropriate in an inflationary cycle — in inflationary cycles, commodities tend to enter supercycles that are far more persistent, and result in much larger rallies, than most market participants expect.
For gold, I’m watching that $2,000 to $2,050 resistance level — if gold closes above that zone, we could be in for a quick move to around $3,000/oz.
As a special offer for the Orlando Money Show investment conference later this month, I’m offering 60-day free trials to the paid tier of The Free Market Speculator.
The paid tier includes additional market commentary and a model portfolio of specific stock and ETF recommendations.
You can sign up, by tapping the button below.
This offer expires on Friday, November 3rd.
DISCLAIMER: This article is not investment advice and represents the opinions of its author, Elliott Gue. The Free Market Speculator is NOT a securities broker/dealer or an investment advisor. You are responsible for your own investment decisions. All information contained in our newsletters and posts should be independently verified with the companies mentioned, and readers should always conduct their own research and due diligence and consider obtaining professional advice before making any investment decision.