

Good Value in a Top-Heavy Market
Good Value in a Top-Heavy Market
Adding exposure to a cheap market with a powerful upside catalyst

With 2023 half over, the 10 largest stocks in the S&P 500 are up 17.1% year-to-date compared to a gain of just 4.1% for the S&P 500 Equal-Weight Index.
Of course, the stock market can rally further, driven by just a handful of large components; however, let’s take a closer look at the history of top-heavy rallies like this:

Source: Bloomberg
Bloomberg offers individual stock return and index composition data stretching back to the end of 1992, so I examined the average performance of the largest 10 stocks in the S&P 500 over the past three decades.
This chart reports the average total return for the top 10 less the return on the S&P 500 Equal Weight Index – a positive number indicates outperformance by the top 10 and a negative number signifies the S&P Equal Weight Index outperforms.
With the year less than half over, the Top 10 stocks are outperforming by a whopping 13%; if the year ended today, there are only 5 other years where the Top 10 stocks in the index have outperformed the rest of the market by a larger magnitude. And should the current pace of outperformance continue through the end of the year, the only year that’s more top-heavy than 2023 would be 1998 when the 10 largest stocks in the S&P beat the market by a whopping 29.5 percentage points.
However, I believe that understates just how unusual 2023 is compared to any other year since the early 1990s:

Source: Bloomberg
Since 1992 there have been 11 years including year-to-date 2023 where the 10 largest stocks in the S&P 500 have outperformed the Index by 10 percentage points or more – those 11 years are listed in my table above.
The table also includes the average price to earnings ratio for the 10 largest stocks in the S&P 500 at the end of the prior year; for example, the row marked “1998” offers summary statistics for the S&P 500 as of the end of 1997.
The results here are extraordinary.
As of the end of 2022 (last year) the top 10 stocks in the S&P 500 by market capitalization traded at 29 times earnings compared to 18.2 times for the S&P 500, about 11 turns higher.
The only year on my table with a larger valuation gap is 1999; as of the end of 1998 the 10 largest stocks in the S&P 500 traded at an average P/E of 41.5 times compared to 27.7 times for the S&P 500.
That said, before the stock market’s blistering run higher in 1999, the 10 largest stocks in the index held an index weight of “only” 22.3% compared to more than 31.2% as of the end of 2022. In the past 30 years, these figures suggest there’s never been a more “top-heavy” market where such a small group of large-cap stocks account for such a dominant share of the S&P 500 and are trading at such stretched valuations relative to the market as a whole.
In some respects, the situation is even more extreme this year than it was at the height of the late 1990s Nasdaq bubble.
Of course, just because the disconnect between the 10 largest stocks in the S&P 500 and the rest of the index is extreme doesn’t mean the broader market is close to a major peak. After all, as I just explained, the market was also top heavy at the end of 1998, yet the S&P 500 jumped an additional 26% to its March 2000 peak while the Nasdaq 100 soared 126.8%.
As John Maynard Keynes once said: “The market can remain irrational longer than you can remain solvent.”
However, history does show top heavy rallies like this eventually fail, often in spectacular fashion. Momentum traders of the late 1960s, buying the so-called “Nifty 50” stocks of that era, were crushed amid the Great Inflation of the 1970s. And, of course, anyone who bought the “New Economy” and dot-com darlings of the late 1990’s lost more than 80% of their capital on average amid the bear market of 2000-02.
In my view, this time is NOT different – it never is.
The good news is that there is a silver lining in all this. You see, while the top 10 stocks in the S&P are trading at nosebleed valuations, the US stock market is not particularly expensive overall:
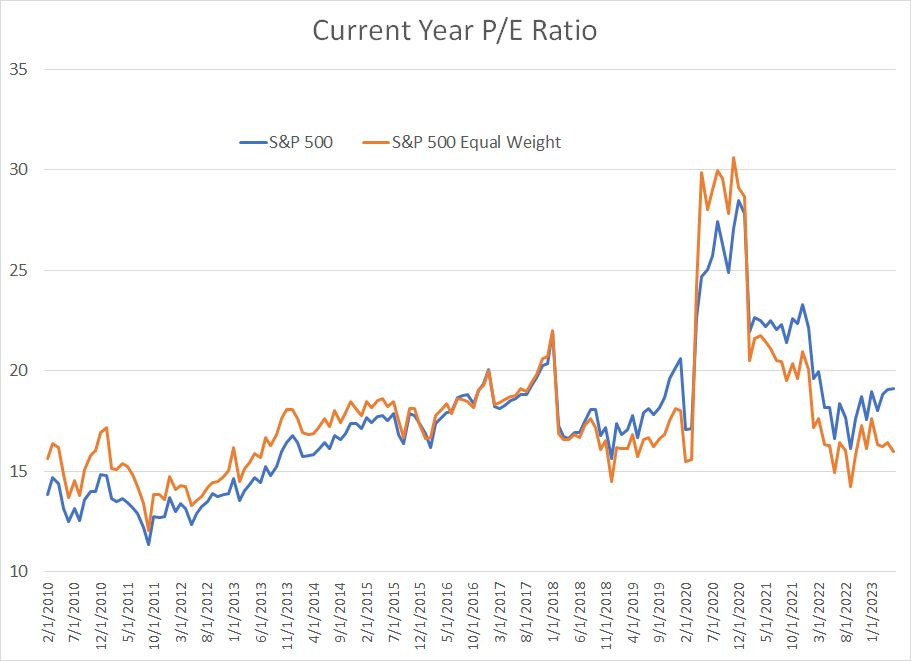
Source: Bloomberg
As I write this update, the 10 largest stocks in the S&P 500 are trading at an average valuation of more than 32 times expected 2023 earnings estimates and 29.7 times next year’s expected earnings.
Meanwhile, the S&P 500 trades at 19 times this year’s earnings estimates and the S&P 500 Equal Weight at under 16 times.
You don’t have to buy Nvidia (NSDQ: NVDA), trading at 40 times annual sales, to outperform the broader market right now – indeed, 3 of our 4 most recent model portfolio additions, all added since early May, are outperforming the S&P 500 over equivalent holding periods and are trading at valuations well below the broader market average.
In this issue, I’m adding exposure to one of the cheapest stock markets in the world right now with a positive upside catalyst coming later this summer.
Keep reading with a 7-day free trial
Subscribe to The Free Market Speculator to keep reading this post and get 7 days of free access to the full post archives.