

In the Long Run We're All Dead
In the Long Run We're All Dead
How to prosper when buy and hold fails

Over the years you’ve probably heard myriad pundits preach the best move an investor can make is to buy and hold a diversified portfolio of stocks for the long haul.
This single concept is behind the dramatic rise in popularity of simple passive indexing strategies and exchange traded funds (ETFs) over the past two decades.
However, before you run out and buy an index fund or the SPDR S&P 500 ETF Trust (NYSE: SPY), consider this chart:

Source: Bloomberg
This chart shows real (inflation-adjusted) returns from the S&P 500 over 10-year periods by date of purchase since January 1970 including both capital gains and dividends. The last month on this chart is November 2012 and shows the annualized real return from buying the S&P 500 in November 2012 and holding through the end of November 2022.
If you happened to invest in the broader market from roughly 1980 through to the early 1990s, you generated strong returns from holding the S&P 500 of 10%+ annualized even after adjusting for inflation.
However, if you bought the S&P 500 on virtually any month from 1970 through 1974 or from 1998 through 2003 you likely lost money on a real basis over the ensuing 10 years.
My point: Even long-term positive real returns from the stock market aren’t guaranteed.
Specifically, if you buy the S&P 500 when valuations are relatively low and inflation is low or falling, you can expect to generate strong inflation-adjusted returns from a passive indexing strategy. However, when the market is expensive and/or inflation is rising and/or elevated there’s a real risk of negative market returns even over the long haul.
Examples of the former include the late 70’s/early 80s and the 2009-12 periods. Examples of the latter include the early 1970s and the late 1990s.
When I first entered this business in the late 1990s there was a lot of talk in the mainstream media about buy-and-hold, indexing and the New Economy – after all, we were just coming to the end of the historic bull market in the S&P 500, and a 20-year disinflationary period that started in the early 1980s.
However, stocks were extremely expensive – the 10-year P/E ratio metric for the S&P 500 discussed in The Free Market Speculator last week, reached a peak north of 45 in late 1999 and early 2000. The S&P 500 went on to produce negative real returns (and negative nominal returns) over the ensuing 10-year holding period.
In contrast, by late 2008-early 2009 investors were talking about a second Great Depression and there was very little talk of the “buy and hold” strategies so popular a decade earlier. I personally heard some investors scoff in October 2008 when Warren Buffett published an op-ed in The New York Times essentially urging investors to buy US stocks titled “Buy American. I Am.”
Yet, stocks were cheap – the S&P 500 traded down to 12.12 times 10-year average earnings in early 2009 – and the stock market produced inflation-adjusted gains in excess of 16% annualized over the ensuing 10-year period.
A quick glance at my rolling returns chart shows the go-go “Gunslingers” growth era of the late 1960’s and early 1970s was a terrible time to buy stocks, while those who bought stocks in August 1979 when BusinessWeek published an article titled “The Death of Equities: How Inflation is Destroying the Stock Market,” were rewarded with strong subsequent long-term returns.
In other words, while 50+ year average returns from the stock market are solid and beat inflation by a comfortable margin – 10-year rolling market returns go through multi-year cycles of boom and bust.
Buying the S&P 500 or the “market” for the long-haul only works if you have a very long investment horizon – say 15 to 20 years or longer – or if you pay attention to the price you’re paying for stocks (market valuations).
Given the combination of high market valuations today and the recent, persistent rise in inflation, I suspect we’re currently in a period more like the early 1970s or the late 1990s rather than the early 1980s or 2009-2010.
That means a prolonged period of weak real equity returns from the broader market.
I’ll be blunt:
If you’re OK with seeing 20% plus drawdowns in your portfolio, real returns in the 0% to 5% annualized range over the next 5 to 10 years and are truly planning to hold stocks for 15 or (preferably) 20+ years then you’ll probably beat inflation buying and regularly adding to your investment in an S&P 500 index fund.
Let me be clear, I don’t think that’s an optimal strategy and I believe even long-term investors could significantly outperform this passive approach by focusing their buying on periods when the stock market looks cheaper on long-term valuation metrics such as the P/E ratio I outlined last week.
I also believe, as I’ll explain in the next section, that stock and sector selectivity could significantly enhance equity market returns over the next 5 to 10 years much like the 1970’s and the decade from 2000-2010.
However, if you need some return from the market before the early 2030s, maybe some dividend income from your portfolio or just some modicum of stability and peace of mind through the coming market storms then current market valuations suggest right now is a dangerous time to be a long-term passive indexer.
How to Profit in a Low Return World
History suggests there are two basic ways to profit in a low-return world much like we saw in the 70’s and again from 2000-2010.
First, you can play the cycles.
Simply put, even if stock market returns over the next decade fail to keep pace with inflation, those returns are unlikely to be a steady drip lower over 1 or 2% annualized. Instead, much like the 1970s and again from 2000-2010, there are likely to be dramatic cyclical moves within the broader sideways market:
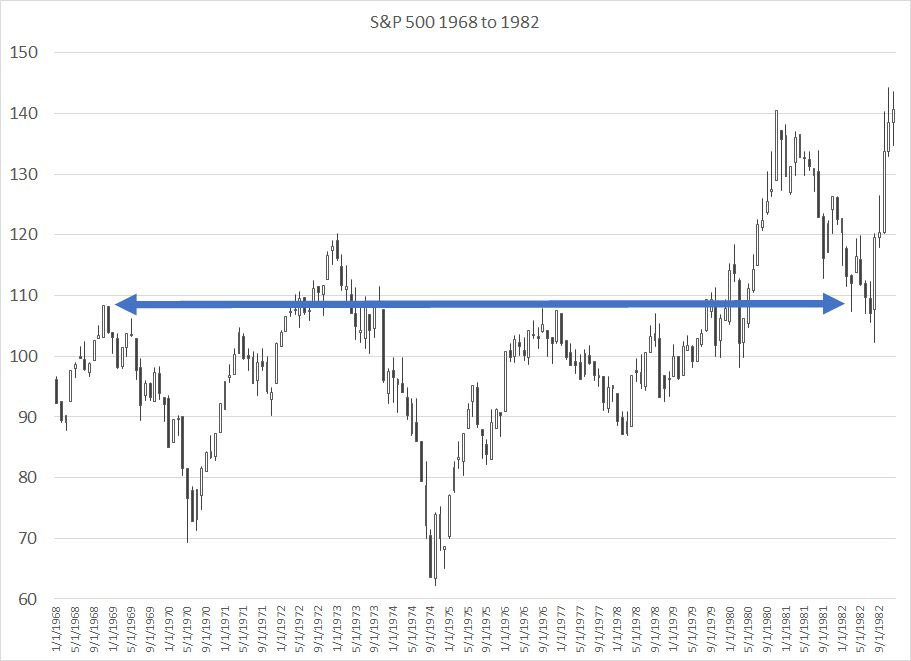
Source: Bloomberg
This is a monthly chart of the S&P 500 from January 1968 through the end of 1982.
As I’ve labeled with the blue arrow above, in the middle of 1982 the S&P 500 retested a level it first reached almost 14 years earlier in late 1968.
That was a terrible time to buy and hold stocks.
Account for the sky-high inflation of that era, the purchasing power of your portfolio of stocks was far lower in mid-1982 that it was in late 1968 plus you had to contend with all those swings in markets through the 1970s and early 1980s.
However, as the broader market marched in place, there were some dramatic rallies and sell-offs along the way – the 1968 to 1970 bear market, a 70%+ rally in the broader market from mid-1970 to the end of 1972, the vicious 50% sell-off in the 1973-74 bear market and recession and rallies of 73%+ and 60%+ from later 1974 to 1977 and 1978 to late 1980.
These are not short-term “trades” – these moves were major multi-year rallies and sell-offs.
In short, if you’re willing to monitor the economic and market cycles – the business cycle, inflation and market internals – you could have made money through the 70s, profiting from the big cyclical rallies and avoiding stocks (or profiting on the short side) during the bear markets.
Much the same can be said of the 2000’s:
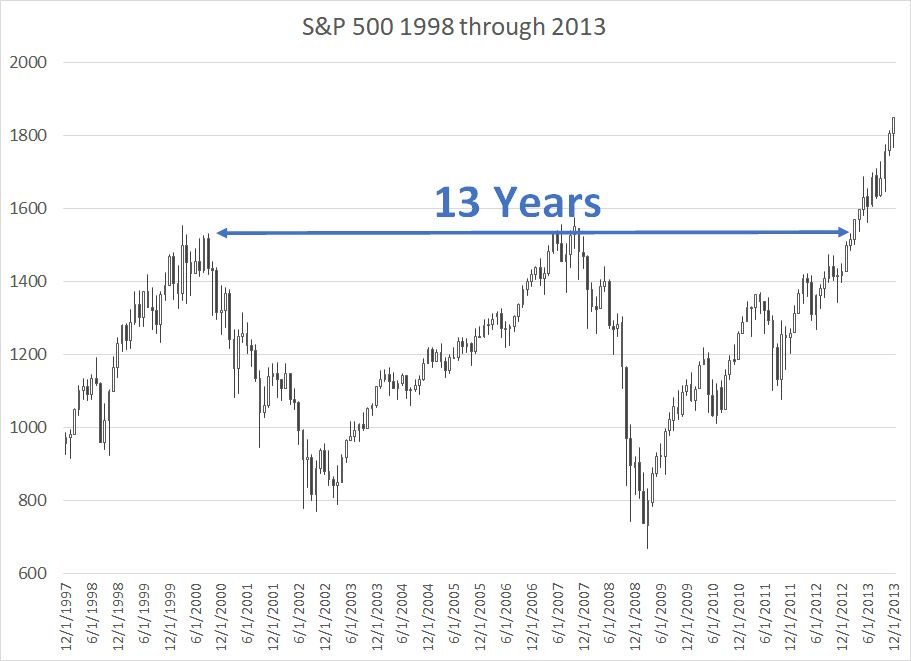
Source: Bloomberg
Here’s a monthly chart of the S&P 500 from the end of 1997 through the end of 2013.
The broader market did not definitively break above its 2000 peak until late 2013.
The S&P 500 buy and hold strategy didn’t make money for more than a decade; however, investors who avoided the bulk of the 2000-02 and 2007-09 bear markets and participated in at least part of the 2002-2007 and 2009+ rallies made some serious cash.
This in a nutshell is why I focus so much time and attention on economic and stock market indicators in The Free Market Speculator – these are indicators of cyclical conditions.
This point is crucial: You don’t need to time these cycles precisely to generate wealth through long periods of sub-par returns such as 1968-1982 and 2000-13.
Historically, even if you’re 6 months late getting out of stocks after the peak of a bull market and jump back in 6 months AFTER a key low, you can generate impressive returns in cyclical markets with below-market risk and volatility.
I won’t go into great depth in today’s issue as this is a subject I’ll cover in an upcoming series of year ahead pieces I’ll be publishing in comin g weeks . Suffice it to say that, as long-term readers are well aware, I’m looking for the US to enter recession in 2023 and for the broader market to make significant new lows before the current bear cycle has run its course.
In this environment my tactical focus in The Free Market Speculator remains to avoid – and profit from – additional market downside while eventually taking advantage of discounted market valuations as the market finally finds a low.
And that brings to the second proven way of making money in a low-return world: Pick your spots.
Take a look at this table:
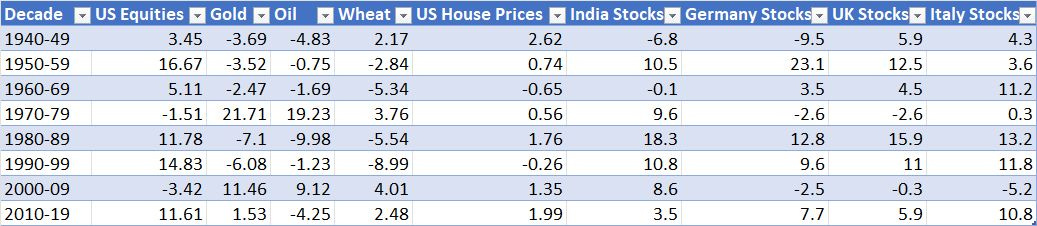
Source: Deutsche Bank “Long-Term Asset Return Study” 8 September 2020
This table shows annualized real (inflation-adjusted) returns for several different asset classes broken down by decade.
As you can see, the 1970s – the row labeled 1970-79 on the table – was a terrible time to be invested in US, German or UK-based stocks as I previously noted. However, Indian stocks returned a whopping 9.6% annualized for the decade, gold prices rose 21.71% annualized, and oil prices were up 19.23% annualized.
The “lost decade” from 2000-09 was again bad for the broader US market, but India, gold, oil and wheat all offered strong positive real returns.
And, let’s add a layer of granularity:
In the 2000-09 decade, the S&P 500 lost a total of 9.1% and the Nasdaq Composite plummeted 39.8%; on a real return basis, the decade was the worst for US stocks on my table.
Yet, the Russell 1000 Value Index rose almost 28%, the Russell 2000 small-cap Index jumped 40.8%, the Russell 2000 Value Index was up 120.4% and the S&P 500 Energy Index soared 148.7% (9.53% annualized).
In contrast, the decade from 2009-2020 produced double-digit real returns for US stocks; however, that was primarily due to a surge in large cap growth names with the Russell 1000 Growth Index outperforming its Value counterpart by more than 100 percentage points over the course of the decade.
Of course, 10 years is a long time, and I don’t have a crystal ball – I’ll recommend adapting to changing conditions over time. However, my big picture view is that small-cap, value stocks and commodities are well-positioned to outperform the S&P 500 for the next several years.
One reason goes back to the long-term valuation and stock market returns study I published in last week’s installment of The Free Market Speculator:
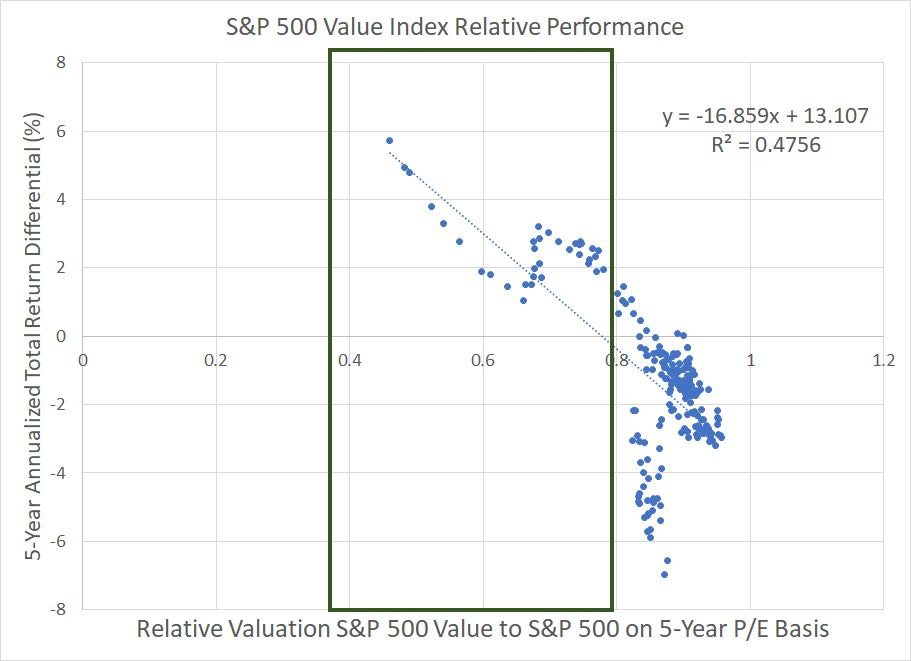
Source: Bloomberg
Unfortunately, I don’t have earnings or price-to-earnings data for the S&P 500 Value Index dating prior to the mid-1990s, so it’s not possible to examine relative valuations for the S&P 500 Value Index and the S&P 500 dating back to the 1970s.
However, I created a simple relative valuation model for both indices based on data since 1995. Simply put I calculated the P/E ratio for both value and growth based on average 5-year earnings and then created a scatterplot of 5-year forward returns of the S&P 500 Value Index compared to the S&P 500.
The horizontal axis represents the relative valuation of Value stocks vs. the broader market – higher numbers, further to the right on my chart, indicate value stocks more expensive relative to the broader market. The vertical axis shows the performance of value relative to the broader market – positive numbers indicate value outperformance and negative the opposite.
Based on this more limited data set, there’s clearly a negative correlation – when value is relatively expensive compared to the S&P 500, value stocks tend to underperform over the ensuing 5 years. The R-squared value is a healthy 47.6% suggesting that relative valuations explain nearly half of relative market returns for value.
What’s even more interesting is that when the P/E for the S&P 500 value Index is less than 83% of that for the S&P 500 there has not been a period where value stocks have NOT outperformed the broader market. Ratios of under 0.80 or so – the green box region of my chart – have never failed to produce significant subsequent value outperformance.
In late 2021, this ratio stood at under 0.70, indicating that value stocks were cheaper relative to the broader market than they’d been at any time since 2001. Even today, after more than a year of dramatic value outperformance, the ratio stands at 0.82, so value remains cheap on a relative basis.
And check out this similar chart for the Russell 2000 index of small caps:
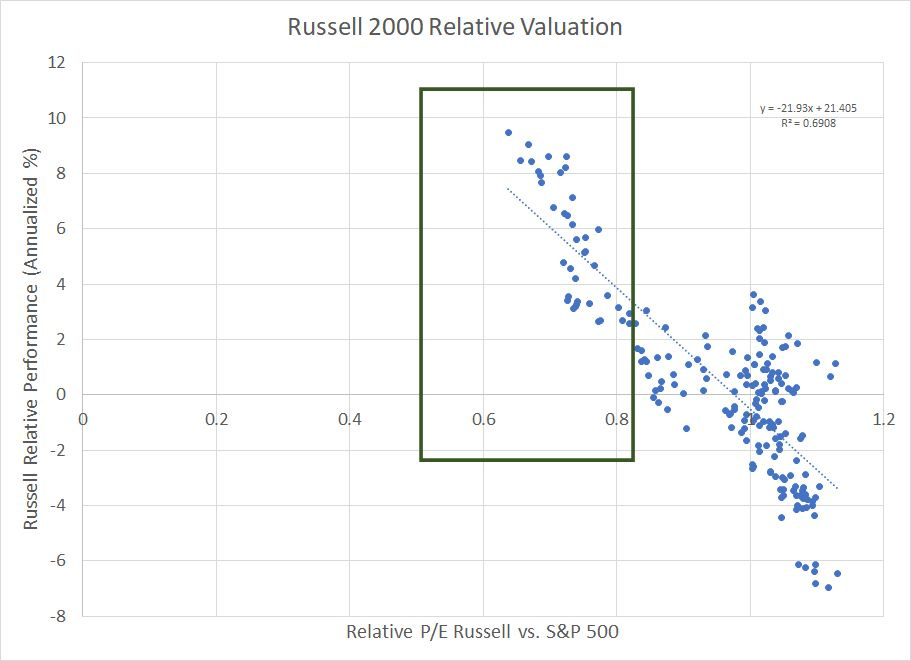
Source: Bloomberg
Relative valuations for small cap stocks to the S&P 500 are even more strongly correlated to subsequent market returns – as you can see, the R-squared value for this chart is close to 70%.
Historically, when the P/E ratio for the Russell 2000 is less than 0.82 times that of the S&P 500, the Russell has not failed to beat the broader market by less that about 2% annualized over the ensuing 5 year holding period.
The current ratio: 0.67 on this basis.
There is one important caveat to keep in mind regarding the Russell 2000 and small caps. Over 15 to 20 years, there’s been a proliferation of small-cap stocks in the index – particularly biotechnology stocks – that lose money. This growing cadre of money-losing small caps inflates the P-E ratio for the Russell 2000 as a whole and makes more recent valuation metrics less comparable to years prior to around 2005.
So, the relative P/E measure for the Russell 2000 in my chart above excludes any stocks in the index with negative annual earnings.
In short, profitable Russell 2000 companies are as cheap as they’ve been relative to the S&P 500 at any time in the past 22 years.
And it’s not just valuations that support value and small cap outperformance, it’s also (nascent) shifting momentum:
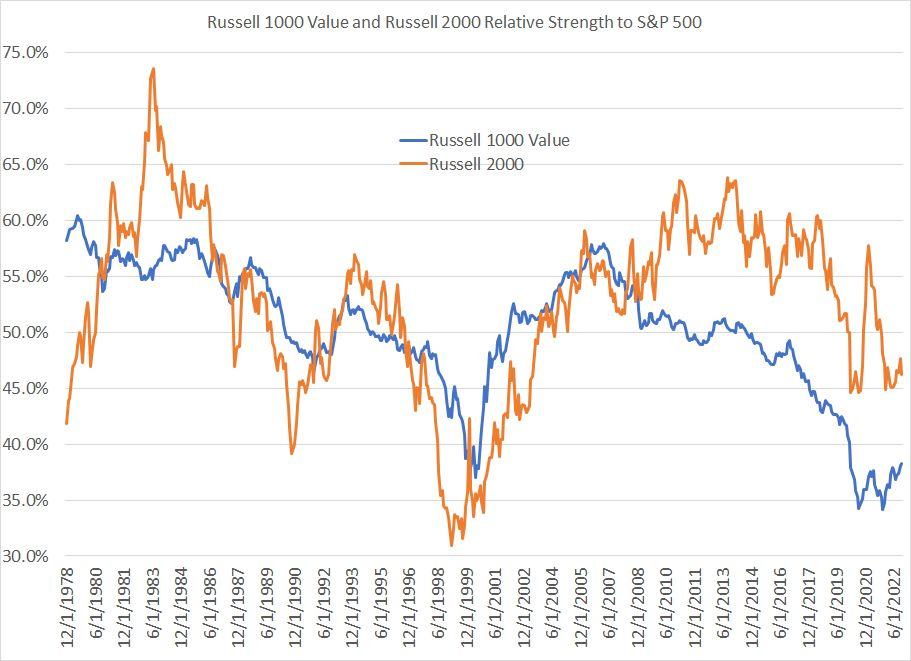
Source: Bloomberg
This chart shows the relative strength of the Russell 1000 Value and Russell 2000 Indices to the S&P 500 (based on price only) since December 1978.
Can you see how value and small cap stocks go through multi-year cycles of underperformance and outperformance over the past four decades?
The last big cycle of value and small-cap outperformance started in the late 1990s and ended in 2007 for value and 2013 or so for small-caps. Both underperformed from those peaks up until late 2021/early 2022 and have since recovered notably (particularly value stocks).
It’s early, but given the historical relative trends here, it looks quite feasible we’re entering a multi-year period of improving relative strength for small-cap and value stocks. Indeed, it’d posit that when this new value/small-cap age is finally over, it’s likely that growth stocks will be as out-of-favor as they were in 2007-08 and back in the late 1970’s once again.
Shifts in investor sentiment of that magnitude and importance take time and that offers the potential for years of outperformance for investors looking ahead for pockets of relative value rather than following the crowd, focusing on the big winners of the past decade.
In short, there will almost certainly be asset classes, individual market sectors and investing “styles” that produce stellar returns over the next 5 to 10 years even if the broader market faces a period of volatility and/or negative real returns.
That’s it for this issue of The Free Market Speculator. If you enjoyed today’s post, please click the heart shaped like button on this page. And if you’d like to receive alerts when I publish new issues and updates, please subscribe via the link below (it’s 100% complimentary and you can unsubscribe at any time).
DISCLAIMER: This article is not investment advice and represents the opinions of its author, Elliott Gue. The Free Market Speculator is NOT a securities broker/dealer or an investment advisor. You are responsible for your own investment decisions. All information contained in our newsletters and posts should be independently verified with the companies mentioned, and readers should always conduct their own research and due diligence and consider obtaining professional advice before making any investment decision.