

Inflation and Rotation
Inflation and Rotation
Plus some sectors and themes on my radar screen

Inflation is still a problem.
When evaluating year-over-year changes in the Consumer Price Index (CPI), it’s important to consider base effects. In other words, if you’re comparing the current index level to the index one year ago, you should consider the trends in inflation in the year-ago period.
If you’re comparing current inflation to a “hot” number one year ago, it’ll make the year-over-year comparison appear more benign. In contrast, if the current month’s CPI is being compared to a benign number a year ago, it’ll render the year-over-year comparison misleading on the high side.
So, one of the adjustments I like to make is to consider the changes in prices over the past 3- and 6-month periods:

Source: Bloomberg, Bureau of Labor Statistics (BLS)
This chart shows the annualized change in US core CPI – excluding food and energy prices – over the past 3-month (orange line) and 6-month (blue line) periods. As you can see, not only did the January inflation numbers come in hot, and accelerate from the prior monthly reading, but in absolute terms, the level of inflation remains elevated.
Just consider, over a trailing 6-month period, US core CPI rose at a roughly 3.59% annualized rate, while over the past 3 months it’s running +3.97%, almost double the Fed’s 2% inflation target.
Also, take a quick glance at my chart above and you can see an obvious shift from the pre-2020 to the post-2020 era. Before 2020, inflation was well-behaved with core CPI oscillating around 2% on both a 3- and 6-month annualized basis.
Since then, inflation soared starting in 2021 and reached a peak in 2022; however, despite some moderation over the past 18 months or so, it’s clear we’re in a higher range than pre-2020. Even worse, the January data suggests inflation may have reached a cyclical low late last year and we’re once again headed in the wrong direction.
Considering last week’s CPI (and PPI) inflation data, it shouldn’t come as a huge surprise the US yield curve has become even more inverted since mid-January and futures markets are pushing back the timing and pace of the Fed’s rate-cut cycle:
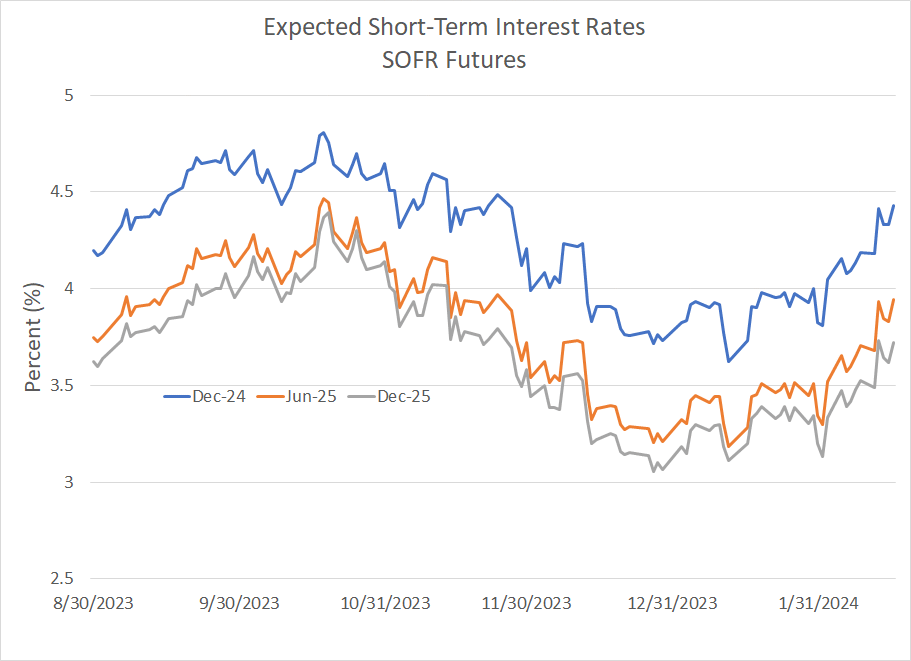
Source: Bloomberg
At the end of last year, the SOFR futures market expected the Fed to cut rates from the current target level of 5.25%-5.50% to around 3.73% by the end of this year, 3.21% by June 2025 and about 3.07% by the end of next year. Today, SOFR futures have added around 0.65% to 0.75% (65 to 75 basis points) to each of these time frames.
We’re still a long way from the peak of higher-for-longer rate expectations in mid-October of last year; however, the recent jump is notable and marks a significant shift in sentiment.
Implications for Stocks
The S&P 500 is within a few points of its all-time closing high, so last week’s hotter-than-expected inflation data and fading expectations for rate cuts have yet to have a durable impact on broader equity markets.
Instead, the bigger impacts to date have been to market breadth and, just as important, sector relative performance:
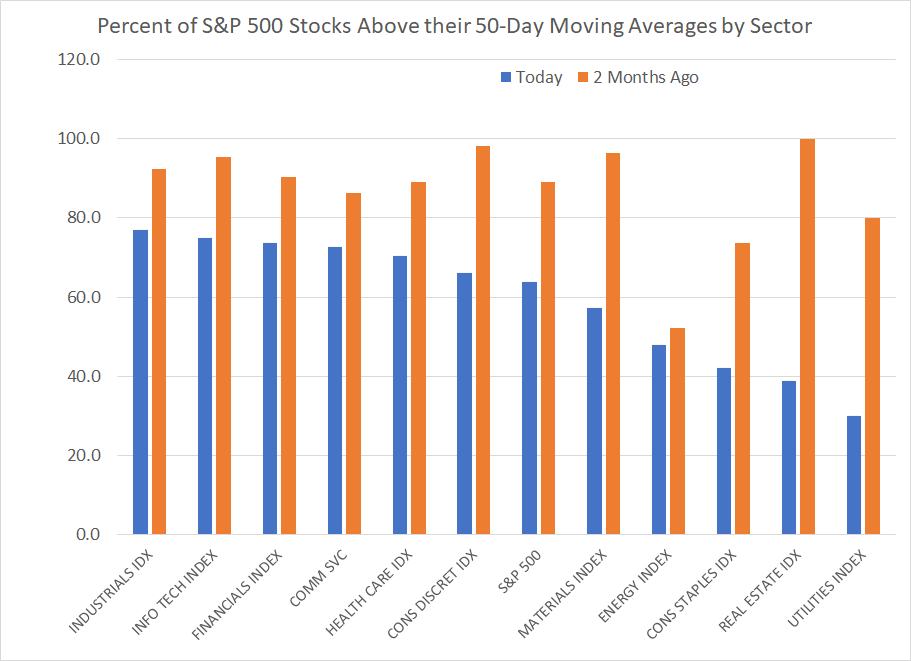
Source: Bloomberg
This chart includes data on the percentage of index members above their 50-day moving averages for the S&P 500 as a whole, as well as all 11 Economic Sector Indices in the S&P 500. The blue bars represent the current level while the orange bars represent the level from late December 2023, about two months ago.
Over this period, the S&P 500 is up about 6%, but there’s not a single sector index where breadth has improved on this basis.
For some groups like Consumer Discretionary, the deterioration has been dramatic. Two months ago, more than 98% of stocks in the S&P 500 Consumer Discretionary Index were trading above their 50-day moving averages (MAs) compared to 89% of stocks in the S&P 500. Today, only about 64% of stocks in the Consumer Discretionary Index are above their 50-day MAs.
While that’s not yet at a level that screams bear market, the trends are deteriorating:
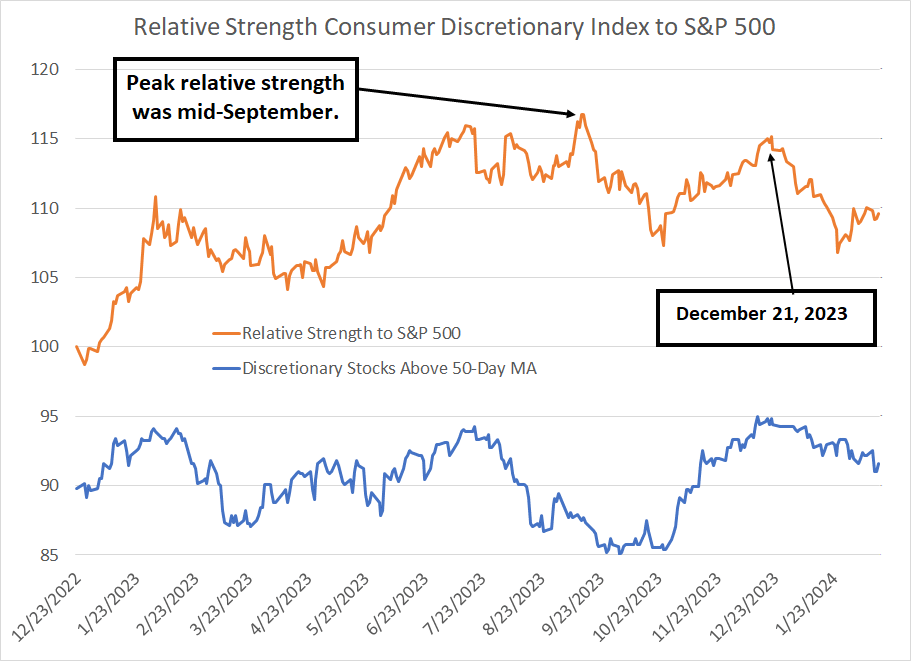
Source: Bloomberg
This is a trend that’s been underway for some time now. The orange line on this chart shows the relative strength of the S&P 500 Consumer Discretionary Sector to the S&P 500 since late 2022. Simply put, a rising line suggests outperformance while a falling line shows the opposite.
The blue line is simply the percentage of S&P 500 Consumer Discretionary Index stocks trading above their 50-day moving averages.
As you can see, peak relative strength for this index was in mid-September 2023; the broader market S&P 500 peaked at the end of July 2023 and fell about 3% through mid-September. Discretionary stocks were also lower, but the decline was well under 1%. In other words, discretionary stocks didn’t perform well, but they did outperform the S&P 500 over this period.
Consumer Discretionary stocks outperformed again coming off the October-November lows late last year as part of the market’s year-end ramp. However, relative strength peaked again in late December and has deteriorated significantly so far in 2024 as more and more stocks in the Consumer Discretionary sector index have slipped below their 50-day moving averages.
On the flip side of the coin, look at the S&P 500 Industrials:
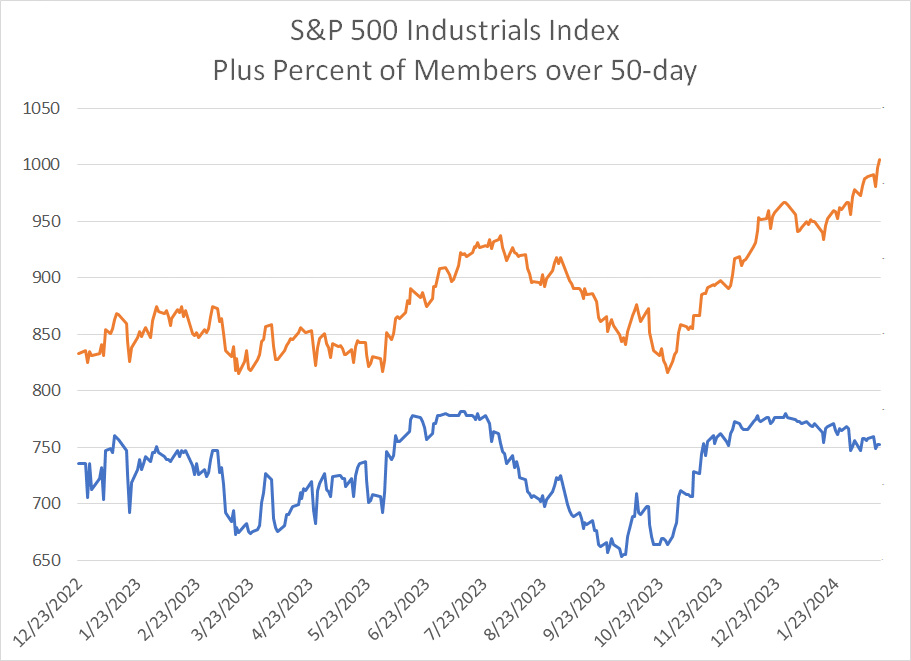
Source: Bloomberg
This chart shows the S&P 500 Industrials Index on top (orange line) and the percentage of index members above their 50-day moving averages.
What’s interesting is that while the S&P 500 Industrials Index is underperforming the market year-to-date – up 3.7% vs 4.7% so far in 2024 – the strength in industrials is far more broad-based with almost 77% of index members above their 50-day moving averages, a full 11 percentage points above the S&P 500 as a whole.
This is certainly a group to keep an eye on for buy ideas.
That brings me to tech:
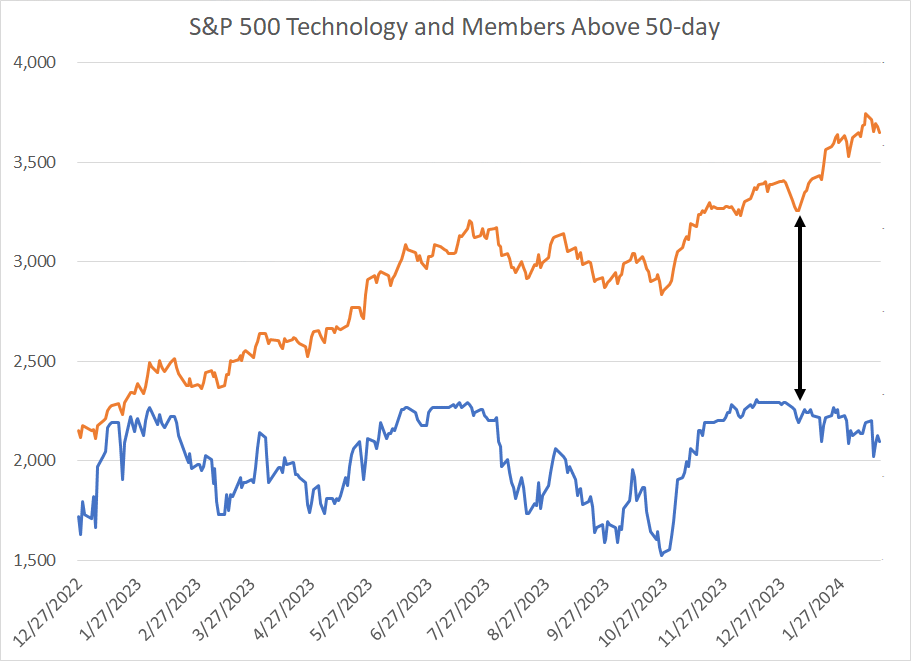
Source: Bloomberg
The S&P 500 Information Technology Index was up 7.6% through the close last Friday, making it the second best-performing index in the S&P 500 trailing only Communications Services.
And last year, tech ranked top, rising 57.8%, and more than double the S&P 500’s 26.3% total return.
However, while the S&P 500 IT Index has continued to rally this year, that strength is very narrow. January 4th marked the closing low for the index so far in 2024; on that date 85.9 percent of stocks in the index closed above their respective 50-day moving averages.
Today, even with the index almost 10% higher only around 67% of index members are still holding above their 50-day moving averages.
Meanwhile, I’m seeing signs of life in energy and other commodities:
Oil’s Curve
The International Energy Agency (IEA) declared in its February 2024 Oil Market Report: “The Expansive post-pandemic growth phase in global oil demand has largely run its course.”
The agency also predicted growth in production from non-OPEC countries like the US, Brazil and Guyana would more than eclipse growth in oil demand for the year, leading to loosening supply demand balances.
However, amid all the talk of a weakening oil supply/demand balance, there’s one small problem – oil markets are screaming the exact opposite:
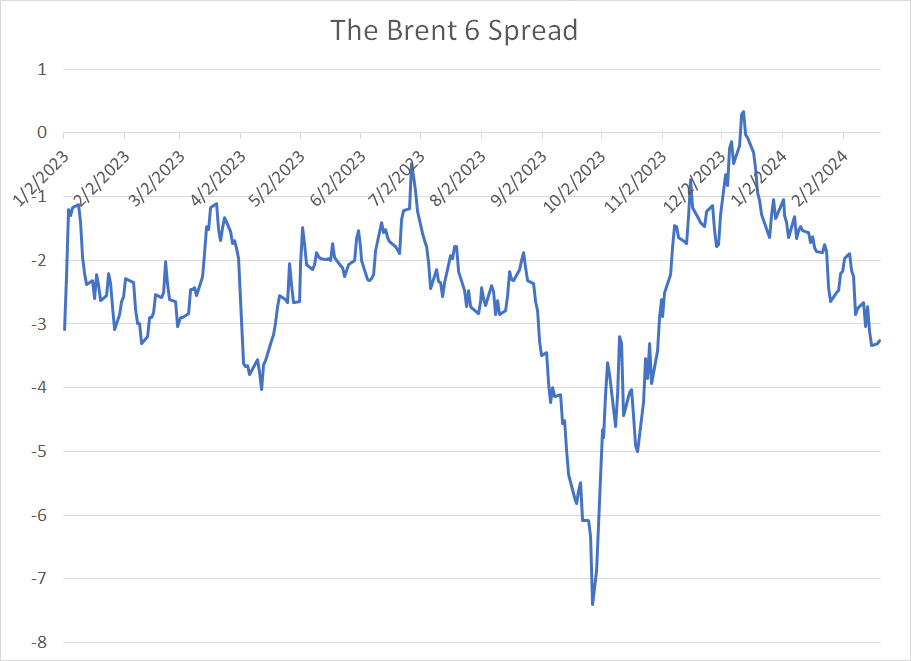
Source: Bloomberg
This chart shows what I call the “Brent 6” spread.
Simply put, it’s the price of Brent oil futures 8 months in the future – currently this is the November 2024 Brent oil futures – less the price of Brent for delivery in the second contract (May 2024).
So, if this spread is negative, it suggests the Brent oil curve is in a state known as “backwardation” – the price of oil for delivery in November 2024 is lower than the price of oil for delivery in May. Right now, the curve on this basis is in backwardation to the tune of over $3.50/bbl.
A simple rule of thumb is to remember that backwardation is bullish.
That’s because a negative spread on this basis is the market’s way of telling participants it needs more supply right now. Just consider that if the price of oil today is lower than the price of oil for delivery in 6 or 9 months’ time – a situation known as contango – that’s likely to encourage market participants to store more oil.
If you can store oil into a market in contango you can sell that crude at a higher price in future than what you could earn by selling it today. Indeed, this profit is risk-free as long as the cost of storage is less than the contango in the curve, because you can use the futures market to “lock in” that higher, future price.
Backwardation provides the opposite signal.
Just consider: Why store oil if the price for immediate delivery is higher than the price of oil for delivery in 6- or 9-months’ time?
Look at my chart above and you’ll see the Brent oil market did enter contango briefly on this basis in late December 2023. However, today, the backwardation in the curve is the steepest since last October.
Also note that last summer the Brent curve was near contango on this basis in early July and then slipped into backwardation of more than $3/bbl by early September:
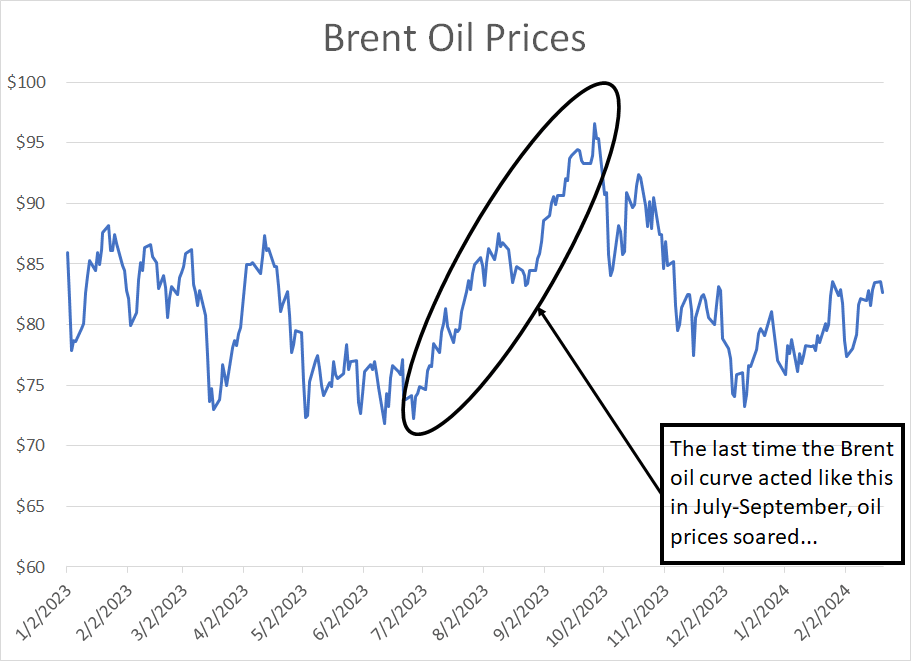
Source: Bloomberg
As you can see, the last time the Brent futures curve acted like this, prices soared from under $75/bbl to over $95/bbl.
DISCLAIMER: This article is not investment advice and represents the opinions of its author, Elliott Gue. The Free Market Speculator is NOT a securities broker/dealer or an investment advisor. You are responsible for your own investment decisions. All information contained in our newsletters and posts should be independently verified with the companies mentioned, and readers should always conduct their own research and due diligence and consider obtaining professional advice before making any investment decision.