


Inflation Isn't Dead
Plus: Adding to Basic Materials Exposure

Last week, in “Growth and Inflation Resurgent,” I wrote that country and sector trends suggested global markets are betting on solid economic growth and a resurgent inflation problem.
Of course, this week’s hotter-than-anticipated CPI release supports that view:

Source: Bloomberg, US Census Bureau
This chart shows the month-over-month sequential change in core CPI – that’s CPI excluding food and energy prices.
Typically, you’ll see CPI data reported to the nearest 1/10th of a percent in the financial media; I always look at the data out to at least 3 decimal places because the rounded figures can cover up all sorts of underlying issues. For example, a sequential reading of 0.255% and 0.324% both round to 0.3%; however, the former annualizes to 3.1%, and the latter 3.96%, which represents a material difference.
In this case, the unrounded sequential change in core CPI was 0.3584% compared to 0.3924% in January 2024. On an annualized basis, this represents core inflation of 4.81% in January and 4.39% in February, disturbing figures for a central bank that’s targeting a 2% inflation rate.
And just look at the trends in my column chart above. There was a gradual disinflation trend underway from the middle of 2022 through the middle of 2023, which I’ve labeled with a thick, black arrow. The unrounded sequential change in June of last year, for example, was 0.1947%, which annualized to 2.36%, not too far off the Fed’s target.
Since then, however, there’s been a gradual build in inflationary pressure --labeled with a red arrow on the chart -- with both January and February 2024 data well above consensus expectations on Wall Street ahead of the release.
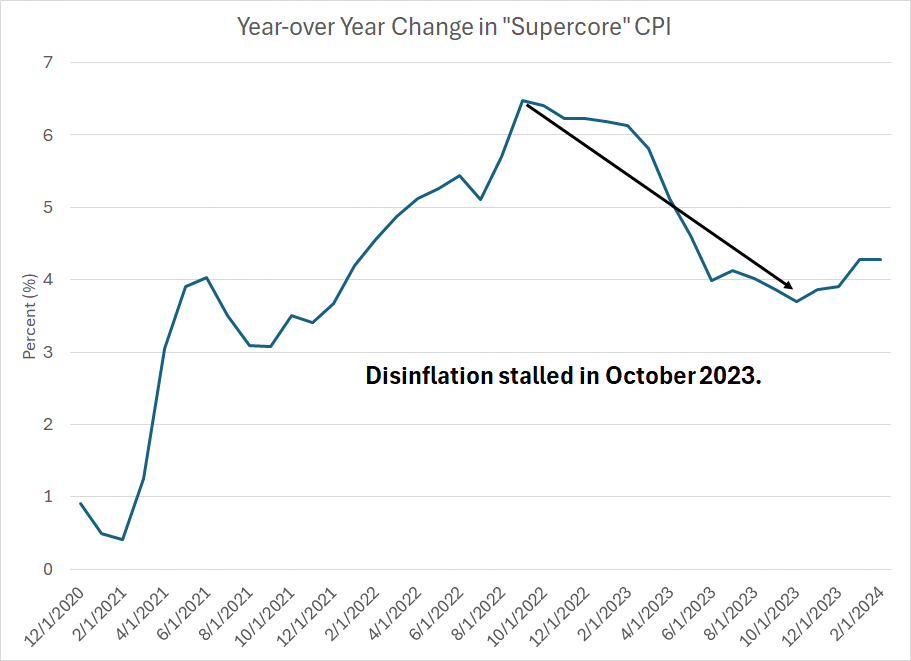
Unfortunately, economists’ favorite pastime of stripping out more inflationary components to derive an increasingly narrow gauge of prices didn’t yield much fruit last month:
Source: Bloomberg, US Census Bureau
This chart shows “Supercore” inflation, a metric known to be closely watched by Jerome Powell and the Fed. This metric only looks at core services – not goods inflation – less housing. However, even after narrowing CPI that much, there’s still an inflation problem because supercore CPI bottomed at 3.7% year-over-year last October and now stands at about 4.283%.
Of course, all this focuses attention on next week’s Fed meeting (Wednesday March 20th) when the central bank will update its Summary of Economic Projections (SEP), including the widely watched “dot plot.” The dot plot presents a chart consisting of “dots” which represent the rate expectations at the end of 2024, 2025, 2026 for each FOMC member. The dots aren’t labeled to identify the specific FOMC member making that forecast; the average and median rate expectations are widely watched.
The last dot plot forecast from the Fed was on December 13, 2023, and the median expectation was for three 25-basis-point rate cuts in 2024 – from the 5.375% midpoint of the year-end 2023 Fed Funds target rate to a midpoint of 4.625% at the end of this year, exactly 75 basis points worth of cuts.
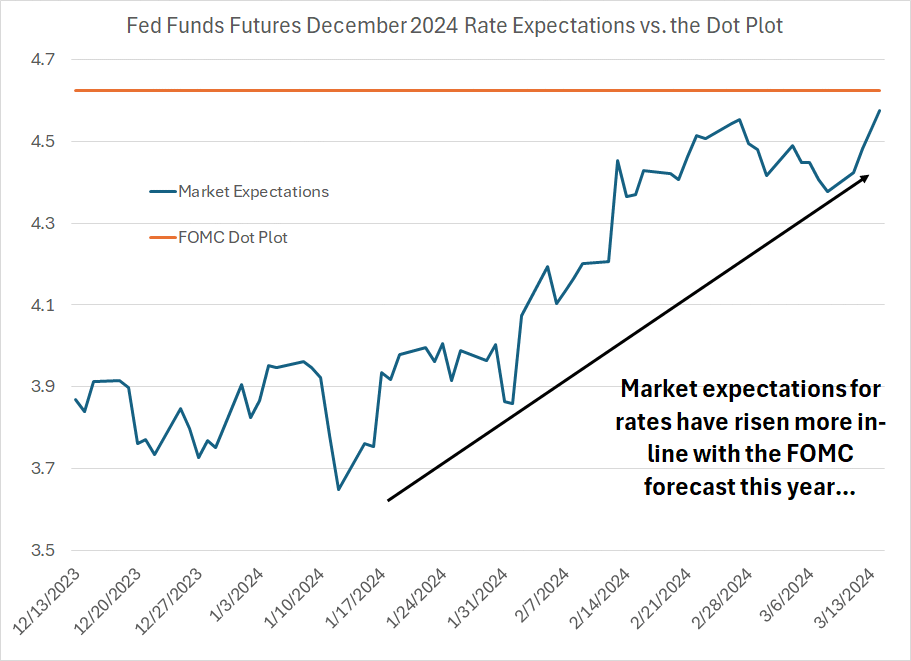
Look at the dot plot target for rates at the end of this year compared to expectations priced into the Fed Funds futures for December 2024:
Source: Bloomberg
I dated this chart back to December 13th, the day the FOMC last updated its dot plot. As you can see, market expectations were initially much lower than the Fed’s dot plot, projecting more cuts than the Fed. Indeed, at the lows in mid-January 2024, the market was looking for the central bank to deliver 175 basis points of cuts this year, taking the Fed Funds rate all the way down to 3.65%.
Since that time, catalyzed in part by the hot CPI numbers so far in 2024, market expectations have jumped close to in-line with the Fed’s dot plot targets; currently, the Fed Funds futures are pricing in rates at 4.568% at the end of this year, only slightly below the 4.625% median on the dot plot.
In light of hot inflation figures, speculation is now swirling the Fed may revise its dot plot next week, shifting the median expectations for cuts down to just 2 cuts (50 basis points) from 3 this year.
Regardless, I continue to believe the bigger issue for the Fed in 2024 will be the central bank’s balance sheet rather than the exact level of Fed Funds rates:

Source: Bloomberg, Federal Reserve
Late last year, I wrote about the strong historic correlation between the US stock market and the level of US bank reserves. That makes sense – reserves held by US banks underpin the entire credit system, so when reserves are plentiful that represents a tide of liquidity that can drive risk assets higher in price and support the economy.
The Fed has been attempting to drain reserves since 2022 – quantitative tightening (QT), at its heart, represents an effort to cool the economy by draining reserves inflated by the COVID lockdown quantitative easing boom of 2020-21. However, the Fed hasn’t been very successful in that effort, to put it mildly – as you can see in my chart above, US bank reserves are now at the highest levels since the spring of 2022, before the central bank even started QT.
Rising reserves are one likely driver of the strength we’ve seen in the stock market over the past 15 months or so since late 2022.
However, the main reason the Fed has been able to pursue QT without draining reserves is its Reverse Repo (RRP) facility, essentially a way for money market funds to “park” money at the central bank and earn a risk-free rate of interest on their balances. This honeypot of cash totaled $2.68 trillion less than a year ago in mid-April 2023 compared to $793.394 billion on March 6th, the most recent datapoint from the Fed.
Indeed, it’s even worse than it appears. There are two parts of the RRP, one for foreign central banks and official accounts and one for the domestic US market. The foreign official RRP is pretty stable by comparison – on March 6, 2024 that portion of the RRP stood at $336.6 billion, down only about $22 billion over the past year. The domestic RRP – the part of the facility used by money market funds – now holds $456.9 billion, down more than $1.7 trillion over the past year alone.
Money market funds are withdrawing from RRP to buy Treasury Bills because T-Bills offer a higher rate of interest. Once that domestic portion of the RRP is exhausted, it will become more difficult for the US government to borrow money to fund the yawning US deficit without having an impact on bank reserves and, by extension, the market and the economy.
The Fed’s QT process only makes this situation worse, putting additional strain on public markets and exacerbating the vicious cycle of government borrowing and falling reserves. The big risk remains that once RRP is exhausted Fed policy starts to “bite,” and bank reserves begin a sudden decline. This limits the Fed’s maneuvering room to tighten policy by continuing QT or failing to cut rates even if inflation remains elevated.
For now, liquidity remains ample, the economy looks solid and, shorter term pullbacks and corrections aside, risk assets can continue their ascent. However, I’ll be keeping an eye on the Fed’s balance sheet — the environment could change suddenly as RRP is exhausted, likely by summer.
Meanwhile, I continue to see sector-to-sector rotation in markets consistent with accelerating inflationary pressures. This issue I’m recommending a new addition to the model portfolio, a stock from the Basic Materials sector of the S&P 500.
And there’s an additional catalyst for this new recommendation — it’s a similar story to a successful model portfolio recommendation made in the paid tier to FMS last year, CRH (NYSE: CRH). Simply put, my latest new recommendation, a US company, is being acquired by a well-managed, market-leading, Ireland-based competitor.
As part of the deal, the company will be switching it’s primary listing to the New York Stock Exchange (NYSE), a move that should help it close a significant valuation gap to its US-based peers, just as it did for CRH last year.
Keep reading with a 7-day free trial
Subscribe to The Free Market Speculator to keep reading this post and get 7 days of free access to the full post archives.