

Inflation, Recession and Corporate Profits
Inflation, Recession and Corporate Profits
Sticky prices and market realities

Let’s start with the bright side of yesterday’s CPI inflation report: Headline CPI rose 0.1% month-over-month compared to expectations for a 0.2% rise and a 0.4% increase for February.
And, while it’s customary to round month-over-month and year-over-year data to the nearest tenth of a percent, it’s worth watching the unrounded data as well.
In this case, the headline CPI for March increased by just 0.053% month-over-month, which is significantly softer than the rounded 0.1%.
The government reported core inflation – CPI excluding food and energy prices – rising 0.4% in March, matching Wall Street expectations for a 0.4% gain. The unrounded number was actually 0.385%, so that’s also (slightly) better than expectations.
And before you accuse me of grasping at straws, just consider an unrounded sequential gain of 0.37% and 0.42% would both be reported as a 0.4% monthly gain. However, the former annualizes to a 4.5% pace of inflation while the latter annualizes to 5.2%, a meaningful difference.
Markets initially took comfort in this in-line to slightly softer-than expected interpretation of the inflation print. As of Tuesday’s close, the Fed Funds futures market reflected expectations for a rate of about 4.19% at the time of the Fed’s January 31, 2024 meeting compared to a target rate of 5% currently.
Roughly 15 minutes following the CPI release, Fed funds futures penciled in just a 4.04% Fed Funds rate for the end of January next year, a drop of around 15 basis points.
Equity futures jumped in the minutes after the release, led by the tech-dominated Nasdaq 100, a continuation of the narrative that a Fed “pivot” on rates is bullish for technology and growth stocks.
However, that’s about the extent of the good news on CPI; as markets took time to digest the numbers, the knee-jerk market reaction reversed course. By the close on Wednesday, the probability of a May 2023 hike from the Fed was essentially unchanged from the prior session at 71.4% and equities had weakened, led to the downside by the same tech and growth stocks that dominated the pop higher following the CPI release.
There are two components to this bearish intraday shift in the market mood following CPI.
Inflation Remains Uncomfortably High
One of the more pernicious aspects of the surge in inflation over the past two years has been just how widespread price increases have been.
Outsized moves in a handful of inflation components can skew the overall picture, so I like to monitor some adjusted CPI metrics that help filter these distortions:
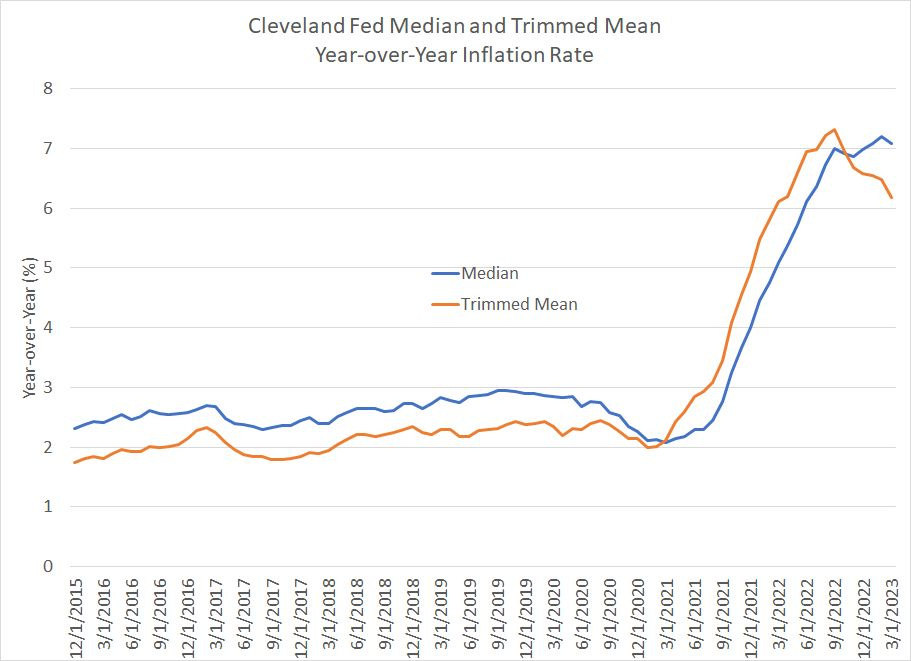
Source: Bloomberg, Federal Reserve Bank of Cleveland
This chart shows two alternate measures of CPI published by the Federal Reserve Bank of Cleveland. The blue line represents the median CPI component, the year-over-year change in price for the index ranked in the middle of all components within CPI.
The orange line is the trimmed mean, representing year-over-year change in CPI after removing the largest contributors to inflation on both the upside and the downside.
Yes, as you can see, both measures are off their cycle peaks, but the declines have been modest to date and they’re both showing year-over-year price inflation well north of 6%, roughly triple the Fed’s target. Indeed, the median measure hit a fresh cycle high just last month of 7.2%, falling to just under 7.1% year-over-year in March.
And then there’s so-called “Supercore” inflation:

Source: Bloomberg
Supercore inflation is services inflation excluding energy services, rent of primary residences and owner’s equivalent rent.
I’m not a huge fan of adjusting inflation data to exclude a long list of components; after all, if you adjust CPI enough, and remove enough components that are actually rising in price, you can often manipulate the data lower to paint a rosier picture.
However, Jerome Powell is known to follow measures like supercore inflation closely and, in this case, inflation is so pervasive this measure also remains elevated at 5.82% year-over-year and 0.40% month-over-month which annualizes to about 4.9%.
While some components of supercore inflation – medical care is one example -- have moderated this year, we’re seeing strong gains in other components like transportation. In particular, the year-over-year jump in CPI for motor vehicle maintenance and repair, motor vehicle insurance and airline fares are up 13.3%, 15.0% and 17.7% respectively.
One final look:

Source: Bloomberg, Federal Reserve Bank of San Francisco
This chart is based on the Personal Consumption Expenditures (PCE) inflation data not CPI, so it’s only updated through February,
This chart breaks down the year-over-year change in core PCE into two pieces, the acyclical component which jumped 1.83% and the cyclical, which was up 2.92% (the sum of these two components would be about 4.75% year-over-year).
The Federal Reserve Bank of San Francisco explains its methodology for dividing individual PCE components into acyclical and cyclical baskets here. Simply put, the idea is the Fed has more control over cyclical inflation because these are the PCE components that have historically tended to be more sensitive to economic conditions and tightness in the US labor market.
Acyclical components are those where the Fed has less influence.
What’s interesting in the chart above is that it’s acyclical components that have driven the recent moderation in inflation, not cyclical components.
That means it’s factors the Fed does NOT control that are driving the recent (modest) disinflation, not so much the Fed’s aggressive tightening campaign.
One likely reason for this is that Fed policy acts with a long and variable lag, meaning it takes time for rate hikes and quantitative tightening to slow economic growth and the lags in policy traction aren’t stable or predictable over different cycles. The Fed only started tightening a little over a year ago in March 2022, so it’s possible – even likely – we’re only now seeing the economic fallout from hikes the central bank made last spring and early in the summer.
Bottom line: Despite the 0.1% miss on headline CPI, inflation looks sticky high in the US right now and it’s likely we’ll need to see significant additional slowing in the US economy, and a weakening labor market, before cyclical inflation components moderate.
And, let’s not forget it’s falling energy prices that have driven the recent moderation in headline CPI while the core has remained elevated. As I’ve written previously, oil prices have come down over the past several months for two main reasons.
First, there’s concern faltering economic growth will moderate oil demand later this year. And, second as I explained in “The Great SPR Scam,” the Biden Administration’s 251.73 million barrels of releases from the US Strategic Petroleum Reserve (SPR) – as much as 1.5 million bbl/day last year – helped prop up US crude inventories through much of 2022 even as the supply/demand balance tightened.
However, historically, oil demand only sees a temporary and modest impact from recessions and bounces back quickly as the economy recovers. In this cycle, Chinese economic reopening may even offset significant declines in demand from the US and Europe amid a global economic slowdown this year.
Meanwhile, the supply picture remains tight. OPEC’s recent decision to further cut production helped put a floor under crude near recent lows while SPR inventories have bene drawn to 40-year lows, so the scope for additional releases this year to curtail price increases is minimal.
The history of the 1970s suggests ultimately oil (and natural gas) prices will only sustainably fall after a multi-year increase in capital spending from energy firms that results in development of new oil and gas supply. To date, that just hasn’t happened, so there’s scope for headline inflation to reaccelerate alongside sticky-high core inflation into the second half of the year.
The second factor to consider is this:
The Rally’s Feeble Foundations Meet Reality
Year-to-date the S&P 500 is up more than 7%; however, those gains have been far from even with the Equal-Weight S&P – a version of the Index that weights all components the same rather than by market capitalization –up less than half as much at 2.6%.
Take a look:
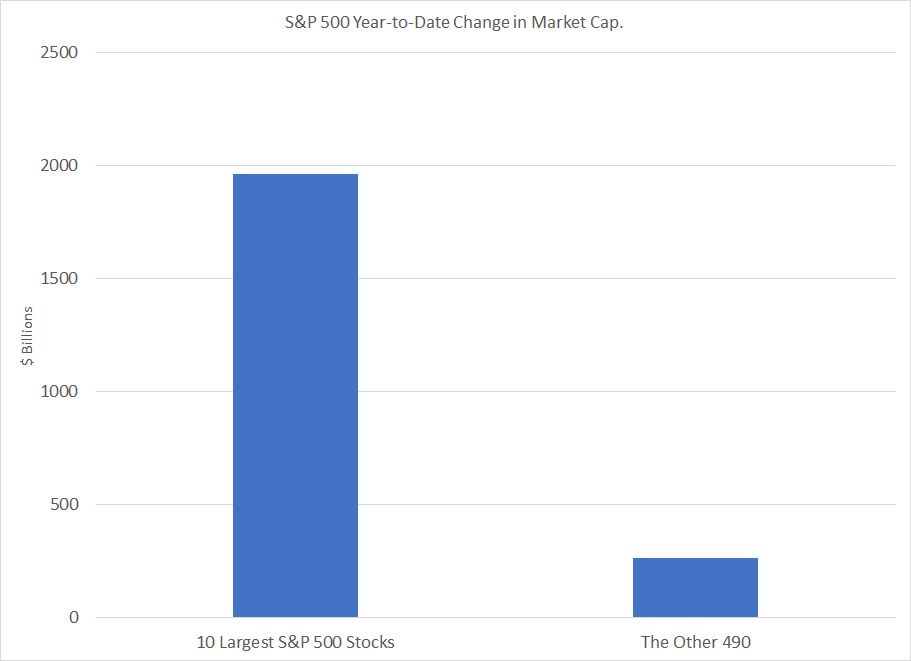
Source: Bloomberg
The combined market capitalization of the 10 largest stocks in the S&P 500 is up by more than $1.96 trillion so far in 2023 compared to just $264 billion for the remaining stocks in the index.
The 3 largest names – Apple (NSDQ: AAPL), Microsoft (NSDQ: MSFT) and Alphabet (NSDQ: GOOG) – have enjoyed a combined increase in market value of almost $1 trillion so far this year.
The S&P 500 is dominated by tech (25.5% of the index by weight) and growth stocks. These behemoths have enjoyed the biggest gains mainly due to optimism surrounding the potential for a Fed pivot on rates.
However, I suspect the market is beginning to worry about this:
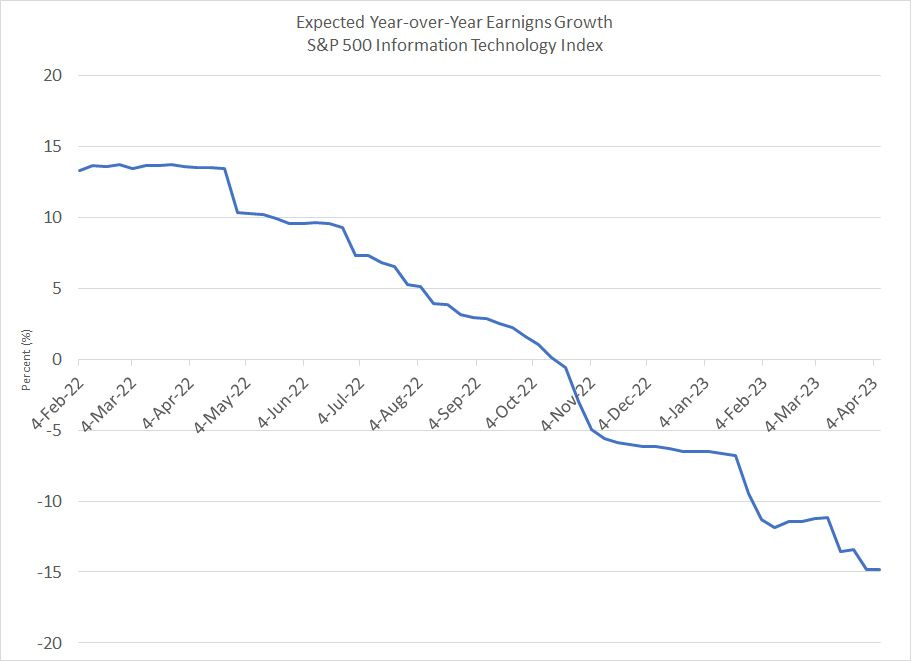
Source: Bloomberg
This chart shows the evolution of expected year-over-year earnings growth for Tech stocks in Q1 2023, the quarter just ended.
Not only is Q1 2023 expected to be the worst quarter for technology in terms of earnings growth for well over a decade, but tech stocks have been rallying this year in the face of significant downside revisions to quarterly earnings growth expectations.
With earnings for most of the big tech names due out over the next (roughly) 3 weeks, there’s growing risk the realities of slowing economic growth, looming recession and falling earnings could derail the tech-led rally that’s dominated 2023 so far.
If you enjoyed today’s issue, consider liking the post by tapping the heart-shaped icon.
DISCLAIMER: This article is not investment advice and represents the opinions of its author, Elliott Gue. The Free Market Speculator is NOT a securities broker/dealer or an investment advisor. You are responsible for your own investment decisions. All information contained in our newsletters and posts should be independently verified with the companies mentioned, and readers should always conduct their own research and due diligence and consider obtaining professional advice before making any investment decision.