

It's a Bull's World
It's a Bull's World
Well, usually it is, for equities anyway...

Today you can buy a bushel of corn for delivery in September at a price of about $5.25 per bushel.
In October 1974 the same bushel of corn cost about $3.64 per bushel.
However, these prices aren’t adjusted for inflation. That $3.64 in October 1974 has the same purchasing power as $21.73 today, so in real terms, corn is almost 76% cheaper today than it was 49 years ago in the mid-1970s.
Equities are an entirely different animal. If you bought the S&P 500 at the end of October 1974, reinvesting your dividends ever since, your return as of today would be 24,226% -- even adjusting for the steady erosion in the purchasing power of the US dollar in the intervening years, that’s an impressive profit.
Simply put, unlike most commodities, stocks trend, and have an upward drift over time. For equities, it’s a bull’s world.
Of course, there have been some terrible stretches for the US stock market over the past century – the Great Depression of the 1930s, the vicious 1973-75 recession and ensuing Great Inflation period, the 1987 Crash, and the 2007-09 Great Recession and financial crisis to name just a few. However, far more often than not, the S&P 500 has been in a bull market – true bear markets are not common.
Bloomberg provides closing price data for the Dow Jones Industrial Index since May 1896, and I took a look at rolling returns for the index excluding dividends since that time. If you selected a random month over that period to buy the Dow Industrials the probability of making money over a 1-year holding period was 65.9%, over 5 years it’s 77%, over 10 years it’s 84.9% and over 20 it’s 95.4%.
I like those odds – one would have to be a little crazy to bet the S&P 500 won’t be trading at a higher price on August 1, 2033 than it is right now.
Look at this:
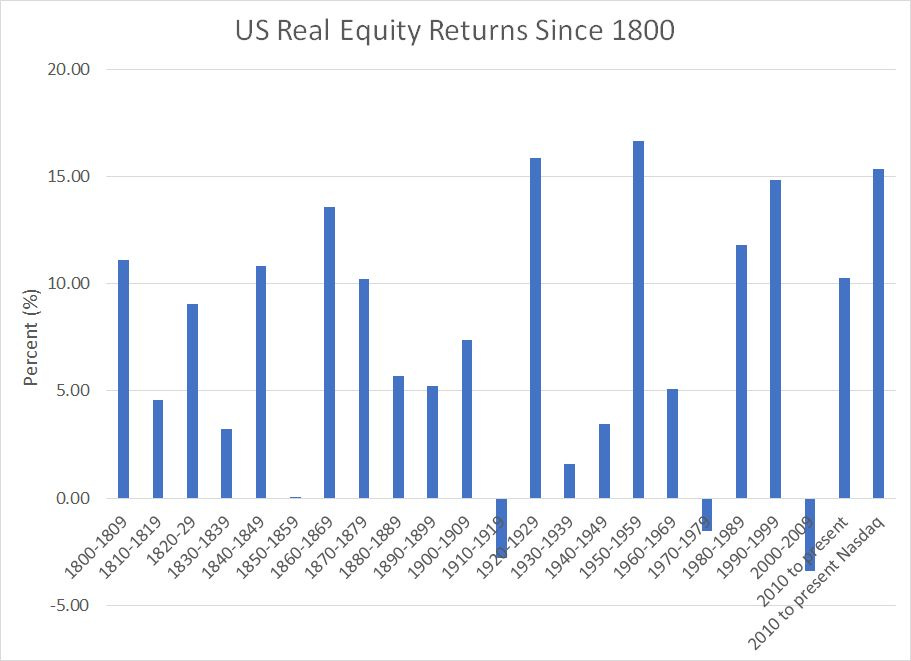
Source: Deutsche Bank, Bloomberg
This chart presents real (inflation-adjusted) annualized returns from the US stock market by decade since 1800 as reported in a long-term asset return study from Deutsche Bank. I calculated the returns for the S&P 500 and Nasdaq 100 since the end of 2009, adjusting for inflation using headline CPI.
As you can see, the S&P 500’s 10%+ real return since the end of 2009 is solid and the Nasdaq 100’s 15%+ annualized return over a similar time frame is stellar by almost any historic yardstick.
However, you’ll also notice that, even amid a general upward drift in stocks over the past 223 years, there have been periods of subpar returns – 1929-1939 of course, but also 1969-79 and 1999-2009.
And even during these decades, the bulls weren’t totally vanquished. While equity returns were poor, there were still powerful rallies and economic expansions – dramatic bull markets and “melt-ups” just as we’ve seen since last autumn – in the context of the broader bear phase.
For example, between May 26, 1970 and January 11, 1973, the S&P 500 rallied 89%, reaching fresh all-time highs:
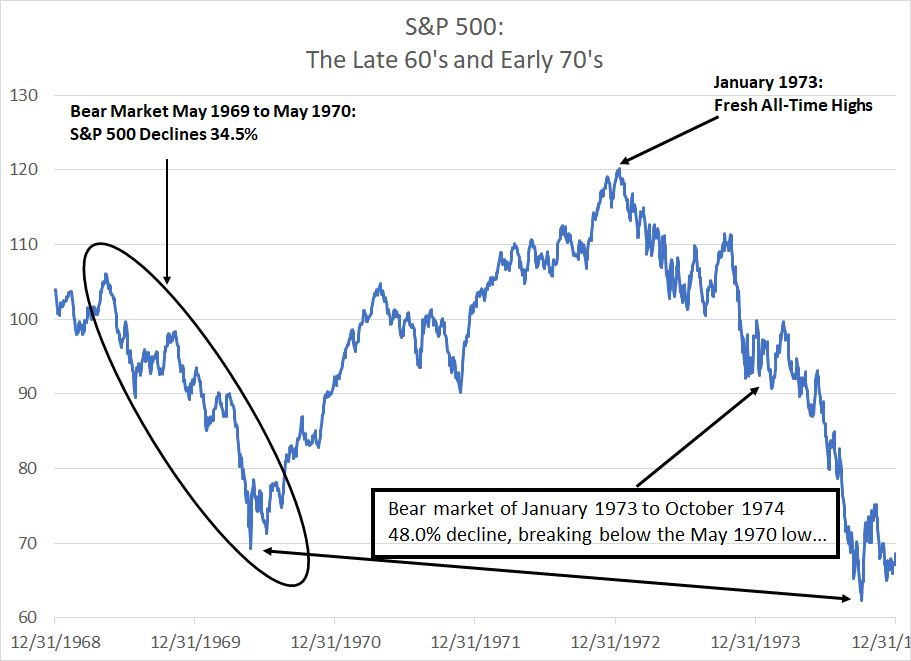
Source: Bloomberg
Adjusting for inflation, that 1970-73 advance represented a whopping 23.5% annualized real return. However, as you can see in my chart above, this advance represented a recovery from the 1969-70 bear market and ended with an even more severe bear phase in 1974-74 that saw the S&P 500 break below its 1970 lows.
The second half of the decade was also pretty solid for the S&P 500. From October 3, 1974 through November 28, 1980 the S&P 500 rallied 204.3%; even adjusted for that era’s sky-high inflation, that’s almost an 11% annualized real return from the stock market.
And that brings me to this:
Money Illusion
My point is the bulls still held sway most of the time through the 1970s on a nominal basis though the total return from holding stocks was negative in real terms over the long haul:
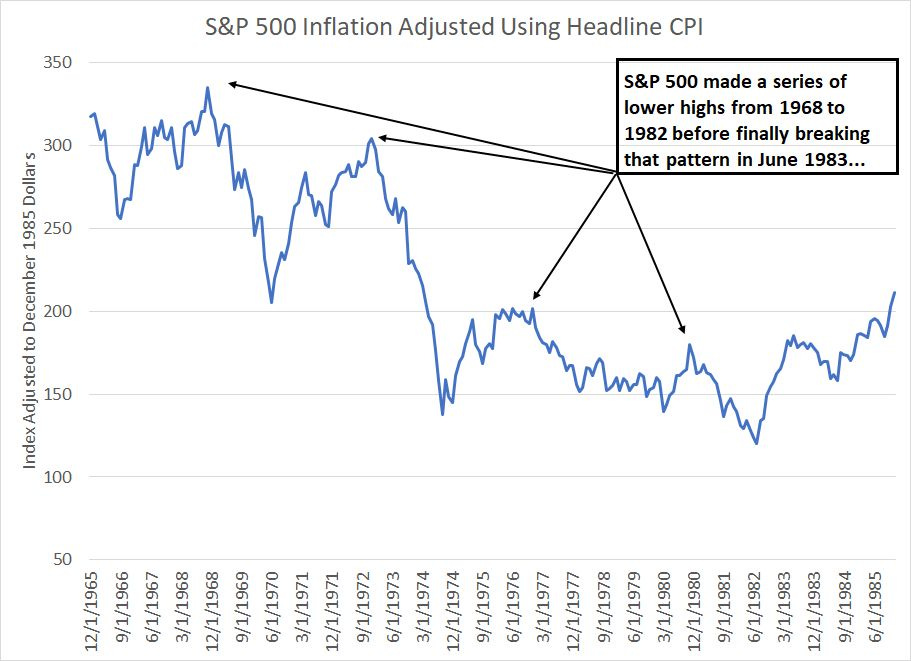
Source: Bloomberg
To create this chart I simply adjusted raw monthly closing data on the S&P 500 from December 1965 through December 1985 for inflation. Specifically, I’m plotting a chart of the S&P 500 priced in December 1985 dollars.
As you can see, in real terms, the S&P 500 made a series of lower highs and lower lows from 1968 until 1982 before finally breaking the pattern in June 1983. Those bull markets in 1970-1973 and 1974-79 just don’t look particularly impressive in real terms
Small wonder the August 13, 1979 issue of BusinessWeek ran an article titled “The Death of Equities: How Inflation is Destroying the Stock Market.”
There’s a well-known concept in economics called “money illusion,” which refers to the human tendency to view their wealth and income in nominal terms rather than adjusted for inflation. As you might expect, money illusion is more pronounced for consumers with limited personal experience with inflation such as Americans in the mid-1960s or anyone who came of age over the low-inflation period of the past two decades.
Take a look at this:

Source: Bloomberg
This chart shows the path of the S&P 500 from August 2020 through June 2023 adjusted for inflation and expressed in June 2023 dollar terms. As you can see, the dramatic rally in the S&P 500 in the first half of 2023 looks less impressive in real terms than on a nominal chart.
Also in real terms, the index was still down almost 14% from its real monthly closing high around 5,155 in December 2021 through the end of June this year.
Unfortunately, I believe we could be experiencing a repeat of that late 1960s to early 1980s experience.
While inflation might appear vanquished from time to time, it’s likely only a period of hibernation; after all, how long do you think it will take for American motorists to notice the price of a gallon of regular unleaded gasoline is up 6.7% since July 6th alone to the highest levels in 9 months?
And while equities can see dramatic rallies in nominal terms —perhaps even breaking to fresh all time highs as they did in 1973 — it’s quite plausible, especially in light of the market’s sky-high valuation today, longer-term real returns from the stock market could be sub-par, even negative.
I also continue to believe that October 2022 low for the S&P 500 — on both a nominal and real basis — may not hold in the next bear phase, much like the October ‘74 bottom represented a lower low compared to May 1970.
Surviving the 20’s
One way to flourish in the 1970s was to pay attention to the short term trends — even amid a sub-par period for real equity market returns, the bulls can hold sway for long stretches and those rallies can be dramatic and profitable.
Indeed, you can say the same thing about the 1930’s. The decade was defined by the economic devastation of the Great Depression; yet, the S&P 500 still managed a 323.36% return from mid-1932 to early 1937, a gain of more than 36% annualized over as period of nearly 5 years.
And there was very little inflation over this time– based on CPI, the value of $100 in mid-1932 was about the same as $103.68 by early 1937, so the real return here was still impressive.
Factors like trends, technicals and market sentiment dominate short-term market direction. And in that regard, as has been the case for weeks now, the outlook for the US stock market remains positive:
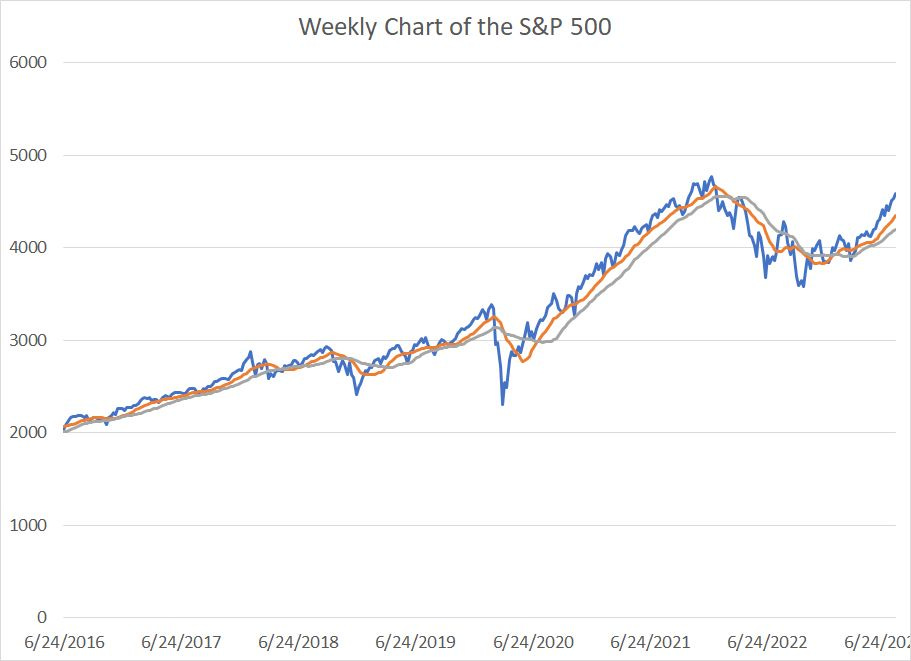
Source: Bloomberg
One of the simplest “indicators” I watch is the 13-week and 26-week moving averages for the S&P 500 represented by the grey and orange lines on this chart respectively. In a 52-week year, 13 weeks represents one quarter of trading and 26 weeks represents two quarters (a half year).
When the 13-week moving average is above the 26-week moving average, returns from holding stocks is far higher than when it’s below. That was even true back in the 1970s – the average return from the S&P 500 during bull markets on this basis was more than three times higher than amid bear markets within that decade.
This doesn’t change the longer-term outlook.
One feature shared by the worst decades for equity markets in the past century – the 30’s, 70’s and 2000’s – was that the S&P 500 began the decade at elevated valuations. As I’ve explained in prior issues, market valuations have almost no correlation to returns for the S&P 500 over periods from 1 to 3 years; however, over holding periods of 5 to 10 years, the negative correlation between valuations and subsequent returns is among the strongest you’ll find in financial markets.
Meanwhile, while markets continue to celebrate the Fed’s ability to “lick” inflation this cycle, it’s worth remembering that the year-over-year core rate of inflation last month was +4.8% compared to the Fed’s 2% target. And that year-over-year rate of inflation compared prices in June 2023 to June 2022, the latter a month where the year-over-year rate of core inflation was almost +6%.
I also remain suspicious of the health of the US economy. The main positives I see are that consumer spending and the labor market remain reasonably strong; however, you could have said the same thing in March 2000 and January 2007. The unemployment rate, retail sales and GDP growth are all lagging indicators that tend to look best in the 3 to 6 months before the economy slips into recession.
And sure, it’s certainly possible that, for the first time since World War II, the deeply inverted yield curve is not a harbinger of recession ahead. However, I tend to think this time really isn’t different; rather, just as in 2006, it’s not the initial inversion you have to worry about, but when the yield curve re-steepens after a prolonged inversion, look out below.
In the Free Market Speculator model portfolio I continue to find pockets of relative strength to buy in the current economic and market cycle. We’ll continue to enjoy the bull markets where we find them.
However, I continue to remain cautious about the bigger picture; the experience of the 1930’s, 1970’s and the 2000’s (strongly) suggests the current rally could merely be a cyclical bull within the context of a longer-term period of sub-par returns.
DISCLAIMER: This article is not investment advice and represents the opinions of its author, Elliott Gue. The Free Market Speculator is NOT a securities broker/dealer or an investment advisor. You are responsible for your own investment decisions. All information contained in our newsletters and posts should be independently verified with the companies mentioned, and readers should always conduct their own research and due diligence and consider obtaining professional advice before making any investment decision.