

It's All About Positioning
It's All About Positioning
Lower lows likely this fall, but be careful

Fundamentally, I remain bearish on the broader market into the autumn months and believe the rally from the June 16th lows will ultimately prove a bear market rally and a “bull trap.”
I’ve posted extensively about the issues facing the US economy right now, Fed policy and the likelihood of recession both here in the Free Market Speculator as well as in my subscription-based publication, Creating Wealth.
However. I’ve received a few questions from readers asking why I’m not getting more aggressive positioning for what I believe could be one of the worst market sell-offs since the 2007-09 era.
Whenever I see questions like this or consider getting aggressive in a trade, I’m reminded of an old saw:
There are old traders and there are bold traders, but there are no old, bold traders.
In other words, getting too aggressive or anticipatory about the financial markets is a well-worn path to the poorhouse and on Wall Street being early is the same thing as being wrong.
I’ve personally watched investors and traders who were dead right about the tech bubble bust of the early 2000s and the real estate and credit crisis of 2007-09, who never fully benefited from their prescience because it took longer, far longer, for the markets to turn than they’d anticipated.
And if there’s anything worse than being wrong, it’s being right AND losing money.
Two points give me pause regarding the short-term market direction.
First, on Wednesday August 10th – the day of the benign CPI inflation numbers – 92.3% of volume traded on the NYSE was in stocks advancing in prices. That’s what’s called a 90% upside day and it’s a strong technical signal of underlying market strength and solid breadth.
There’s no such thing as an infallible technical signal and 90% upside days don’t always work; however, I’ve learned not to bet against this signal on a short-term basis. Thus, until we get a 90% downside day – a day of extreme negative breadth indicating heavy selling – the short-term bias for this market is still on the upside.
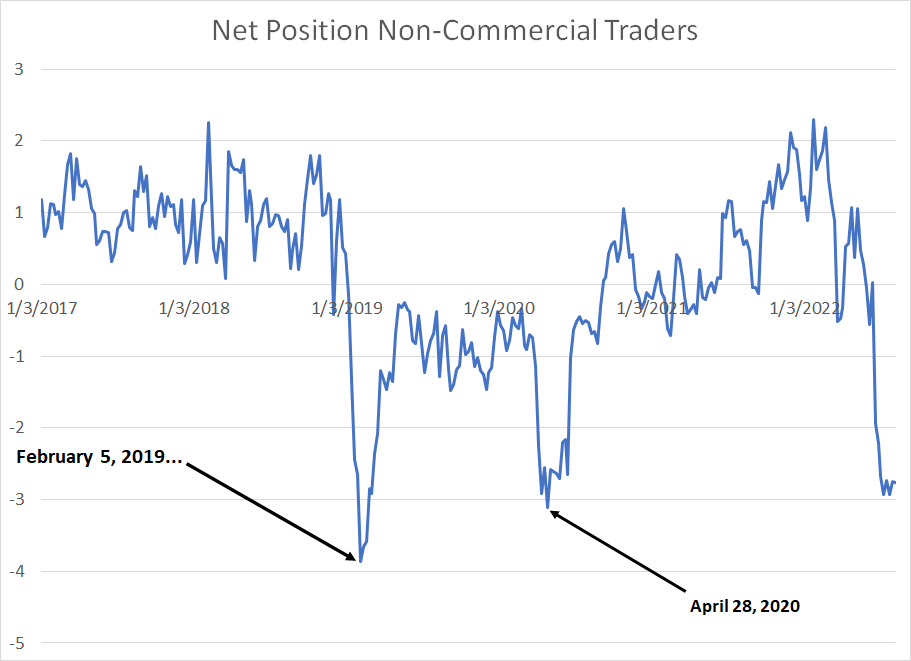
Second, take a look:
Source: Bloomberg
This chart shows the net market position of non-commercial traders in the S&P futures market. The data comes from the Commodity Futures Trading Commission (CFTC) Weekly Commitment of Traders Report, which is released every Friday afternoon and covers positioning through the prior Tuesday.
In other words, the latest report was released on August 12th based on futures market positioning through Tuesday August 9th.
Non-commercial traders are generally speculators, using the S&P futures to make a trade based on market direction rather than using the futures as a simple hedging tool.
Rather than presenting the data in its “raw” form, it’s presented as a z-score. Simply put, a z-score shows the non-commercial net position in the S&P 500 in terms of standard deviations above or below the 2-year average position.
Put simply, a positive reading would indicate that futures market speculators are currently more bullish than history (over 104 weeks) – the higher the reading, the more bullish speculators are. The opposite is true of a large negative number – low readings on this indicator suggest that speculators are bearish on the S&P 500.
I use this data series as a contrarian indicator.
A second Wall Street saying to keep in mind is that markets will move in a way that frustrates the greatest number of investors as often as possible.
In other words, when speculators get very bearish on the market, the S&P 500 is often set-up for at least a short to intermediate term rally.
Well, as you can see from the chart above, the current net non-commercial position in the S&P 500 futures market (based on data through August 9th) is almost 3 standard deviations below the 2-year average level (104-week average).
Since 2016, there have been only two other occasions where the net non-commercial position has been this low on this basis – early February 2019 and late April 2020. On both occasions, the stock market was coming off a major low and poised for significant additional upside.
It’s crucial to remember that not all bullish signals like this mark major market lows like 2018-19 and 2020. Sometimes, excess bearish market positioning just gives rise to a bear market rally or minor advance.
However, it’s tough for the market to see a major new leg lower with speculators this bearish on the stock market.
Now, as I said, this chart only covers data through the 9th of August and futures market positioning can change on a proverbial dime – it’s possible futures market speculators covered their shorts following the August 10th CPI report and we’ll see a very different picture when updated data is released this Friday covering positioning through the close on August 16th (yesterday).
However, with speculators so poorly positioned for additional market upside, I’m reluctant to recommend a larger position in inverse ETFs that would benefit from additional market downside.
DISCLAIMER: This article is not investment advice and represents the opinions of its author, Elliott Gue. The Free Market Speculator is NOT a securities broker/dealer or an investment advisor. You are responsible for your own investment decisions. All information contained in our newsletters and posts should be independently verified with the companies mentioned, and readers should always conduct their own research and due diligence and consider obtaining professional advice before making any investment decision.