

It's Getting Late
It's Getting Late
The ongoing transition to a cyclical, inflationary market

On July 19th, Goldman Sachs lowered its estimated probability of a recession over the coming year to just 20%.
About two weeks later, Bank of America reversed its forecast for a US recession with the bank’s economists now seeing soft landing as the most likely outcome.
And late last week, economists at JP Morgan Chase ditched their 2023 recession prediction, calling for continued growth this year and “modest, sub-par growth in 2024.”
At Fed Chair Jerome Powell’s press conference on July 26th, one comment during the Q&A session caught my eye.
Question: A good part of Wall Street has become more confident that the Fed is going to be able to engineer a soft landing and they've reduced their forecast for recession. And I'm wondering if the staff has changed its view on the likelihood of recession being likely and if you personally have changed your view in terms of becoming more confident that you can achieve a soft landing.
Answer, Jerome Powell: So, it has been my view consistently, that we do have a shot, and my base case is that we will be able to achieve inflation moving back down to our target without the kind of really significant downturn that results in high levels of job losses that we've seen in some past instances, many past instances of tightening that look like ours. That's been my view, that's still my view. And I think you know, that's sort of consistent with what I see today. So, but it's a long way from assured and you know, we have a lot left to go to see that happen. So, the staff now has a noticeable slowdown in growth starting later this year in the forecast, but given the resilience of the economy recently, they are no longer forecasting a recession. It's, I just want to note that it's, that our staff produces its own forecast which is independent of the forecast that we as FOMC participants produce, having an independent staff forecast as well as the individual participant forecast is really a strength of our process. There's just a lot of, I think, constructive diversity of opinion that helps us make, help informs our deliberations, helps us make I hope better decisions.
Source: Federal Reserve, Transcript of July 26, 2023 Press Conference
Simply put, it seems staff economists at the Federal Reserve, a group that had been forecasting a mild economic downturn amid the central bank’s aggressive rate hike campaign, have now jumped on the Goldilocks train, looking for a soft landing as inflation gently (and painlessly) glides back to the Fed’s target.
It’s also clear individual investors have embraced the broader market rally:
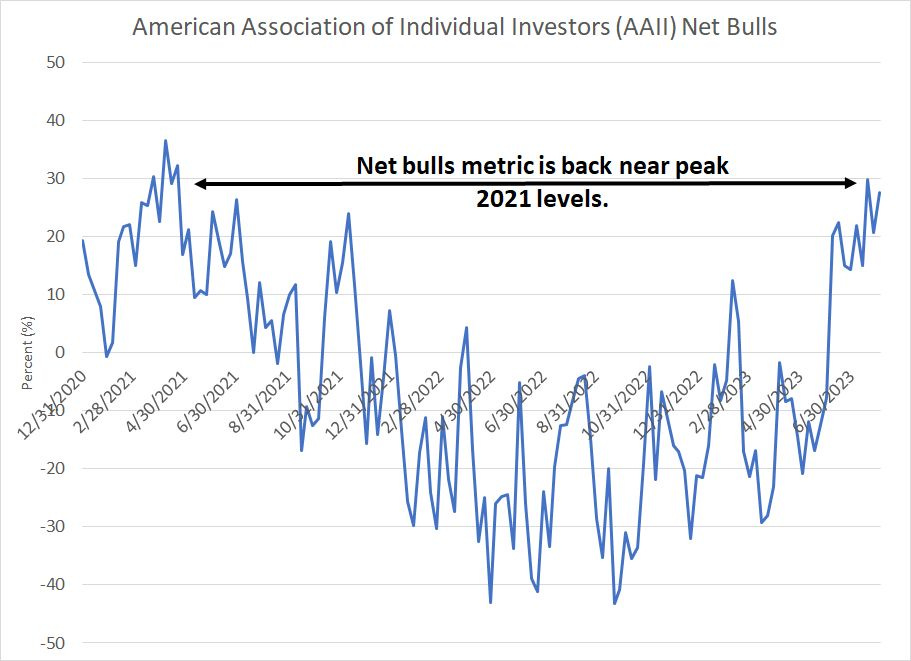
Source: Bloomberg, AAII
To create this chart, I simply subtracted the percentage of respondents to the weekly American Association of Individual Investors (AAII) survey that are bearish from the percentage that are bullish – the higher this number, the more bullish individual investors today.
As you can see, we’re back near the peak levels in 2021, a move that’s particularly striking when you consider that as recently as June the bears still held sway in this survey.
Late to the Party Bulls
However, even as the consensus on Wall Street and at the Fed is beginning to shift in favor of a benign outcome, a growing pile of evidence suggests we’re late in the current economic expansion and a recession remains the most likely outcome.
Consider last week’s July Employment Report from the Bureau of Labor Statistics (BLS):

Source: Bloomberg, Bureau of Labor Statistics
For the second month in a row, total gains in non-farm payrolls were below expectations in July at +187,000 compared to the +200,000 expected.
As I’ve written before, the monthly employment report released by BLS is subject to significant subsequent revisions over time that can change the picture for the US labor market entirely. So, my chart above depicts the actual data reported on the day of first release before any subsequent revisions; I’ve also excluded several months in 2020 when economic lockdowns resulted in extreme month-to-month swings in payrolls.
I’d note two points on this chart.
First, payrolls growth often looks healthy just months before the economy slips into recession. In March 2000, for example, the US economy added +416,000 jobs, the strongest jobs growth in years, and in January 2001, the economy added +268,000 jobs.
The US economy entered recession in March 2001 and the US stock bear market started in March 2000 and ended in October 2002.
In October 2007, the US economy also added 166,000 jobs just two months before entering what’s widely considered among the worst economic downturns since the Great Depression of the 1930s.
It’s also true that jobs growth does appear to decelerate on this basis in roughly the 12 months before the economy slips into recession – you can see this in the lower highs in payrolls growth starting 12 to 18 months before the recessions of 2001 and 2007-09 that I’ve marked with arrows on my chart.
On this basis, the current jobs market fits the bill on both counts.
After all, January’s job gains of 517,000 (on the initial release) was red-hot while, over the past two months payrolls gains on the order of 200,000 per month are the slowest readings we’ve seen since 2021.
Don’t be lulled into a false sense of confidence – just because BLS reports the US is still adding jobs doesn’t mean the economy won’t slip into recession. In fact, that’s usually how it happens – what looks like a gradual slowdown suddenly morphs into a more sinister economic downturn.
Revisions and Temporary Staffing
More importantly, look at this chart:
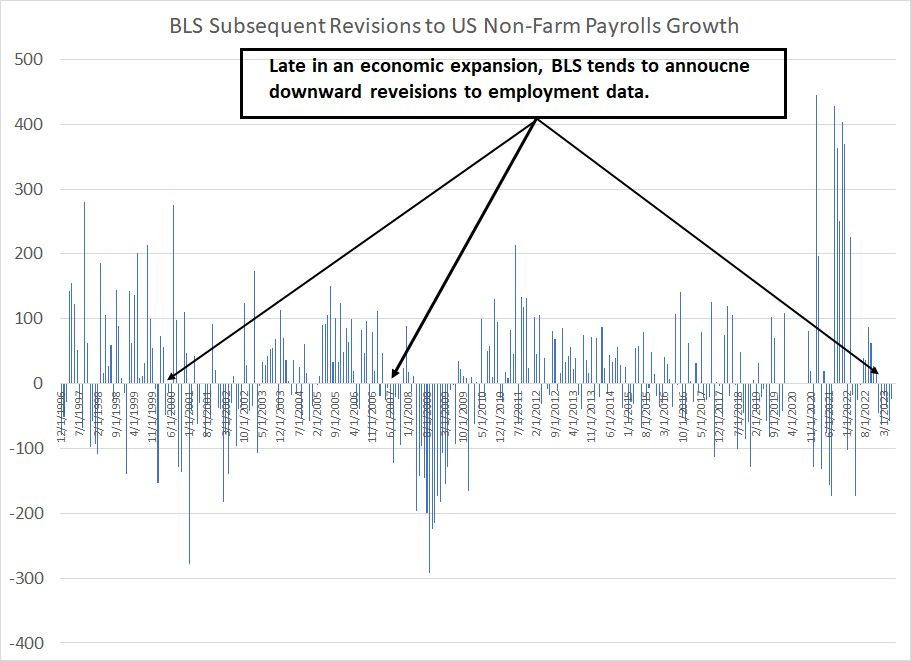
Source: Bloomberg
This chart shows revisions made to monthly payrolls estimates released by BLS over time. As you can see, an extended stretch of significant downside revisions to initial payrolls estimates preceded both the 2001 and 2007-09 recessions.
It’s notable, in that context, that BLS has revised every one of its 2023 monthly payrolls estimates lower, revising away 245,000 previously reported jobs in the first 6 months of this year alone.
And, while the size of recent downward revisions is small relative to what we saw in late 2007 and early 2008, remember that some of the largest revisions BLS makes come as part of an annual rebalancing of its data conducted early in the year. In other words, even larger downward revisions to this data series are likely and, it’s quite plausible by historic standards for the current “healthy” labor market to look far less impressive once final revisions are complete in early 2024.
One more series to watch:

Source: Bloomberg, BLS
This chart shows the month-over-month change in payrolls at temporary employment agencies in the US.
I’ve written this before, however, it’s so crucial it bears repeating:
The labor market is a lagging indicator of economic conditions.
One reason is companies typically do not immediately lay off workers when the economy weakens. For most businesses it’s expensive to hire, discharge and train workers and so firms are loathe to resort to layoffs at the first sign of an economic downturn, because if that softness proves temporary, they might need to re-hire workers to cope with demand, an expensive proposition.
So, to handle short-term peaks and lulls in economic conditions, companies will often use temporary staffing agencies. Temporary workers are typically employed by the staffing agency, not the companies they perform work for; so, it’s relatively simple to take on new temporary workers or release them in response to changing economic conditions.
As you can see in my chart, there’s historically a persistent and meaningful decline in temporary staffing levels ahead of every recession since the early 1990s.
We’re seeing just such a decline right now – US temporary staffing is down 205,000 since a peak in April 2022 and has declined by more than 42,000 payrolls over just the past two months.
The Double-Dip Downturn
As I outlined in last week’s update, “It’s a Bull’s World,” the US stock market has been in a steady uptrend for most of the past 223 years and equity markets enjoy an upward drift over time.
Trends, technicals and market sentiment dominate short-term market direction. And while global equity markets traded broadly lower last week, there’s been limited technical damage, even for the hardest hit major US index, the Nasdaq 100:

Source: Bloomberg
Generally, pullbacks to the region between the 50- and 100-day moving averages are common for the Nasdaq 100 and we haven’t tested that level since March. So, even a sell-off to around 14,000 to 14,100, the lower edge of the sharded green oval in my chart above, would be entirely normal and healthy for the Nasdaq.
Further, don’t forget that some of the strongest equity market gains of the entire market cycle come in the final 12 to 24 months of a bull market – it’s actually quite common for markets to see a “melt-up” just before the stock market peaks and the economy slumps into recession. On average, the S&P 500 has returned an average of 25% in the final 12 months of the last 12 bull markets (excluding the most recent 2020-21 cycle) and 58% in the final 24 months.
So, it’s quite likely we’ll see more upside for the broader market ahead and we’ll see investors buy the initial dips in the stock market this summer.
That’s why I’ve recommended several stocks and exchange traded funds (ETFs) in the model portfolio that’s part of the paid tier of The Free Market Speculator since last spring. The focus here remains reasonably priced stocks that will benefit from the ongoing rotation out of the narrow first half market leadership into more cyclical groups like energy.
Longer-term, last year’s decline — the bear market from January through October — marks an important market and economic shift that’s far from complete.
The indicators I follow started to point to a rising risk of recession a little over a year ago; while there’s usually a delay between early signs of recession and the start of an actual downturn, I felt a recession would start by the first half of this year.
While much of last year’s decline in the stock market was due to concerns about interest rates and Fed policy, my thesis was that there would be a “tipping point” eventually where the market’s main concern shifted from rates to the economy and corporate earnings. Historically, once markets reach that tipping point, the downside accelerates.
My timing was (way) off on that call and the economy proved more resilient than I expected, likely due to excess savings built up from COVID-era stimulus. Further, much of the rally in the broader market in the first 5 months of this year was down to 7 large-cap technology stocks — year-to-date through the end of May, the S&P 500 Equal Weight Index was down -0.65% compared to a 9.64% gain for the S&P 500 and a whopping 30.8% for the Nasdaq 100.
However, the indicators I follow suggest there’s a strong probability the cycle plays out over time.
Specifically, just as Wall Street, and investors begin to embrace late cycle equity market strength there are growing signals the economy is losing steam. Further, last week’s Treasury financing report suggests deficits and elevated government spending do matter; we’re beginning to see evidence the US Treasury’s elevated borrowing needs are draining liquidity as I explained last week in Deficits, Debt and Downgrades.
I continue to believe that we’re entering a market environment that’s similar to the late 1960s to early 1980s right now. Such a market environment is characterized by sizable cyclical rallies and sell-offs within a broad trading range; continued elevated inflation will also likely lead to a prolonged periods of weak or negative real returns from the stock market.
Just consider this:

Source: Bloomberg
This is a chart of the S&P 500 from late 1965 to late 1975. Over this time period, the market traded sideways; however, amid the largely rangebound market, there were 2 major bull cycles from 1966 to 1968 and 1970 to 1973. There were also two nasty bear cycles from 1968-70 and 1973-74.
Economic cycles were generally much shorter, and recessions spaced much closer together, in the 1965 to 1982 era than the experience of either the immediate post war era or 1982-2021. This resulted in a stock market from 1965 to 1975 more dominated by cyclical turns rather than a steady, secular uptrend.
And there are two additional major points to remember about 1965 to 1975.
First, the top of the 1968 bull market was higher than the peak of the 1966 bull while the ‘73 market top was well above that ‘68 peak. However, the 1970 low was also well below the 1966 lows and the 1974 market bottom was below the 1970 lows. The result was a sort of megaphone-shaped pattern of higher highs and higher lows.
Over the past 40 years, investors have become accustomed to powerful bull markets that make significant new highs for equity markets interspersed by more modest bear markets — the broader pattern is one of both higher highs AND higher lows.
However if we’ve entered a period of lower overall returns from equity markets, as I expect, it’s quite likely we can also expect the stock market to exhibit more of a cyclical pattern as you see in my chart above. And if that view holds out, it’s quite plausible we could see both a test of the nominal peak in the S&P 500 (the early 2022 peak) and a break below the late 2022 lows in the next 12 to 24 months.
The second point is that when you look at a chart of an index like the S&P 500, you’re really watching nominal returns not adjusted for the wealth-robbing ravages of inflation. So, while the nominal level of the S&P 500 only declined 1.75% from end-November 1965 to end December 1975, the purchasing power of the dollar plummeted over 36%, so the real return was negative. Even if we include dividends paid over this period, the S&P 500 returned less than 7% in total (NOT annualized) over more than a decade.
The simple fact is that in an inflationary economic environment — like 1965 to 1982 and today — it’s tough for the market to decline on a nominal basis over the long haul.
To give you an extreme example, the Venezuelan stock market has been a strong performer over the past 12 months rallying more than 391% on a nominal basis compared to 10.6% for the S&P 500. The problem is that all of that outperformance fades away if we calculate returns in US dollar terms — Venezuelan stocks are down 4.8% over the past 12 months once we account for (hyper)inflation there.
Again if, as I expect, the US (alongside many other developed markets) is entering more of an inflationary economic regime in coming years, it’s quite plausible the market will make new nominal highs over time while inflation eliminates most or all of those returns on a real basis.
To profit in an environment like that, investors will need to adapt.
In particular, I’d expect superior returns through stock and sector selection rather than simply passive buying of the broader equity market on every dip. Investors will also need to be willing to participate in the powerful cyclical rallies such as we’re seeing right now while playing defense amid the more frequent bear cycles such as we saw last year.
DISCLAIMER: This article is not investment advice and represents the opinions of its author, Elliott Gue. The Free Market Speculator is NOT a securities broker/dealer or an investment advisor. You are responsible for your own investment decisions. All information contained in our newsletters and posts should be independently verified with the companies mentioned, and readers should always conduct their own research and due diligence and consider obtaining professional advice before making any investment decision.