

Lags, Sentiment and Market Tops
Lags, Sentiment and Market Tops
Maybe this time really isn't different...

The S&P 500 hit its closing high so far this year on July 31st.
Since that time, the S&P 500 is down about 4%, the Nasdaq 100 is down 5.5% and the Russell 2000 is off 6.5%. In short, so far these are little more than mild pullbacks in the context of the S&P 500’s blistering 20.6% rally through the first 7 months of this year.
As regular readers of The Free Market Speculator know, I have significant doubts about the long-term health of the US equity market. However, I want to start this post by saying I doubt we’ve seen the top of the 2023 rally; at a minimum, I’d expect a series of retests of the recent peak later this year.
That’s because major selloffs and true bear markets rarely start with a crash. Typically markets see a series of corrections and pullbacks in their final months before reaching a top; usually there are also multiple retests of that peak before the downtrend kicks off in earnest.
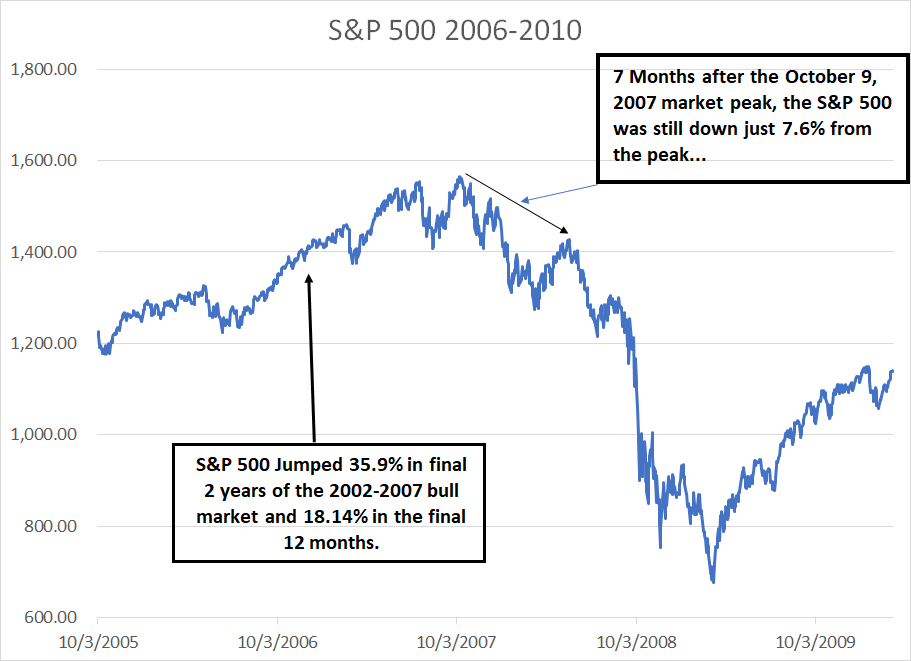
Consider the 2007 market peak:
Source: Bloomberg
As you can see here, the closing peak for the S&P 500 in this cycle came on October 9, 2007 and in the year prior to that peak, the S&P 500 was up 18.14%.
Take a close look at how the S&P 500 behaved near that peak – there was a roughly 6% pullback in February-March 2007 and a near 10% correction in July-August 2007.
Then, following the October peak, the S&P 500 experienced a series of rallies – a near 8% rally in November-December 2007 that peaked about 3.1% below the October top. Between March and mid-May 2008, the S&P 500 rallied more than 12% and as late as May 20th, more than 7 months after the bull market top, the S&P 500 was still trading within 8% of its all-time highs.
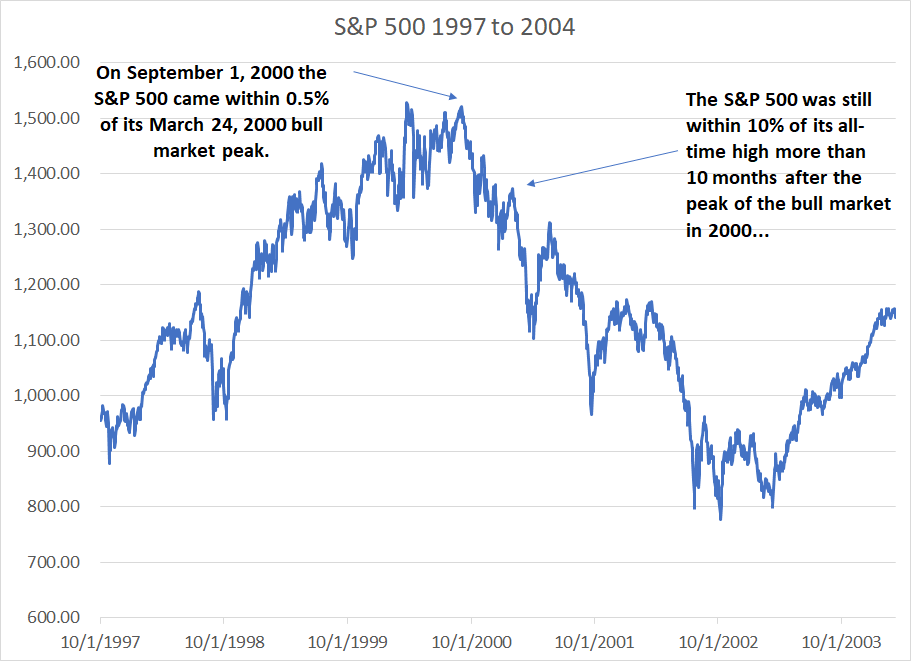
The same pattern around the March 24, 2000 bull market peak:
Source: Bloomberg
In the 12 months leading up to the March 24, 2000 market peak, the S&P 500 soared 21.9% and in the final 24 months of the rally it was up a whopping 41.9%.
As while the Nasdaq, in particular, saw a nasty sell-off in the spring of 2000, the S&P 500, as a whole, actually rallied to within 0.5% of that record high in early September 2000. And, as late as early February 2001, the broader stock market was within 10% of its historic highs.
Just as in 2006-07, the S&P 500 saw a series of significant corrections before and after the March 2000 peak, but it wasn’t until the middle of 2001 that the market began to fall in earnest.
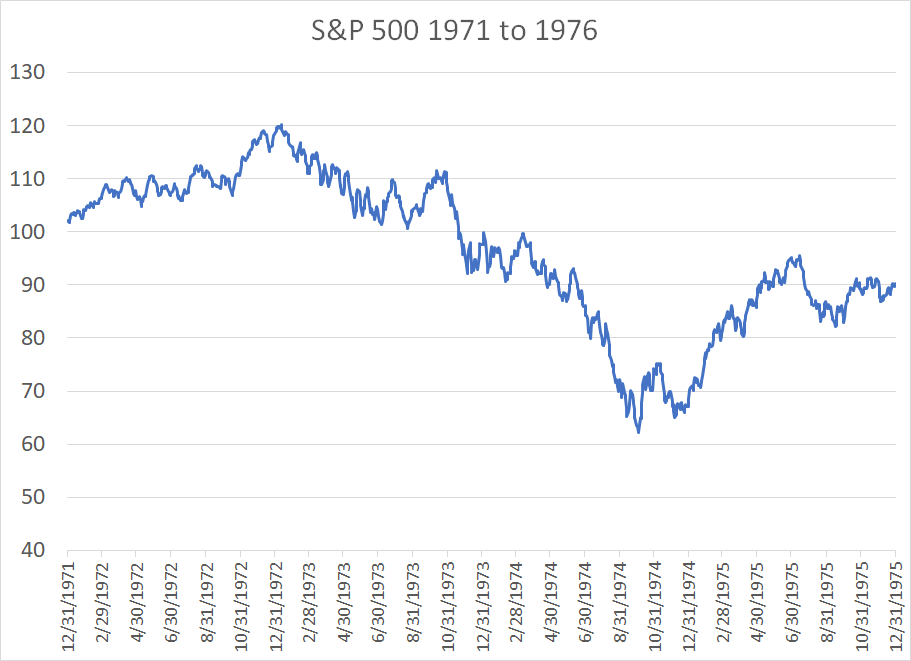
This pattern is nothing modern:
Source: Bloomberg
The closing high for the S&P 500 in this cycle was January 11, 1973; however, that high was less than 2.5% above the broader market’s April 17, 1972 peak and 10 months after the S&P 500’s January top, the market was down only about 15% from its all-time high despite growing signs of economic distress and an historic surge in energy prices
In short, market tops are a process, not an event. It takes time for optimism to perish, and market participants have a strong tendency to see the first pullbacks after a strong advance as a buying opportunity.
The S&P 500 has not yet exceeded its January 3, 2022 bull market peak, so I’d say the bear market that started early last year isn’t yet truly over. However, the near 30% rally in the S&P 500 from its October 2022 nadir to its late-July peak has been powerful enough that I’d expect the peak of this rally to follow a similar pattern to historic bull market tops.
These historic patterns aside, little has really changed for the fundamentals of US markets, or the economy, so far this year.
Let’s start with this:
Valuations Remain Extreme
I’ve written about market valuations and Robert Shiller’s Cyclically-Adjusted Price to Earnings (CAPE) Ratio on several occasions in this service, including the January 5, 2023 issue “The Most Powerful Indicator of Long-Term Market Returns.”
Simply put, market valuations have almost no correlation to subsequent stock market returns over a 1-to-3-year period. However, valuations are a powerful long-term indicator, which can explain more than 70% of 10-year market returns.
Simply put, if you buy the S&P 500 when it’s cheap relative to normalized earnings over the past 10 years, you’re likely to generate above-average returns from holding stocks over the coming decade. And, if you buy stocks when they’re dear on this basis, you are likely to face weak, even negative returns over the long haul.
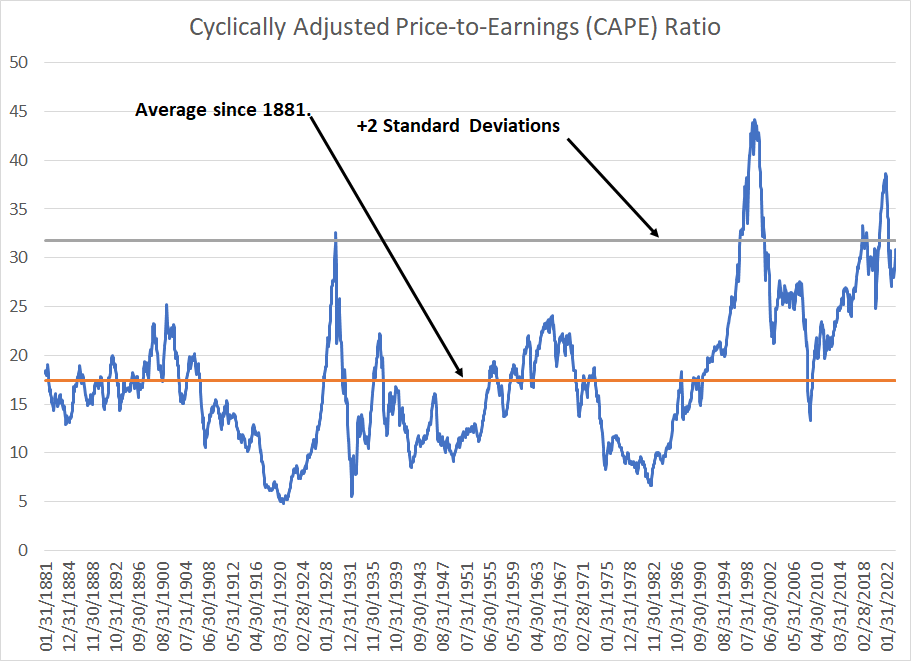
Stocks aren’t cheap here:
Source: Professor Robert Shiller, Yale University online data
Professor Robert Shiller of Yale University created a measure known as the CAPE ratio – it’s essentially a price-to-earnings ratio based on average earnings over a 10-year period. The idea is that there are peaks and lulls in the business cycle so, by averaging profits over a decade, we’re able to smooth out the data and get an better idea of the long-term trend.
As you can see from my chart, Shiller’s website provides data on the CAPE for the US stock market since the 1880s. Since that time, the average CAPE is about 17.4 times, and the current level (as of end-July) is 30.82 times. That’s almost 2 standard deviations above the long-term average.
Based on my own measure of normalized earnings, this suggests long-term returns from the S&P 500 of around 6.7% annualized over the next decade and that’s before inflation – should inflation generally remain elevated in the next 10 years as I expect, your real return from buying stocks over the next decade could well be negative.
Meanwhile, with stocks already pricing in a great deal of positive news, there’s a second major problem:
Lags are Still Present and Ignored
If you’re like me, you’ve probably read scores of articles making an argument that fits this basic pattern:
“Over the past year, the Fed has embarked on one of the most aggressive monetary tightening campaigns in modern financial history; yet, unemployment remains near multi-decade lows and the economy remains strong.”
The exact wording isn’t important. On Tuesday, it was the stronger-than-anticipated retail sales release that captured the financial media’s attention.
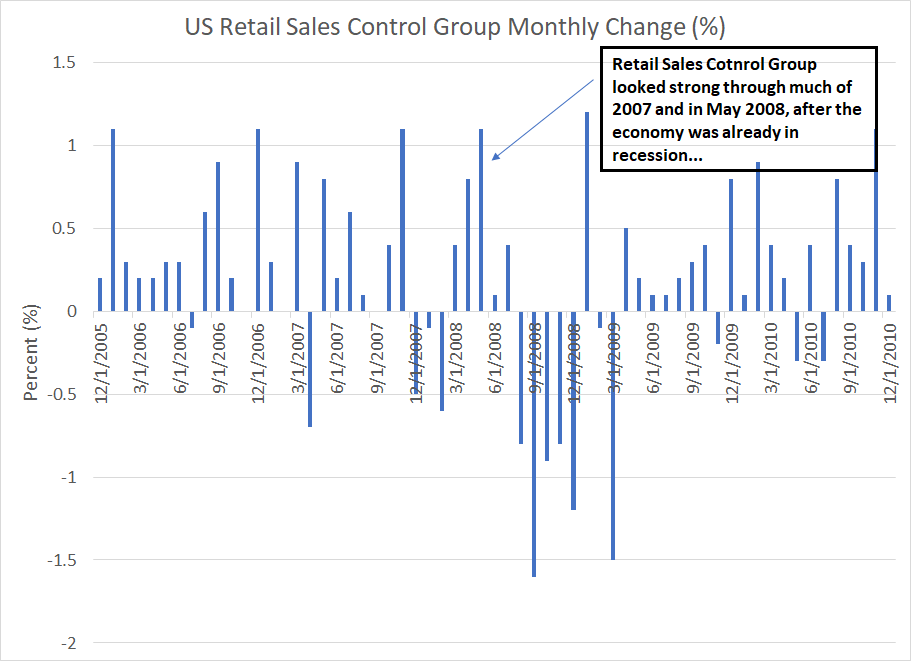
Surely, US Retail Sales Control Group – a number that feeds into the quarterly GDP figures -- can’t grow 1.0%, double expectations, in July if the economy is about to slip into recession, right?
Following that retail sales pop, the Atlanta Fed’s GDP Now real-time economy tracking indicator now projects Q3 2023 GDP growth of a whopping 5.76%! That sounds like an economic boom.
However, what this popular line of reasoning ignores is that that’s how it always works in the lead-up to recession. The truth is that the unemployment rate and retail sales are both known, lagging economic indicators. Consider the 2006-09 experience:
Source: Bloomberg
In May 2008, almost 6 months into the 2007-09 Great Recession, Control Group Sales jumped 1.1%, an even stronger reading than the 1.0% reported last month.
Sales were positive through most of 2007 as well, even as the stock market topped out, and amid growing signs of distress in housing and credit markets.
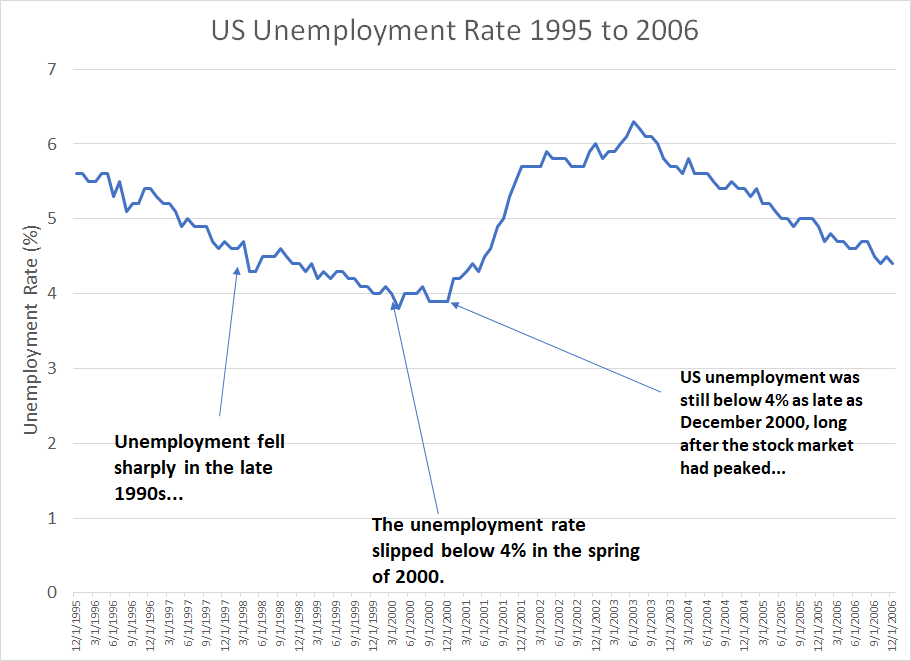
And here’s the unemployment rate in the late 90’s and early 2000’s:
Source: Bloomberg
The US unemployment rate slipped steadily in the late 1990s economic boom years, reaching multi-decade lows under 4% in early 2000 just as the stock market reached its closing peak.
By the end of 2000, unemployment was still at historically low levels below 4%.
Unemployment didn’t start to move definitively higher until the spring of 2001, a year after the stock market peak and just as the economy slipped into recession in March 2001.
And here’s the worst economics sin of all:

Source: Bloomberg
This chart shows the yield curve measured as 10-year rates less 3-Month T-Bill rates since 2004.
The yield curve first inverted in February 2006 (briefly) and then more meaningfully in July 2006. The latter inversion came some 15 months before the stock market peaked in October 2007 and 17 months before the start of the US recession in December 2007.
In the current cycle, the yield curve inverted in early November 2022, just 9 months ago. If the 2007-09 schedule holds this time, the market wouldn’t top until early 2024 and the economy wouldn’t slip into recession until Q2 of 2024.
So, the fact the Fed started hiking rates aggressively last summer – reflected in the inverted curve -- and the impact of tightening hasn’t yet shown up in the unemployment rate or retail sales is not unusual.
It’s common — that’s how it has always happened.
What’s truly curious is that in every cycle I’ve experienced over the past 30 years, the mainstream media and many investors express shock there’s a lag between monetary belt-tightening, weakening economic data and the start of recession.
It seems like every cycle someone writes about the “broken” yield curve or there’s some new technology or trend that’s forever changed the business cycle. In 2000, it was the Internet, in 2007 it was financial innovation and “cash-out refinancing” that would support the consumer and, today, I suppose it’s artificial intelligence (AI).
Or perhaps this time really isn’t different.
Perhaps, the same economic and policy lags that fooled investors in 1999-2000 and 2006-07 are tricking them once again this year.
Maybe even, dare I say it, AI hasn’t abolished the business cycle?
DISCLAIMER: This article is not investment advice and represents the opinions of its author, Elliott Gue. The Free Market Speculator is NOT a securities broker/dealer or an investment advisor. You are responsible for your own investment decisions. All information contained in our newsletters and posts should be independently verified with the companies mentioned, and readers should always conduct their own research and due diligence and consider obtaining professional advice before making any investment decision.