

Long Adventures in Capital Misallocation
Long Adventures in Capital Misallocation
And the real driver of $100/bbl oil prices

In recent updates I’ve written extensively about the surge in US interest rates since early December and rising expectations for Fed rate hikes, particularly since the beginning of this year.
Of course, tighter monetary conditions and rising interest rates are bad news for long duration stocks, which are generally companies valued primarily on distant future earnings and cash flows. That’s because rising rates increase the discount rate, the rate at which future cash flows are discounted to calculate present value.
Expectations for Fed rate hikes have ramped aggressively this year and one could argue convincingly that pricing is a little ahead of itself. For example, as recently as February 10th, the market was pricing in 100% probability of a 25-basis point rate hike at the Fed’s March 16, 2022 meeting and 80%+ probability of a 50 basis point hike.
After the Fed’s “minutes” were released last week showing a 50-basis point hike was not likely the consensus of all Fed members, pricing has receded. Now, while a 25-basis point hike on March 16th still looks like a lock, Fed Funds futures are pricing in just 36% probability of a 50-basis point move.
Overall, just since the middle of last week, the yield on 10-year US government bonds has receded from a peak of over 2.06% on the 16th to lows under 1.92% on Friday.
So, if rising rates are bad for growth stocks, are falling rates, and a more modest pace of Fed hikes, good news?
Not exactly:
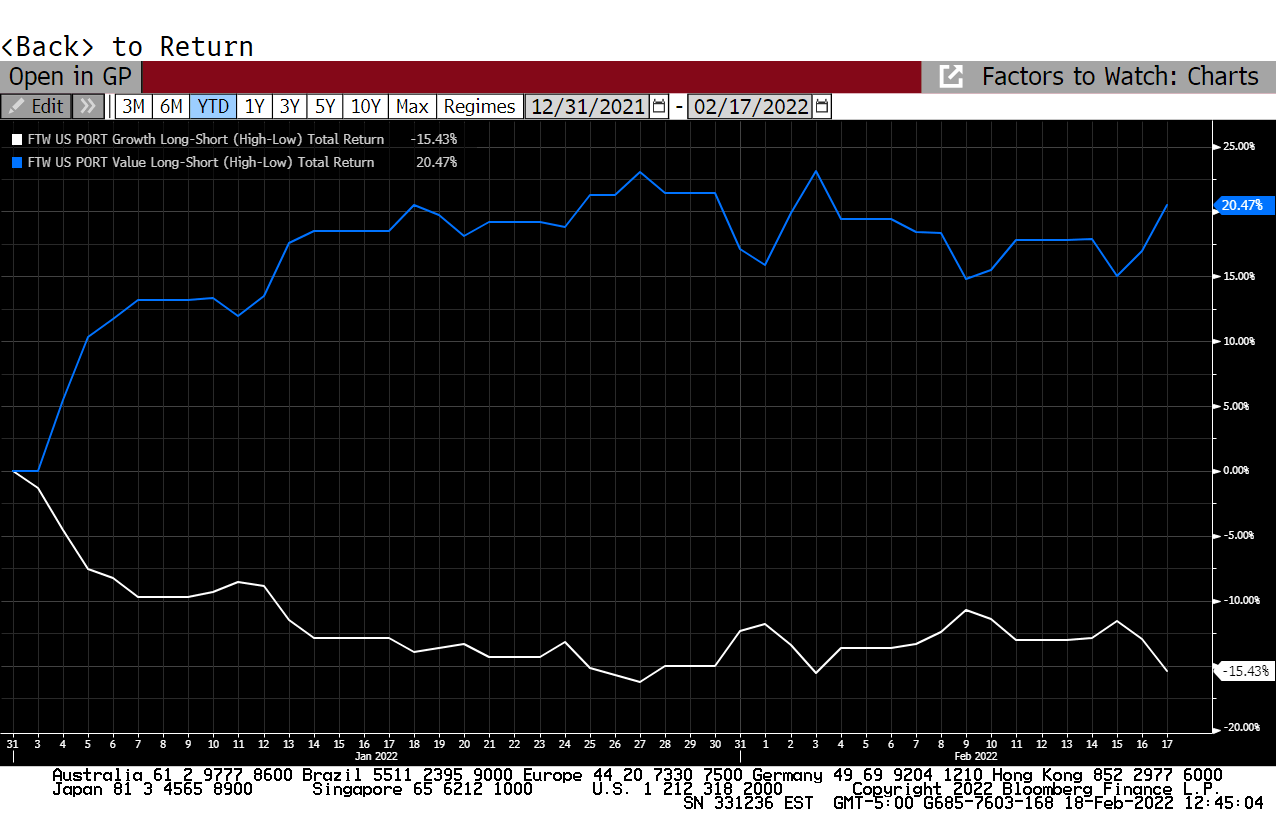
Source: Bloomberg
The chart above shows the performance of the Bloomberg Pure Value (blue line) and Pure Growth (white line) factors so far this year.
The blue line represents the strategy of buying the cheapest 20% of US stocks in the Bloomberg database based on a few valuation metrics and selling the 20% that are most expensive short. This is essentially a short duration strategy because value stocks tend to have high current earnings, sales and cash flow while growth stocks are valued primarily on future prospects.
As you can see, the short duration strategy is up more than 20% so far this year and performance has improved over the past few days despite the pullback in rates.
In contrast, the long duration strategy – the white line on my chart – is down 15.4% and only just above its late-January lows.
This is broadly consistent with the last time long duration stocks were hit hard in the 2000-02 era:
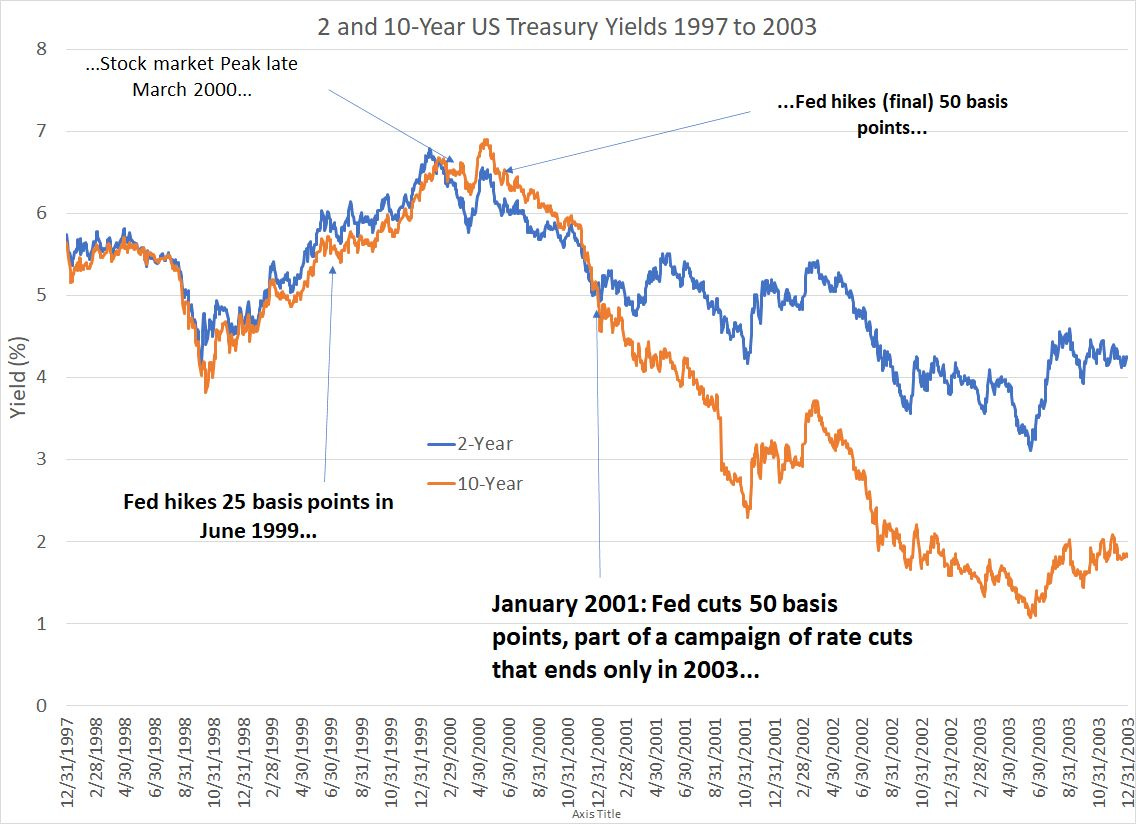
Source: Bloomberg
As you can see, both 2-year and 10-year US Treasury Yields bottomed in 1998 and rose substantially into early 1999 even though the Fed didn’t begin hiking rates until June 1999.
Growth stocks continued to perform well both as yields began rising and, following that, as the Fed began hiking in the middle of 1999.
In fact, the market (particularly long duration stocks in the Nasdaq) didn’t peak until late March of 2000 around the time yields on 2 and 10-year Treasury bonds also peaked. The stock market was already down substantially when the Fed hiked 50 basis points in May 2000, the central bank’s final hike in the cycle.
Also interesting is that even though the Fed didn’t hike rates until January 2001, yields on 2 and 10-year bonds had already fallen back below their mid-1999 level (the start of the Fed rate hike campaign) by that time. And falling yields in late 2000 that continued through mid-2003 didn’t do anything to help the stock market or the Nasdaq (long duration) as stocks broadly fell over this time, led by long duration names.
Indeed, growth stocks didn’t begin outperforming value again until roughly the middle of 2006 AFTER the Fed had already hiked interest rates 425 basis points (4.25%) in a series of moves between the middle of 2004 and the middle of 2006.
Simply put, buying value stocks and/or selling growth stocks – buying or selling equity duration – is NOT simply a trade on interest rates.
In effect, it appears that in 1999-2000, the Fed’s efforts to remove policy accommodation “pricked” a valuation bubble in a group of long-duration growth stocks that had inflated in the second half of the 1990s.
Bubbles, by definition, are not based entirely on economic fundamentals on either the way up or the way back down. Thus, the Fed didn’t really “cause” the Nasdaq to fall, it merely catalyzed a reassessment of the valuation of a group of stocks that had risen too far, too fast in the late 1990s and, once started, that revaluation fed on itself.
Something similar is happening right now.
Whether the Fed hikes 50 basis points or just 25 in March and whether the Fed hikes 6 times, 7 times or 8 times by February 1, 2023 isn’t the real issue for long duration stocks.
The issue is that two things are increasingly clear:
1. The Fed can’t keep interest rates at 0% and buy Treasury and mortgage-backed bonds forever without causing negative economic repercussions including inflation.
2. The ultra-easy monetary policy of the past 14 years (since the 2007-09 financial crisis) has already caused significant misallocation of capital that will take time to unwind.
The implications of point 1 are that, just as in 2000-06, we’re in the early stages of what’s likely to be a major de-rating for long duration “growth” stocks that benefited most from the easy money of the past 14 years.
The implications of #2 are somewhat more controversial and wide-ranging.
However, I’d argue that a perfect example of misallocation is visible in the energy industry right now. Simply put, ultra-low rates have facilitated an epic rally in long duration energy and transportation stocks including names like solar energy player Enphase Energy (NSDQ: ENPH) which has collapsed 47.7% from its November 2021 peak yet still has an $18.8 billion market cap.
Another even more controversial example is electric vehicle (EV) maker Tesla (NSDQ: TSLA) which is down roughly one-third from its early November 2021 peak, yet still has a market cap of $870 billion.
Meanwhile, short duration energy stocks like Exxon Mobil (NYSE: XOM) have languished for much of the last decade – at the lows in the fall of 2020, XOM had a market cap of less than $140 billion.
The stock market may seem like a virtual casino to some but, over all but the shortest time frames, it’s supposed to act as an allocator of capital – companies that produce products, services or raw materials the world needs (or wants) generate strong profits and attract additional capital from investors. That capital, in turn, facilitates the production of more in-demand products, services and raw materials.
When capital has little or no value – and when earnings and profits no longer drive capital allocation -- this system breaks down.
The artificial strength in many alternative energy companies with limited near-term earnings has, in part, attracted capital from traditional energy companies like Exxon, which form the bastion of current global energy supply.
The capital starvation of traditional energy companies has, in turn, led to a decline in investment in exploration and development of new projects over the past 8 years which, over time, has led to a looming supply shortage and the recent price spike. That’s why Germans are dealing with 300% jumps in retail electricity costs this year and why oil prices are nearing $100/bbl.
That’s not to say that Tesla or Enphase are worthless or that they don’t have growth prospects over the intermediate to longer term. However, I do believe it’s worth asking if Tesla is worth almost 3 times as much as Exxon -- a market cap of $870 billion for the former vs. $325 billion for the latter – in a market where interest rates are (at least) not negative and projected earnings for the year 2035 are worth substantially less than profits likely to be generated this year.
DISCLAIMER: This article is not investment advice and represents the opinions of its author, Elliott Gue. The Free Market Speculator is NOT a securities broker/dealer or an investment advisor. You are responsible for your own investment decisions. All information contained in our newsletters and posts should be independently verified with the companies mentioned, and readers should always conduct their own research and due diligence and consider obtaining professional advice before making any investment decision.