

Market Breadth and Q4 Rallies
Market Breadth and Q4 Rallies
Breadth is important, just not in the short term

Stocks had a tough week last week with the S&P 500 down 2.4%, the Nasdaq 100 down about 2.9% and the Russell 2000 off 2.3%.
Even worse is stock market breadth:

Source: Bloomberg
This chart shows the total percentage of stocks in the S&P 500 and Russell 2000 trading above their respective 200-day moving averages since the end of September last year.
A simple, dispassionate definition of trend:
Stocks trading above their 200-day moving averages are in an uptrend, while those below the moving average are in a downtrend.
As you can see, even with the S&P 500 up 11.5% year-to-date through the end of last week, and down just 8% from its late July peak this year, only around 37% of stocks in the index are trading above their respective 200-day moving averages. For the small-cap Russell 2000, breadth is even worse on this basis with barely one-quarter of stocks above their 200-day moving averages.
The last time market internals were this weak was late October 2022, just as the indices were coming off their late-2022 lows.
That’s a problem for the stock market longer-term because rallies driven by just a handful of stocks are prone to failure; once those leaders crumble, the market can see significant downside. Indeed, some of the greatest bear markets in history were preceded by a steady deterioration in market breadth.
However, this is crucial: Breadth is not a great short-term market indicator.
For example, the S&P 500 saw a 14.9% jump in the final quarter of 1999, its best year-end rally in the past 24 years. Here’s a look at the portion of S&P 500 stocks trading above their 200-day moving averages in that era:

Source: Bloomberg
A quick glance at this chart shows the S&P 500 enjoyed a near 15% fourth quarter rally in 1999 amid very weak market breadth – indeed, on October 15, 1999 some 24 years ago, market breadth was even worse than today with less than 30% of S&P 500 stocks trading above their respective 200-day moving averages.
Breadth continued to deteriorate into early 2000 and at the time of the ultimate bull market peak on March 24, 2000, only around one-third of S&P members were above their 200-day simple move average.
Perhaps most shocking of all: The S&P 500 sold off more than 12% from its March 2000 market peak through year-end, the start of a nasty bear market that didn’t find a low until October 2002. However, as you can see in my chart above, breadth actually started to recover at the end of 2000, just as the market sell-off began to accelerate.
At first blush, this might seem bizarre.
However, just consider the late 1990s bull market, and the 2000-02 bear market that followed, were all driven by a bubble in technology and growth stocks.
Stock market breadth on some measures actually peaked in 1997 even though the stock market continued to rally into early 2000. That’s because the final leg of the great 1990s bull market was driven by a small number of tech and growth stocks while most companies and industries in the S&P 500 underperformed.
If that sounds familiar it’s probably because the “Magnificent 7” Tech stocks have driven virtually all of the gain in US markets so far this year — the Equal Weight S&P 500 is unperforming its market cap weighted counterpart by a whopping 13% year to date.
In 2000, the market peaked once the dwindling list of market leaders finally broke down in the spring; at that time, some money rotated out of the expensive tech leaders and into groups that had underperformed for years leading up to the market peak. So, for example, the Russell 1000 Value Index was up about 24% from the end of 1997 through the end of 1999 while the Russell 1000 Growth Index soared 84%.
In the year following the S&P’s March 24, 2000 peak, however, the Russell 1000 Growth Index plummeted 43.5% while the Russell 1000 Value Index fell less than 3%.
That’s not the only example:

Source: Bloomberg
Back in 2011, for example, the S&P 500 jumped 11.8% despite the fact market breadth on the same basis was weak throughout much of October and November of that year.
So, that brings me to this:
The S&P 500’s “Breakdown”
I just outlined how I regard the 200-day moving average as a solid intermediate to long-term indicator for an individual stock’s trend.
That’s also true for the index itself and, on Friday, the S&P 500 cracked below its 200-day moving average on a closing basis for the first time since March:

Source: Bloomberg
So, does that breakdown spell doom for the S&P 500?
The answer is not really, at least not yet.
On Friday, the S&P 500 closed about 9 index points (0.2% ) below its 200-day moving average, a marginal breakdown to say the least. Short-lived minor breakdowns below key technical support levels like the 200-day are common in every market cycle. And a minor short-lived breakdown like this often comes at the end of market corrections and pullbacks and before significant rallies.
Here’s an example from 2018-19:
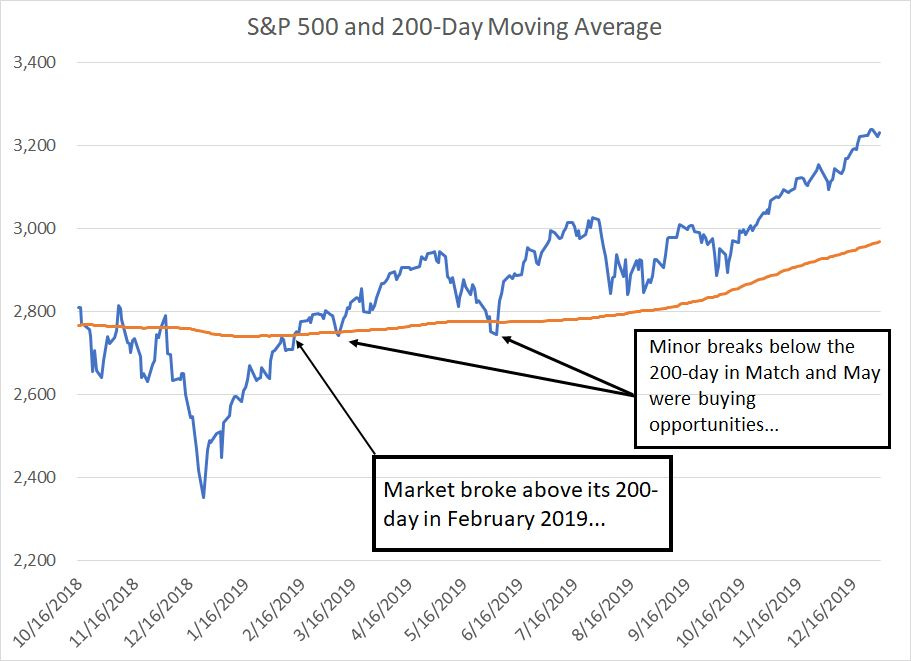
Source: Bloomberg
The S&P 500 saw a near 20% decline in Q4 2018 and then recovered to close back over its 200-day in February 2019. The market then retested the 200-day, seeing minor, short-lived breaks below the moving average in March and May.
Indeed, these pullbacks proved outstanding buying opportunities — investors who bought the S&P 500 when it dipped below the 200-day in May 2019, for example, would have enjoyed a 24.6% rally to the ultimate market peak on February 19, 2020 just before the coronavirus lockdown crash.
Long-time readers know I’m skeptical of the broader market and the health of the US economy. However, as I outlined in the October 13, 2023 issue of FMS, “Santa Claus and the Dip Buyers,” the broader market has a strong seasonal upside bias in Q4 2023. And, don’t be fooled — neither weak market breadth nor the minor break below the 200-day erode potential for a seasonal rally.
One more point:
Sentiment isn’t Bullish
From a contrarian standpoint, investors appear to have turned more bullish on stocks since May; however, we’re not at levels that typically mark major tops:
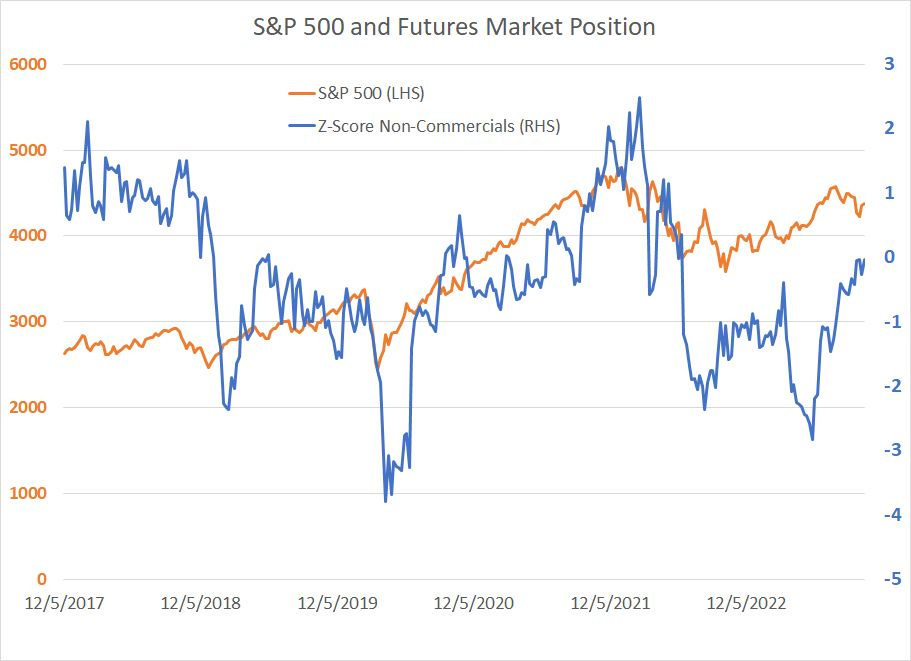
Source: Bloomberg
This chart shows the CFTC-reported non-commercial S&P 500 futures and options position depicted as a blue line (right-hand scale). Rather than providing the raw data, it’s expressed as a z-score based on a 156-week lookback period (3 years) — a reading of 1.0, for example, would mean speculators have a position in S&P 500 futures that’s 1 standard deviation above the 3-year weekly average.
The orange line is simply a chart of the S&P 500 (see the left hand scale).
The idea is simple — when the non-commercial S&P 500 futures market position spikes to 1.5 to 2.0 standard deviations above the 3-year moving average, it’s a good time to watch for a potential market top, at least on a short-term basis.
In 2018, for example, the net bullish position spiked more than 2 standard deviations above the mean in early February; by the time the market reached its 2018 lows on December 24th, the S&P 500 had tumbled almost 11%.
Between November 2021 and January 2022 this indicator also flashed a contrarian “sell,” spiking to above 2 standard deviations on multiple occasions. The result was the nasty 2022 bear market for the S&P 500 — the broader stock market tumbled more than 25% from high to low last year.
The only exception to this “rule” was the early 2020 market peak. However, I’d argue the short, severe bear market in February-March 2020 was unique in modern financial history. That’s because it was a bear market driven by an exogenous shock — near-global “lockdowns” and travel restrictions amid the initial coronavirus outbreak — followed by unprecedented fiscal and monetary stimulus.
Right now, with speculators still holding a net short position in the S&P 500 it certainly doesn’t appear most investors are all-in on a year-end rally. Clearly, there’s still money sitting on the sidelines that doesn’t trust the rally this year.
I don’t care for hypothetical roadmaps or predictions because they imply a degree of precision in financial markets that simply doesn’t exist.
This is NOT set in stone; however, my working hypothesis goes something like this:
The 2022 bear market never actually ended and there there is no bull market underway right now — indeed, the S&P 500 is up 19.9% since its closing low a little over a year ago, but the S&P 500 Equal Weight is up a paltry 8.3% and the Russell 2000 is down over the same time period including dividends. So most stocks aren’t rallying.
The S&P 500 won’t make a significant fresh all-time peak in 2023 or 2024 and, more likely, we’ll see a close below the October 2022 closing low at 3,577.03 before the end of next year as the economy enters recession.
Short-term there’s room for a seasonal rally in Q4 of this year as the S&P 500 bounces off technical support, long-term Treasury yields peak, and the economic and earnings data remains benign.
Of course, to quote John Maynard Keynes:
“When the facts change, I change my mind. What do you do, sir?”
The next two weeks will be pivotal with most of the Magnificent 7 Growth stocks due to report:
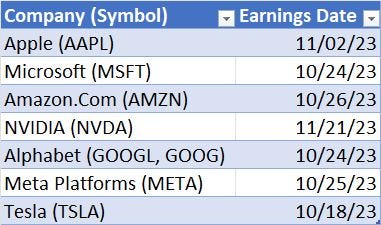
Source: Bloomberg
Tesla kicked off with a nasty quarter last week, the stock is down almost 17% since its close on the day before earnings. However, with the broader market into support, it’s quite plausible decent earnings from the likes of Microsoft, Google, Amazon and Meta this week could kick off a year-end rally.
If , however, the S&P 500 were to close around roughly 4,150 or spend more than a week or so below its 200-day moving average, my hypothetical scenario outlined above would be called into question and I’d recommend taking action to protect our downside risk in the FMS model portfolio.
Yesterday, oil giant Chevron (NYSE: CVX) announced a $59.4 billion all-stock deal to acquire Hess Corp. (NYSE: HES), recommended in the model portfolio that’s part of the paid tier of FMS. This marks the second energy industry megadeal in just the past two weeks following the near $68 billion for ExxonMobil (NYSE: XOM) to acquire Pioneer Natural Resources (NYSE: PXD) announced on October 11th.
So, here’s my quick take on energy industry consolidation and my updated recommendation on Hess in light of the Chevron deal:
If you’re not yet a paid reader to FMS, I’m still offering 60-day free trials to the service via this link:
This offer closes Friday November 3rd.
Actions to Take
Keep reading with a 7-day free trial
Subscribe to The Free Market Speculator to keep reading this post and get 7 days of free access to the full post archives.