

Meet the New Leaders
Meet the New Leaders
Tech is losing steam, energy, and materials now lead

Technology and the Nasdaq aren’t exactly plummeting this year.
After all, the Nasdaq 100 is up 9.6% year-to-date and 7.5% since the end of January alone. Moreover, the S&P 500 Information Technology Index is the second best-performing sector in the index this year, up 14.1% and trailing only (tech-attached) Communications Services up 16.3%.
The Nasdaq 100 set a fresh all-time high this morning and new highs are hardly a symptom of bear market.
Nonetheless, there are growing signs of weakness – cracks in tech’s armor – appearing just beneath the surface.
For one thing, since the end of January, last year’s big winners — technology and consumer discretionary — rank decidedly mid-pack:
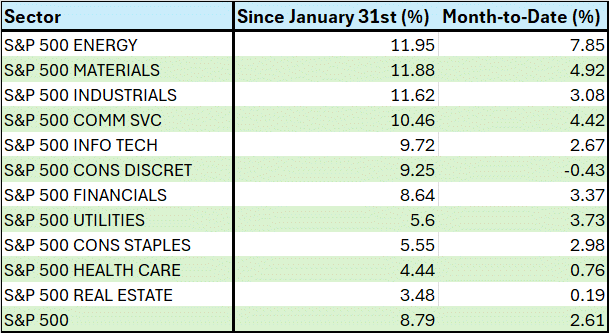
Source: Bloomberg
Since January 31st, technology and consumer discretionary rank 5th and 6th out of 11 S&P 500 Economic Sector Indices in terms of total returns. That compares to number 1 and number 3 ranked in total performance last year (2023).
In contrast, the top 2 sectors since end-January are Energy +11.95% and Materials +11.88%. Energy was the second-worst performer in 2023, down 1.42% compared to the 26.3% total return in the S&P 500.
And, since the end of February, energy and materials again rank #1 and #2 while technology ranks 8 of 11 sectors and consumer discretionary is sitting right at the bottom of the league table, down 0.43% through the first 20 calendar days of March.
And check out this chart:

Source: Bloomberg
This chart shows the Nasdaq 100 ETF (QQQ) as a blue line. I’ve also included the percentage of Nasdaq Composite stocks hitting new 4-week (roughly 1 month) highs as an orange bar and the percentage of Nasdaq Composite stocks hitting new 4-week lows as a green bar.
Note that the Nasdaq Composite is a much broader index than the Nasdaq 100; the former includes some 2,500 issues compared to just 100.
As you can see, even as the QQQ moved higher through February and, to a lesser extent this month, the portion of Nasdaq stocks hitting new 4-week highs steadily declined. That’s certainly a sign of deteriorating breadth, but it’s not a sign of an imminent breakdown.
Look at those new 4-week lows. At first, even as the percentage of new highs trended lower, there was no real sign of an expansion in new lows – effectively that just means that there are probably a lot of stocks in the Nasdaq trading sideways or consolidating near their recent (4-week) highs.
That changed last week on Thursday – even though the Nasdaq 100 was only down about 0.25% on Thursday March 14th, and the Nasdaq Composite was off just 0.3%, some 26.6% of all Nasdaq Composite stocks hit 4-week lows. That’s the largest proportion since January 17th, 2024.
I would caution readers the Nasdaq 100, the Nasdaq Composite and the S&P 500 are all in uptrends right now and holding above key support levels. However, just underneath that veneer, we’re seeing a growing list of signals that upside momentum is fading.
I’d be surprised – shocked really – if the Nasdaq 100 and Nasdaq Composite crashed into a bear market immediately. After all, as the old market saw goes, market tops are a process, and bottoms are an event. However, the signs continue to point to at least a breather or short-term pullback in the broader market led by some of last year’s most obvious leaders.
Meanwhile, I continue to see rotation in favor of a new crop of market leaders:
Energy’s Newfound Momentum
As I explained earlier, energy is the top-performing group in the S&P 500 both since the end of January and so far this month.
I’ve written about some of the fundamentals supporting the group, and oil prices, on a few occasions in this service and those trends continue.
Late last year, the International Energy Agency (IEA) was forecasting the global oil market to be in a significant surplus through the first half of 2024 with global supply exceeding demand. You also had plenty of talking heads in the mainstream media touting record-setting US oil production and a global glut of production; even some pundits highlighting risks the Saudis could try to flood the oil market with supply to squeeze undisciplined share producers.
The problem with all that, unlike back in late 2014, the indicators I track for evaluating physical oil markets have continued flash warning signs of a tightening supply/demand balance in oil:
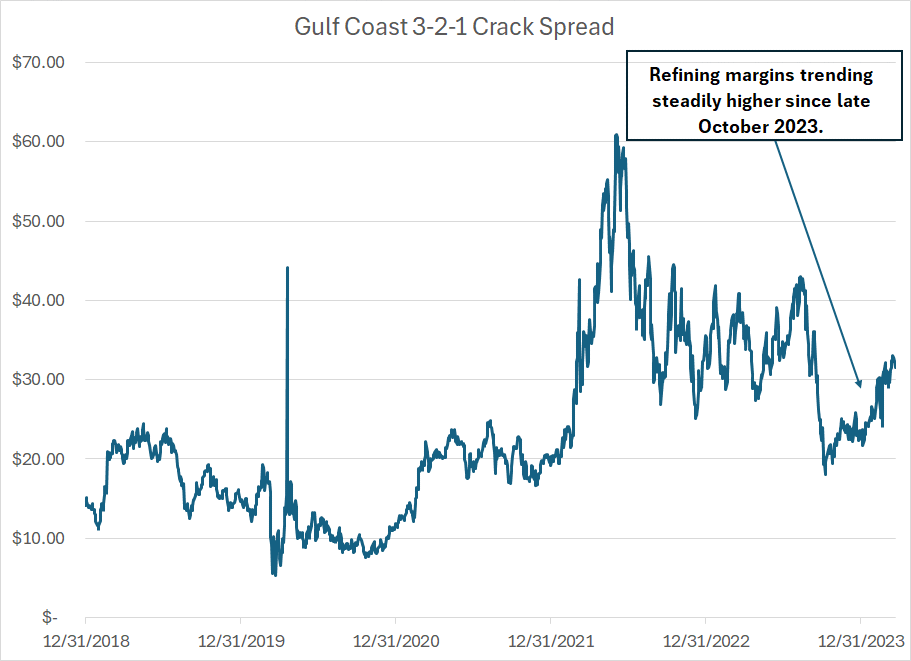
Source: Bloomberg
The 3-2-1 Crack spread measures the theoretical profitability of refining one barrel of West Texas Intermediate (WTI) crude oil into 2 barrels of gasoline and 1 barrel of diesel fuel.
Price is the market’s language and crack spreads are a key dialect for the oil market.
When crack spreads are rising, that’s the energy market’s way of providing an incentive for refiners to produce more gasoline, jet fuel and diesel fuel – they want to produce more because they make more money to convert oil into these products. So, typically, when demand is weak, crack spreads will fall or remain at best range bound – so far in 2024, however, the 3-2-1 crack spread began rising sooner than in a normal year and are well above the 5-year seasonal average.
This week, the IEA finally admitted what’s been rather obvious to anyone looking at indicators like the crack spreads – the oil market is likely to remain in deficit throughout this year, meaning that demand growth will exceed growth in global supply.
Markets are also beginning to reflect the positive and strengthening fundamental story:
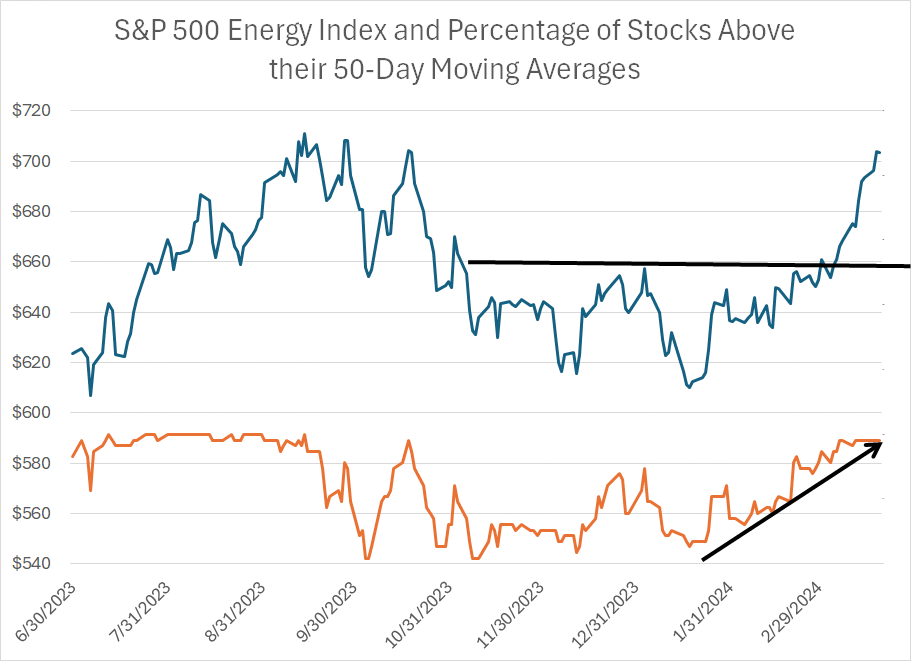
Source: Bloomberg
The dark blue line is the S&P 500 Energy Index, while the orange line shows the percentage of stocks in the S&P 500 Energy Index (23 Index members) that are trading above their 50-day moving averages.
In many ways this chart provides the opposite message to that of the Nasdaq 100 – the S&P 500 Energy Index has rallied steadily since late January and that move has been supported by most stocks in the index. More than 95% of S&P 500 Energy Index constituents are now trading above their 50-day MAs, the highest proportion since the summer of 2023.
And take a look at this:
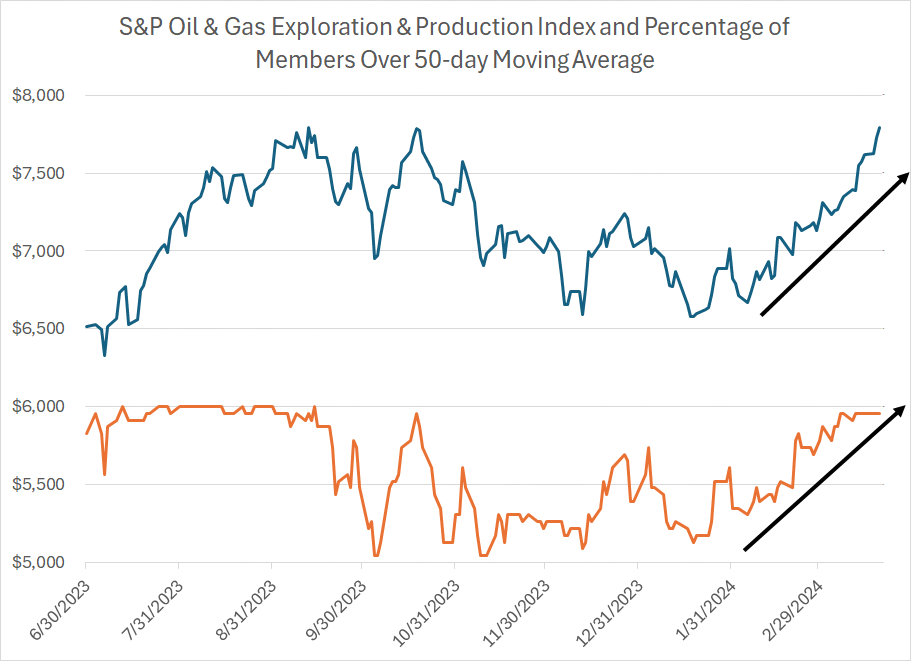
Source: Bloomberg
With only 23 stocks, the S&P 500 Energy Index is narrow in comparison to an index like the Nasdaq Composite or, for than matter, the Nasdaq 100. So, this is a look at the S&P Oil & Gas Exploration & Production Industry Index, which contains 54 equal-weighted members.
This is also the index that underpins the popular SPDR S&P Oil & Gas E&P ETF (NYSE: XOP).
Same story in this chart. Specifically, not only is the index itself surging this year -- up a whopping 10.7% year-to-date, nearly 2 percentage points better than the S&P 500 – but the percentage of stocks trading above their 50-day moving averages is also on a roll, topping 95% right now.
And here’s a look at the S&P 500 Energy Index along with the percentage of stocks registering new 4-week highs and four-week lows:
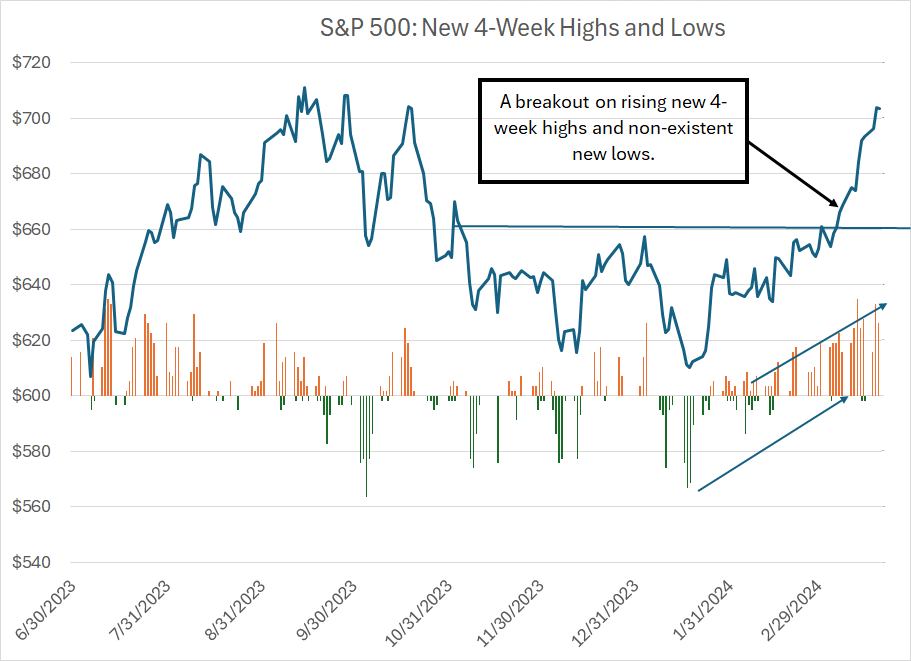
Source: Bloomberg
Again, this is (almost) the opposite of what we see in the Nasdaq – not only is the S&P 500 Energy Index breaking higher in price, but a rising percentage of stocks in the index are breaking to new 4-week highs. The list of new 4-week lows is almost nonexistent.
As I’ve been writing for some time now, this market looks like 2023 superficially, but if you scratch the surface there’s significant sector-to-sector rotation underway.
In the model portfolio that’s part of the paid tier of the Free Market Speculator I’ve been bumping up exposure to the new leaders in the S&P 500 including energy, industrials and just last week, materials. I’m evaluating a list of new names for possible inclusion over the next few weeks.
DISCLAIMER: This article is not investment advice and represents the opinions of its author, Elliott Gue. The Free Market Speculator is NOT a securities broker/dealer or an investment advisor. You are responsible for your own investment decisions. All information contained in our newsletters and posts should be independently verified with the companies mentioned, and readers should always conduct their own research and due diligence and consider obtaining professional advice before making any investment decision.