

Natural Gas on the Move
Natural Gas on the Move
The outlook for prices and what to avoid...

US natural gas prices have been on the move lately with the front-month futures rallying from around $2.50/MMBtu in early September to as high as $3.45/MMBtu last week.
In The Free Market Speculator, our exposure to natural gas in the model portfolio is via our recommended position in a natural gas exploration and production (E&P) company rather than an ETF that tracks the price of gas itself, like the US Natural Gas Fund (NYSE: UNG) or ProShares Ultra Bloomberg Natural Gas (NSDQ: BOIL).
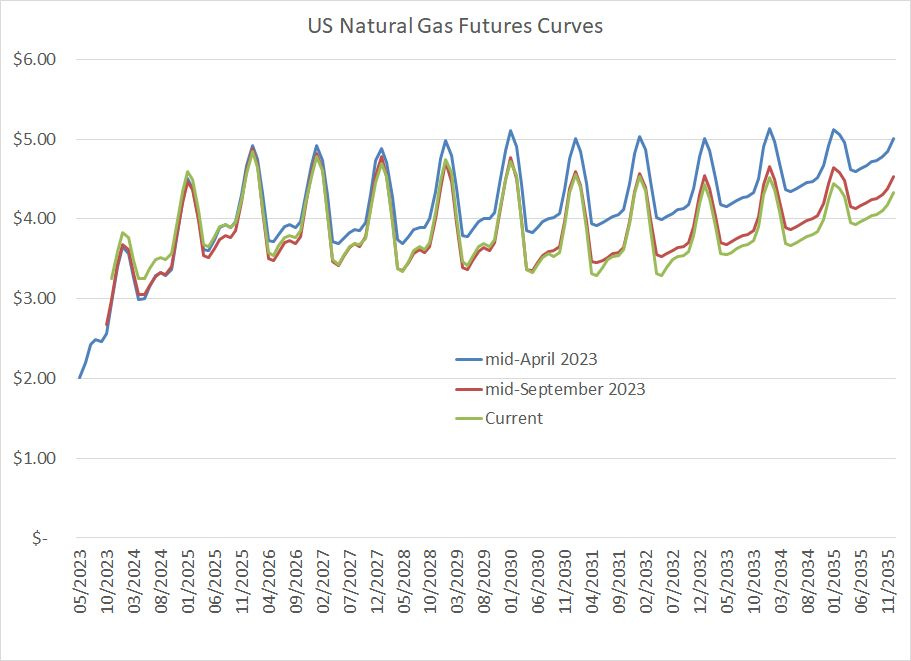
When it comes to stocks in natural gas producers, it’s far more important to monitor the calendar strip rather than the spot or front-month price of gas:
Source: Bloomberg
This chart shows the natural gas futures curves six months ago in mid-April of this year (blue line), 1 month ago in mid-September (red line) and as of last Friday (green).
In short, much of the “rally” in natural gas was baked into the futures curve six months ago.
That’s because even with front-month gas prices hovering around $2 in mid-April of this year, market participants were well aware the primary headwinds for gas were temporary, including a hangover from the warm winter of 2022-23 in the US (and Europe) and the long-term outage of export capacity at the Freeport LNG facility in Texas.
Regardless, warm summer weather and US gas producers’ efforts at self-help – cutting CAPEX and laying off drilling rigs – has helped to rebalance supply and demand in this market just as we approach the start of winter heating season next month:

Source: Bloomberg
This chart shows the total amount of gas in storage in the US compared to the 5-year average where positive numbers indicate surplus storage (bearish gas) and negative numbers the opposite.
As you can see, at the peak in late June, US gas storage was some 370 bcf above the 5-year average “normal” level. However, thanks to a combination of warm summer weather that drove demand, and slowing production from many major US shale fields, the gas oversupply stands at just 163 bcf, less than half that peak.
We’re in a time of year when demand for natural gas is low, mainly because summer cooling season is winding down and winter heating season hasn’t really started to ramp up yet. If history is any guide, US storage will continue to rise until the first or second week of November, then begin to decline as the weather cools.
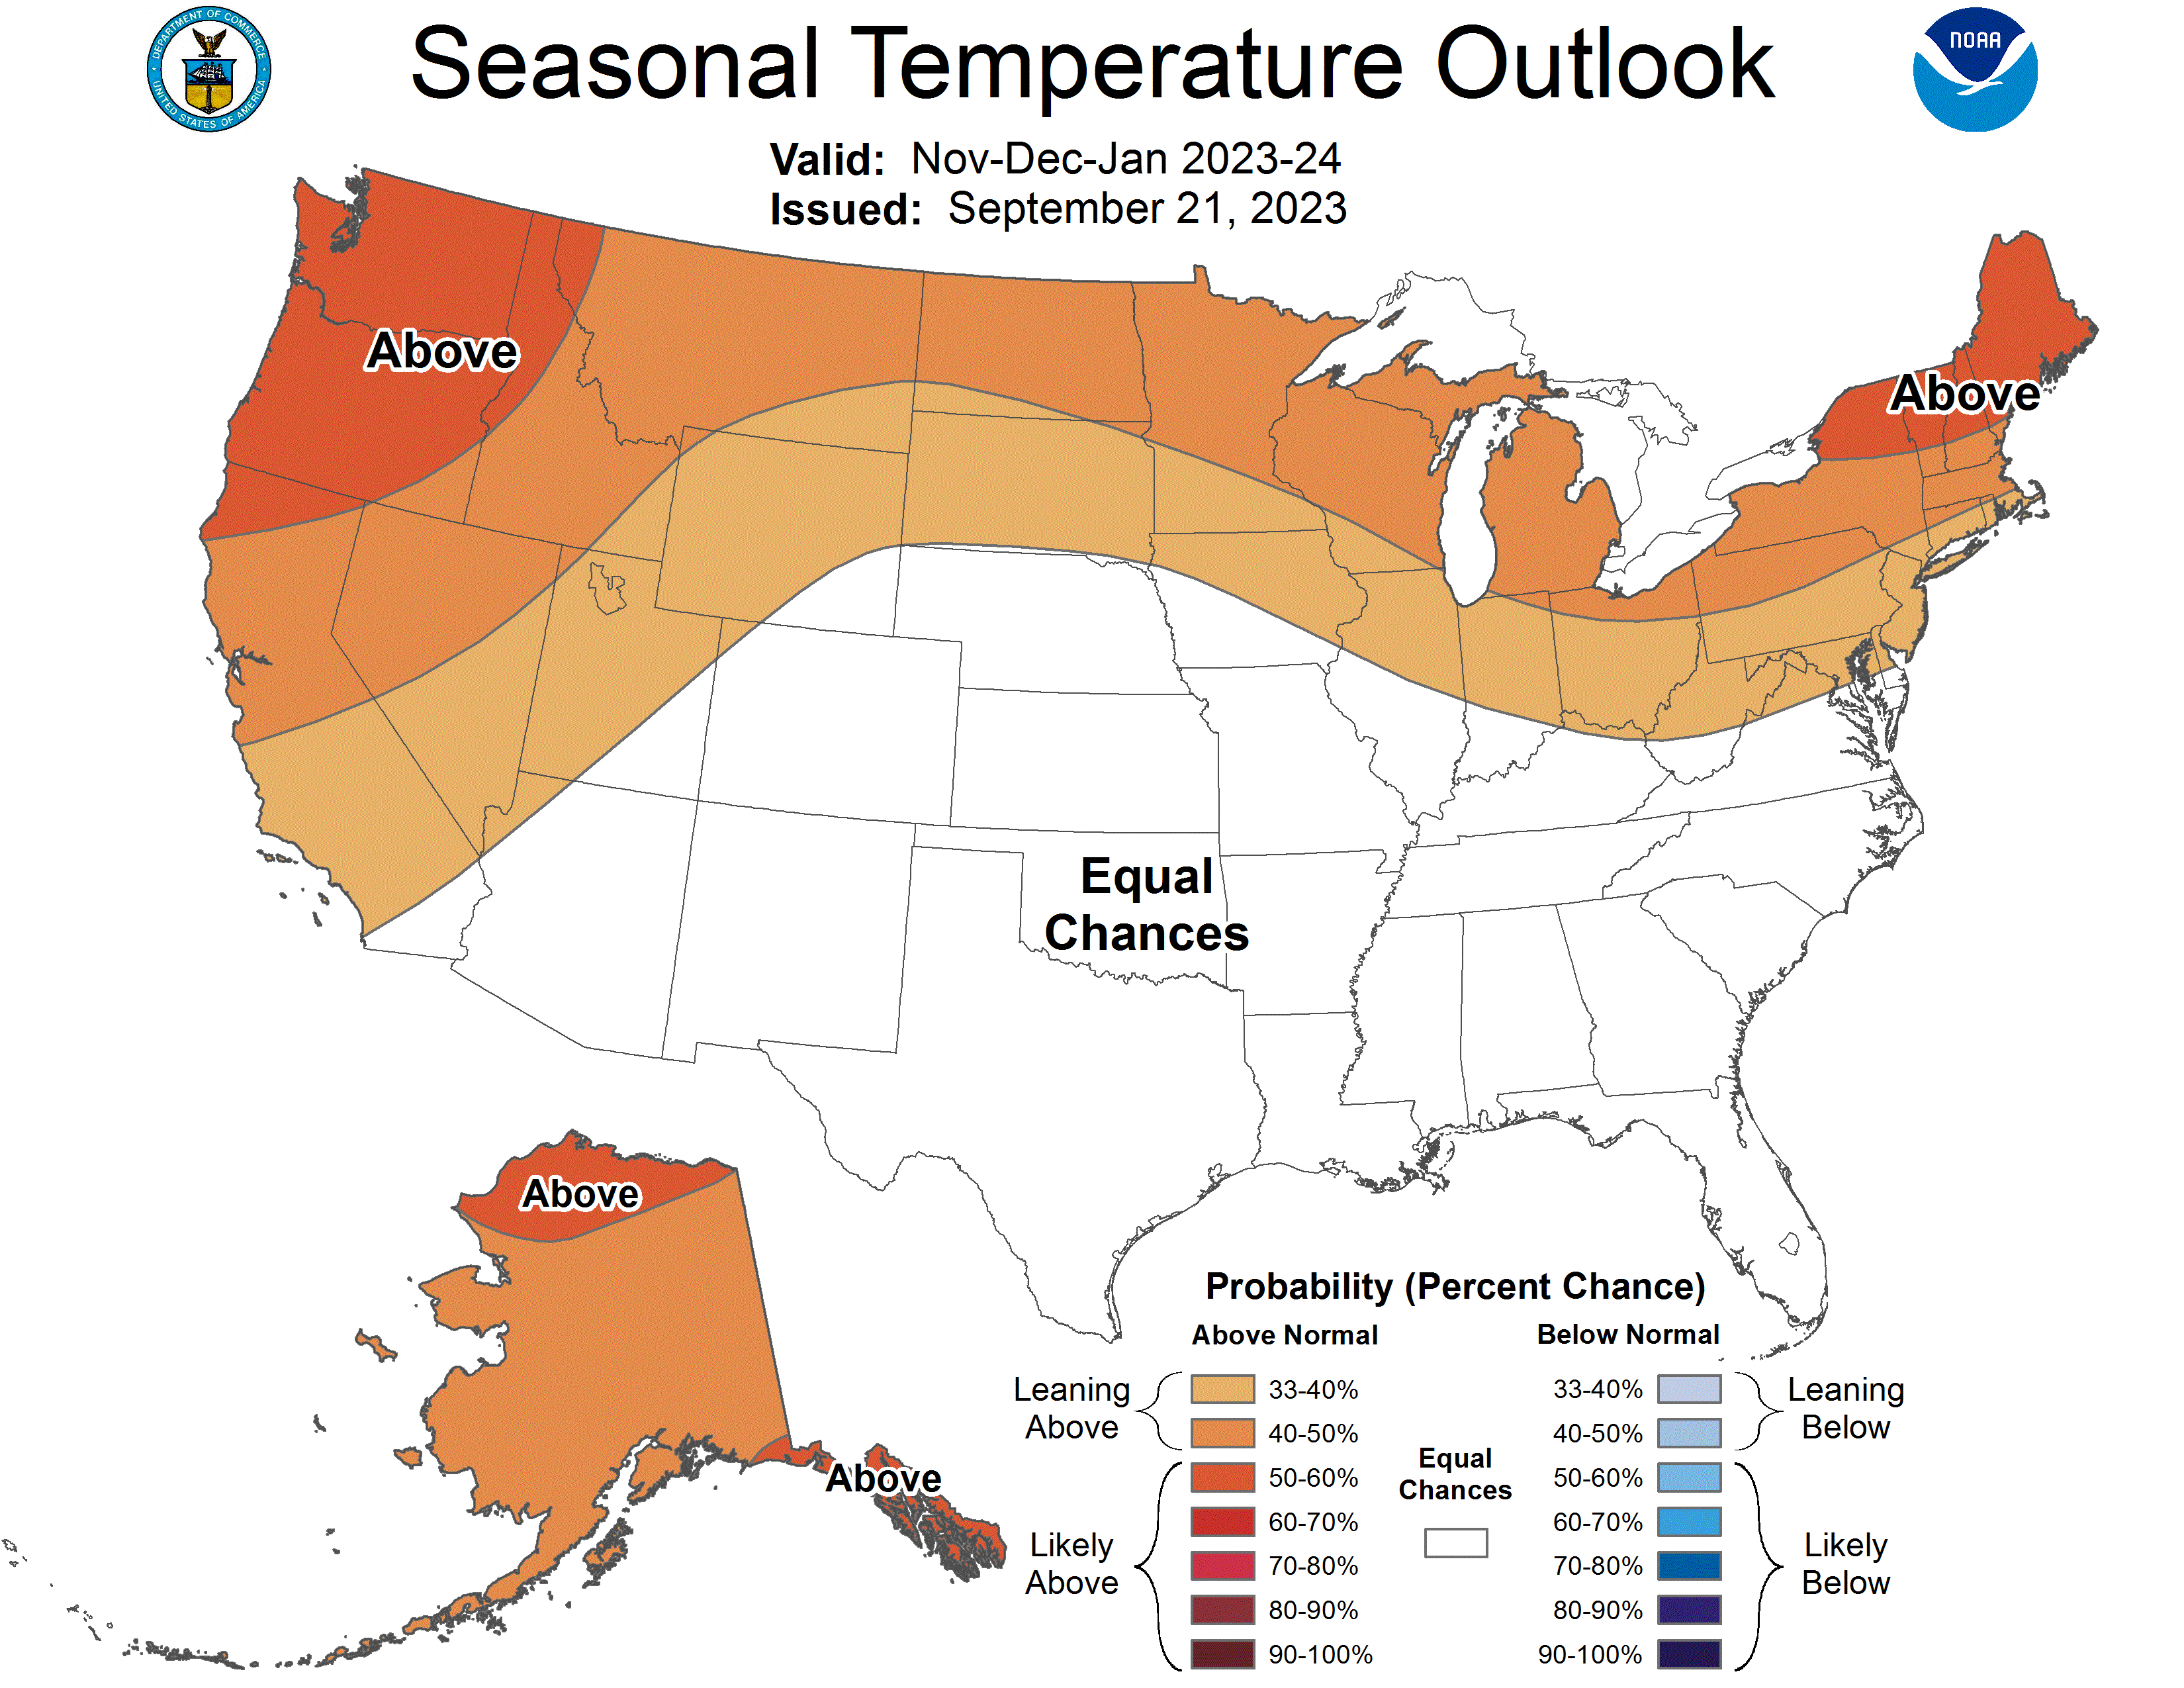
The path of front-month natural gas prices starting in the middle of November will likely be increasingly a function of the outlook for winter weather. Here’s the latest forecast from NOAA for the start of heating season in November-January:
Source: NOAA
As you can see, NOAA is looking for elevated probability of above-average temperatures across the northern part of the country, including much of New England, and pretty much average temperatures elsewhere.
So, the early read is that it’s likely to be a warmer-than-average winter in the US, which is generally short-term bearish for gas demand.
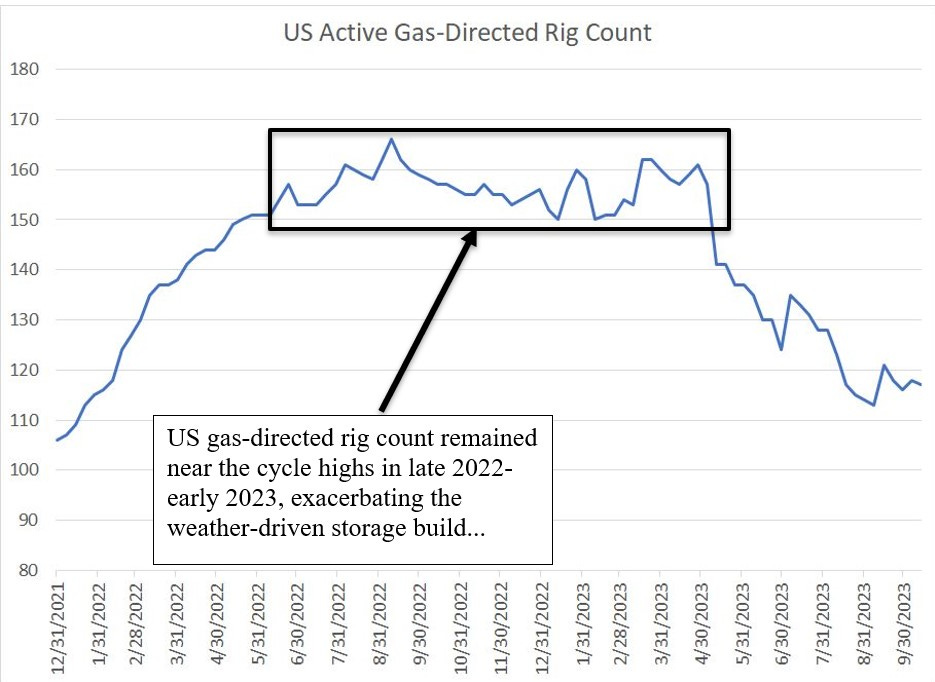
However, balancing that trend, is a plummeting US natural gas rig count:
Source: Bloomberg
As you can see, heading into last winter – 2022-23 – the US gas-directed rig count stood in the 150 to 165 region, up from 105 rigs or so at the end of 2021. That means US natural gas production momentum was strong heading into last winter and, as the weather turned unseasonably warm in January-February, that exacerbated the build in US gas storage that prompted a collapse in front-month prices.
The problem is that producers can’t lay off rigs immediately – it takes time to release rigs from contracts, reduce drilling activity and cut drilling CAPEX. So, while producers did respond the falling gas prices, the actual decline in the rig count and CAPEX didn’t show up until roughly the second quarter of this year.
And, it can also take a few months for a falling rig count, and falling CAPEX, to show up in the form of moderating production growth and an outright decline in output from some basins.
Bottom line: The set-up this winter is very different from one year ago because US gas production momentum has turned negative. That means even if the coming winter brings above-average temperatures or an unusually warm winter like last year – a big “if” indeed – I wouldn’t expect storage levels to spike relative to seasonal norms this winter as they did last year.
Further, just recall that even at the peak in June 2023, US gas storage was in the region of 350 to 370 bcf above the seasonal norm and the outage at the Freeport LNG terminal from June 2022 through mid-March of this year likely “cost” the US around 350 to 400 bcf in exports.
In other words, even with one of the warmest US and EU winters in the past decade, the US gas storage glut can be almost entirely attributed to the Freeport outage alone.
Beyond short-term considerations, recall that several new US LNG export terminals are due for start-up on the Gulf Coast in the second half of 2024 and into early 2025 – this will require increased US production and higher gas prices to supply these new terminals.
Longer term, to incentive adequate gas production to meet both domestic US demand and overseas demand for US LNG will require US gas prices to average $4/MMBtu or higher.
My preference for investing in the gas story remains to buy high-quality US E&Ps with low production costs and significant hedge coverage to protect against the potential for near-term volatility in gas prices due to winter weather conditions. In particular, I look for E&Ps that can generate copious free cash flow with gas in the $4/MMBtu region but “break even” on a free cash flow basis even with prices closer to $3/MMBtu.
This is crucial: I recommend avoiding ETFs like UNG and BOIL unless you’re seeking a short-term trade on gas prices.
And, if you believe (that E&Ps all just follow the path of natural gas prices and ETFs like UNG, I urge you to closely examine this chart:
Source: Bloomberg
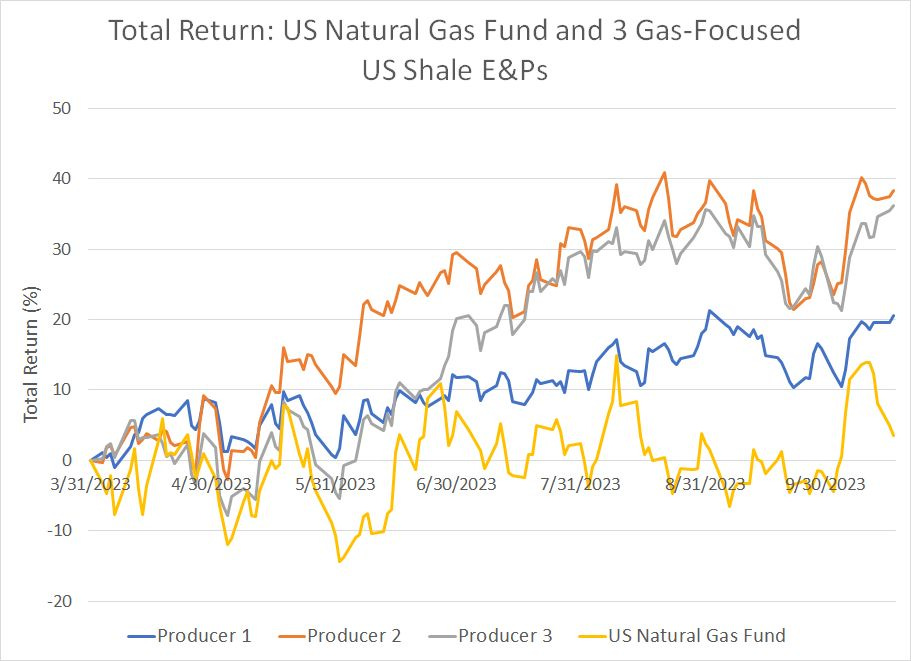
This chart shows the total return — dividends and capital gains — from 3 major US shale E&Ps focused on natural gas since March 31, 2023; which was the nadir for front-month US gas prices so far in 2023 (under $2/MMBtu).
As you can see, UNG is higher since that time, by 3.58%; however, that return is dwarfed by the gains in the 3 gas-focused E&Ps in my chart, up 20.5%, 36.2% and 38.3% respectively.
Also, look at the far right edge of my chart. gas futures prices have pulled back from last week’s highs and the UNG exchange-traded fund has followed suit. However, all three of the producer stocks have either held steady or are starting to break higher from their recent trading ranges.
That’s because, contrary to popular belief, US gas-focused E&Ps do NOT just follow front-month natural gas prices.
Trading action in these stocks is typically not dependent on the outlook for gas prices over the next month or two, but the intermediate to longer-term average expected gas price (the calendar strip).
At risk of appearing to harp on about the gas ETFs and gas E&Ps, I issue this warning for investors because I’m asked about these ETFs so frequently by those looking for a way to play the bullish outlook for gas. In my view, buying these ETFs as a long-term play on the gas price outlook is one of the more dangerous moves you could make
As a special offer for the Orlando Money Show investment conference later this month, I’m offering 60-day free trials to the paid tier of The Free Market Speculator.
The paid tier includes additional market commentary and a model portfolio of specific stock and ETF recommendations..
You can sign up, by tapping the button below.
This offer expires on Friday, November 3rd.
DISCLAIMER: This article is not investment advice and represents the opinions of its author, Elliott Gue. The Free Market Speculator is NOT a securities broker/dealer or an investment advisor. You are responsible for your own investment decisions. All information contained in our newsletters and posts should be independently verified with the companies mentioned, and readers should always conduct their own research and due diligence and consider obtaining professional advice before making any investment decision.