

Natural Gas: Watch the Curve
Natural Gas: Watch the Curve
NatGas prices aren't as weak as you think...

In the April 6th issue of The Free Market Speculator, “OPEC Cuts, Recession and Oil Prices,” I wrote about the outlook for oil prices in light of the cartel’s recent decision to cut production despite a market on track to tighten in the second half of the year.
In a sense, the cartel has created an “OPEC Put” for crude with a strike price near the March lows of $73 to $75 for Brent and $67 to $70/bbl for WTI.
In response to that piece I’ve received a few questions from readers regarding the outlook for natural gas.
After all, if you’re even a casual follower of the US natural gas market, you’ve probably seen some version of this chart over the past few weeks:
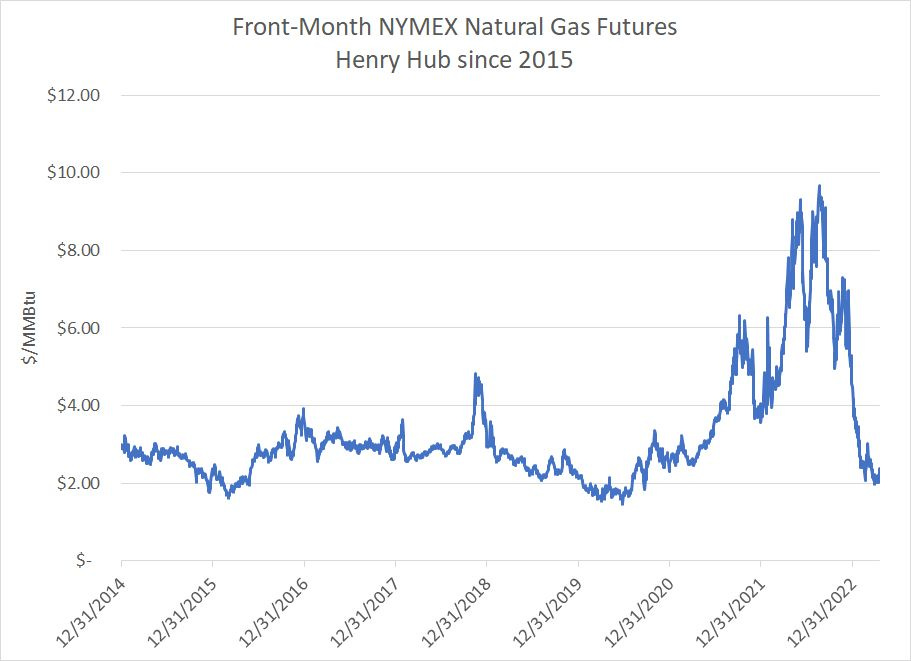
Source: Bloomberg
Benchmark front-month US natural gas futures prices have tumbled from an intraday high near $10/MMBtu in August 2022 to recent lows under $2/MMBtu, a decline of around 80% in just 7 months and more than 55% year-to-date.
For investors the recent dips under $2/MMBtu naturally evoke unpleasant memories of a decade of generally depressed gas prices from 2011 to 2021 and superficially similar crashes for the commodity in 2016 and 2020.
Fortunately, as with so many charts referenced in the financial media, front-month natural gas prices don’t provide the whole story for this market:
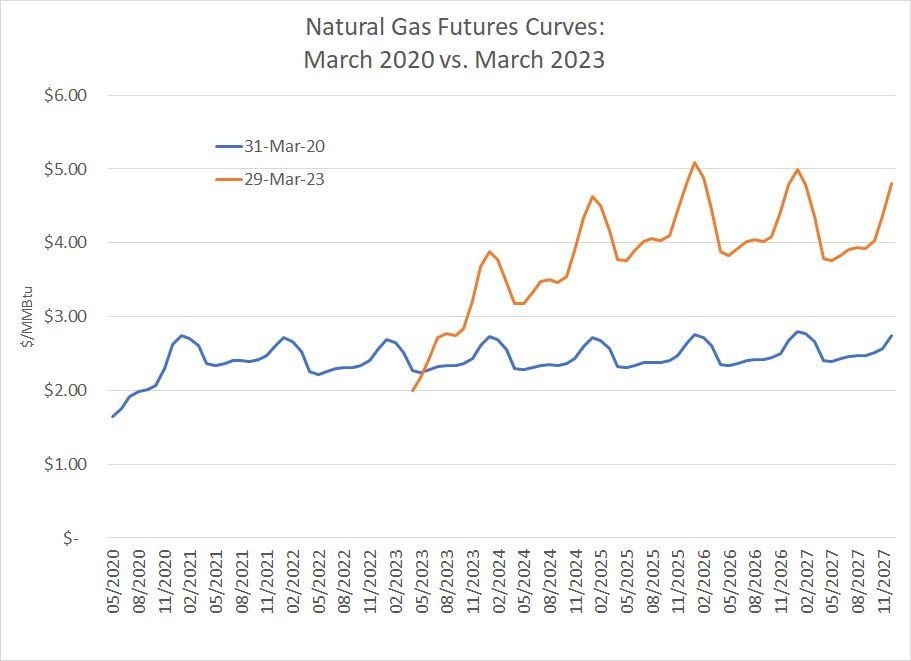
Source: Bloomberg
This chart shows the gas futures market curves on two dates — March 31, 2020 and March 29, 2023. I chose March 29th because it was the NYMEX natural gas April 2023 contract’s last day of trading and the contract settled at a price of around $1.99/MMBtu, below the key psychological threshold of $2.
However, look at the orange line representing the futures curve at the end of last month. Even at the low tide mark for gas this spring, when the April 2023 contract settled below $2, the price of natural gas for delivery in future months was much higher.
Specifically, the price of natural gas for delivery in May 2023 was around $2.17/MMBtu and gas for delivery in December 2023 was $3.68/MMBtu, a full 85 percent above the April 2023 contract.
The chart above shows the prices for every natural gas futures contract for delivery through the end of 2027 – as you can see, gas futures prices are expected to remain relatively low for a few more months, recovering to a range of $3 to $4/MMBtu in 2024 and then $4 to $5/MMBtu from 2025 through 2027.
Of course, natural gas is a seasonal commodity with demand highest in the winter months when demand for gas heat surges; however, the price of gas for delivery from the end of 2024 through December 2027 averages close to double where it traded yesterday below $2.20/MMBtu.
Contrast that with the blue line on the same chart.
This is the gas futures curve on March 31, 2020, the last time front-month gas prices were under $2/MMBtu. As you might recall, this was the height of the COVID lockdown panic when commodity prices were getting crushed and oil briefly saw negative pricing.
As you can see, the shape of the curve three years ago is far different than today.
While the front of the curve was depressed and under $2/MMBtu much like late March, futures didn’t reflect much of a recovery for years into the future. Indeed, as of the end of March 2020, the average price of gas for delivery between January 2021 and December 2027 was just $2.47/MMBtu.
If you’re trading front-month gas futures or an exchange traded fund (ETF) like the US Natural Gas Fund (UNG), or the BOIL leveraged fund I wrote about in “3 Reasons NOT to Buy BOIL,” gas futures contracts due to expire over the next few months are of crucial importance.
That’s because the only thing that will drive pricing for the current front-month May 2023 gas futures contracts is factors that impact supply and demand conditions for natural gas over the next six days (this contract’s last trading day is April 26th).
However, for gas producers – exploration and production (E&P) companies focused on producing and selling natural gas -- the price of the front-month gas futures contract is close to irrelevant.
That’s the case for two simple reasons. First, a company that produces gas does not sell all their gas production in a single month of the year, so realized prices for gas in late 2023 are just as important as the front month in terms of driving free cash flow and earnings.
Second, most US natural gas E&Ps hedge a significant quantity of their expected future production using swaps or options. Typically, companies layer in hedges over time, meaning they’re more heavily hedged for the next few quarters and then coverage drops for the second half of 2023 and into early 2024.
Thus, many of these producers are selling very little gas at current spot or front-month futures prices. The majority locked in prices for a sizable portion of their Q1 2023 and Q2 2023 production late last year when forward pricing for gas was much more attractive.
Even today, with front month gas prices still down sharply year-to-date, the futures curve suggests an E&P looking to hedge planned production for January 2024 could likely lock in prices closer to $3.80/MMBtu, the current price of January 2024 futures.
Simply put, while the front month gas price today isn’t much higher than it was three years ago amid the historic COVID commodity rout, the futures curve is much healthier today from a producer’s standpoint.
That’s because three years ago, markets saw little long-term improvement in gas prices and the futures curve was flat for years into the future. Today, a producer isn’t really facing sub-$2.50/MMBtu gas price for much, if any, of their planned 2023 production and could likely lock in much more attractive pricing for 2024 using hedges.
Fundamentals Behind the Curve
The reason the futures curve looks so different today in comparison with 2020 is that the drivers of the 2023 gas price collapse are largely cyclical and short-term in nature and the future looks far brighter.
There are two main reasons US gas prices are so depressed right now: Weather conditions in the US this past winter and the fire at the Freeport LNG export terminal back in June 2022.
Let’s start with the weather:
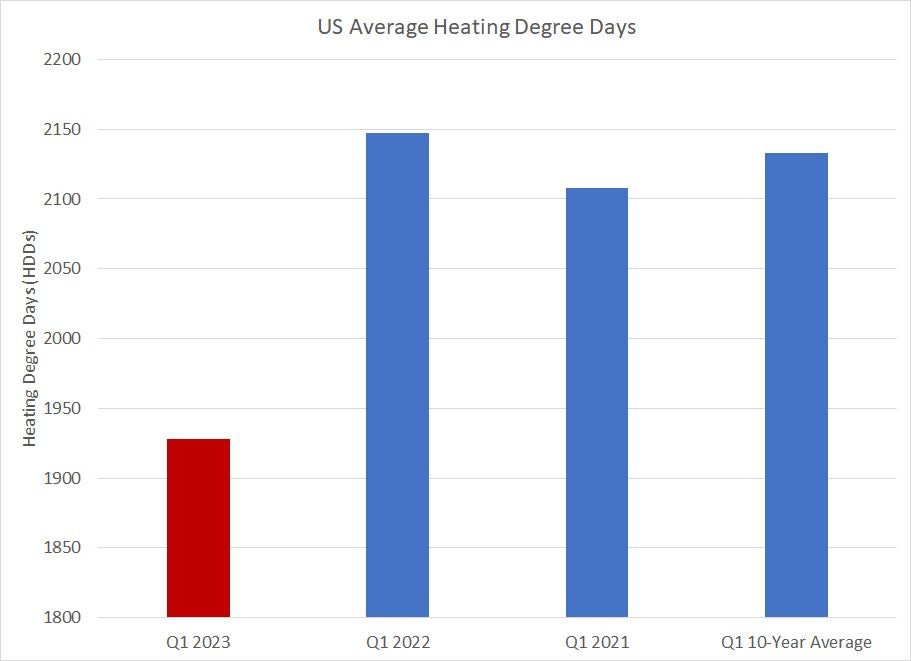
Source: Energy Information Administration Short-Term Energy Outlook
According to the Energy Information Administration’s latest Short-Term Energy Outlook, average heating degree days (HDDs) for the US as a whole in the first quarter of 2023 are expected at 1,928 compared to 2,147 in Q1 2022 and a 10-year average of 2,133.
A heating degree day compares the mean daily temperature to a baseline of 65 degrees Fahrenheit; for example, a mean daily temperature of 30 would yield 35 HDDs. The higher the HDDs for a particular season, the colder the weather and the higher gas demand for heating. Of course that includes both direct heat in homes and businesses as well as electric heat; electricity generation accounts for 37% of US gas demand.
The first quarter of each year is far and away the most important for US gas demand – in Q1 2022 the EIA estimates US gas demand was 104.83 bcf/day compared to 101.59 bcf/day in Q1 2023. That’s a difference of about 3.25 bcf/day or almost 300 bcf of “lost” demand in Q1 2023 compared to the same period one year ago.
The second issue was the fire at the Freeport LNG export terminal in Texas last June, which forced the facility to remain off-line from roughly June 8, 2022 through late February 2023:
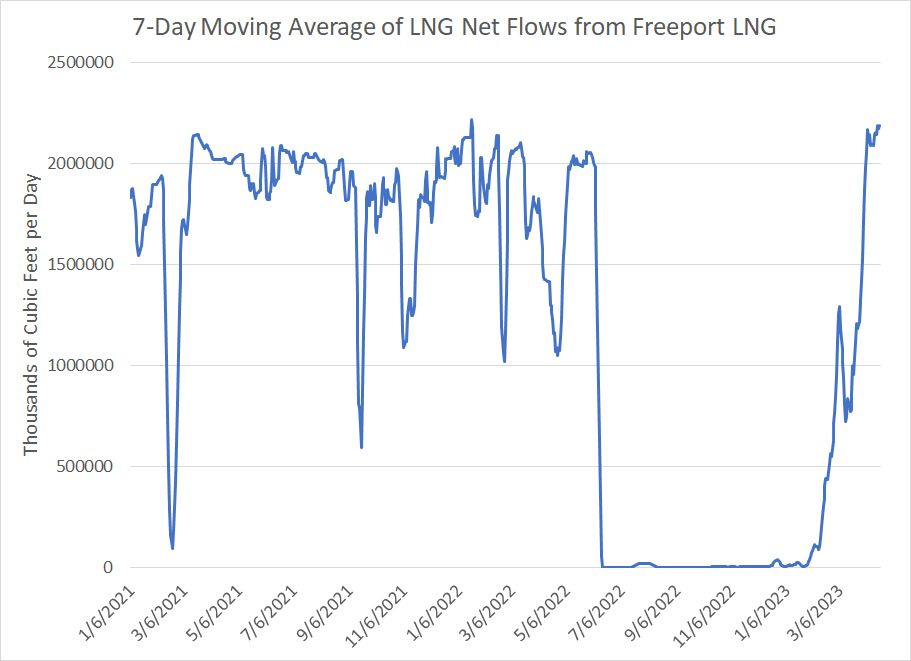
Source: Bloomberg
Bloomberg uses pipeline data to estimate net exports from the Freeport LNG facility on daily basis and this chart presents the data since the end of 2020. To filter out some of the noise, this chart shows the 7-day (one-week) moving average.
As you can see, Freeport normally exports around 2 bcf/day of US gas to overseas markets; however, following the fire last June exports collapsed to zero for months. In total this cost the US 400 to 500 bcf in natural gas exports between June of last year and March of 2023.
Summer is Coming
Those two factors — lost demand due to warm weather in Q1 2023 and lost exports from the Freeport fire — add up to 700 to 800 bcf of excess gas supply. Yet, as of the most recent data from EIA, US natural gas storage is only about 316 bcf above the 5-year average and 234 bcf above the 10-year seasonal norm.
In short, near-term weakness in gas prices doesn’t reflect the long-term supply and demand outlook, rather it’s the consequence of two short-term factors that have hit demand and increased supply. The market sees this as well, which is why it’s only the natural gas futures contracts expiring through this autumn that are trading at depressed prices.
The US (and EU) winter heating season is now ending and we’re entering a shoulder season for gas demand in spring.
However, summer is coming:

Source: Bloomberg
This chart shows estimates from Genscape regarding the amount of gas burned in the Lower 48 States to produce electricity. Once again, I’ve presented the 7-day moving average to render the data a bit less noisy.
Like heating, electric demand for natural gas is seasonal though it’s the summer months that represent peak gas demand from power generators.
Two points to note about this chart.
First, while we’re currently in a seasonal lull for power generation, the three circles in my chart show that gas demand has been making higher lows over the past few years during this shoulder period.
Second, there’s a higher high in gas demand in the summer of 2022 compared to the summer of 2021 due, in large part, to the warm summer across the US last year that drove a jump in cooling demand.
If we do get a hot summer again this year, look for gas demand to be even stronger than 2022 because prices are so much lower heading into this summer than was the case last year. That makes the fuel more attractive as a source of power from an economic perspective.
Add in the return to service of the Freeport LNG export facility and the projected start up of the massive Golden Pass LNG terminal in 2024 and it’s not difficult to see why the gas futures market anticipates a significant recovery in prices over the coming 12 to 18 months.
DISCLAIMER: This article is not investment advice and represents the opinions of its author, Elliott Gue. The Free Market Speculator is NOT a securities broker/dealer or an investment advisor. You are responsible for your own investment decisions. All information contained in our newsletters and posts should be independently verified with the companies mentioned, and readers should always conduct their own research and due diligence and consider obtaining professional advice before making any investment decision.