

Not a Normal Bull Market
Not a Normal Bull Market
The narrowest equity market leadership in history

Editor’s Note: This week I’m making some important changes to the model portfolio in the paid tier of FMS including the partial sale of one recommendation and the addition of a new industrials stock and fixed income exchange-traded fund (ETF) recommendation.
The new ETF addition tracks an often-overlooked corner of the bond market that’s handily outperforming most fixed income ETFs right now and offers a yield in the 5.5% range.
I’ll also walk you through some of my selection criteria for fixed income ETFs that I’ll be using in my upcoming fixed income ETF report.
If you’re not yet a paid subscriber to FMS, I’m still offering 30-day free trials to the service by tapping here:
Thanks for reading.
—EG
Over the past several weeks, I’ve written a good deal about stock market breadth.
While market capitalization weighted indices such as the S&P 500 and Nasdaq 100 have delivered strong gains since late 2022, those gains are top-heavy, the result of powerful rallies in a small number of the largest index constituents.
Thursday February 22nd is a prime example: The S&P 500 soared 105.23 points (about 2.11%) following NVIDIA’s (NSDQ: NVDA) strong quarterly earnings and upbeat guidance. However, NVDA alone accounted for a whopping 32.6 of those index points (almost 31% of the total point gain on February 22nd).
On the same session, the 5 biggest gainers in S&P index point terms generated 54% of the total index gain and the top 10 accounted for two-thirds of the total.
More broadly, the S&P 500 was up about 7.1% year-to-date through the close on Thursday 22nd and an unprecedented 27.4% of that gain was due to NVDA alone. The top 10 stocks in terms of S&P 500 contribution have comprised 72.9% of the total index gain year-to-date.
And just look at this:
Source: Bloomberg
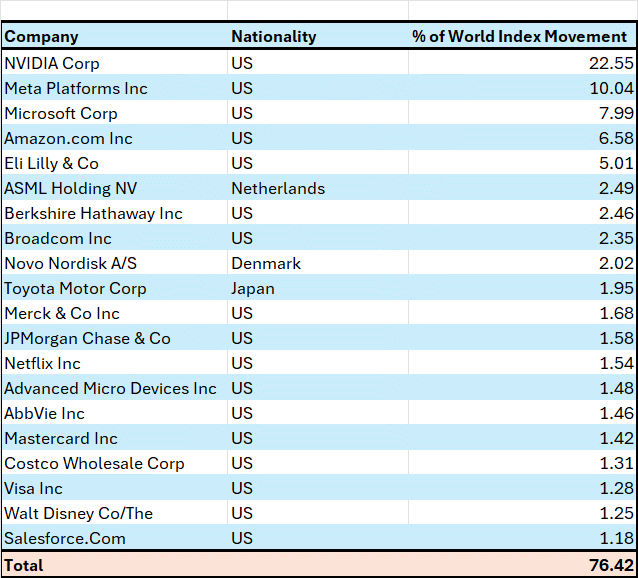
The Bloomberg Developed Markets Large & Mid Cap Price Return Index tracks the performance of stocks from across the developed world. There are 1,406 stocks in the index, it’s weighted by market capitalization, and has total capitalization of $62.34 trillion.
This table shows the 20 largest contributors to this index’s 5.2% total return year-to-date in 2024. As you an see these 20 stocks account for 76.4% of that total return and 17 of them, including the 5 biggest, are American companies.
NVDA alone accounts for over 22.5% of all gains from equities this year worldwide.
This level of concentration is unusual to say the least:
Source: Bloomberg
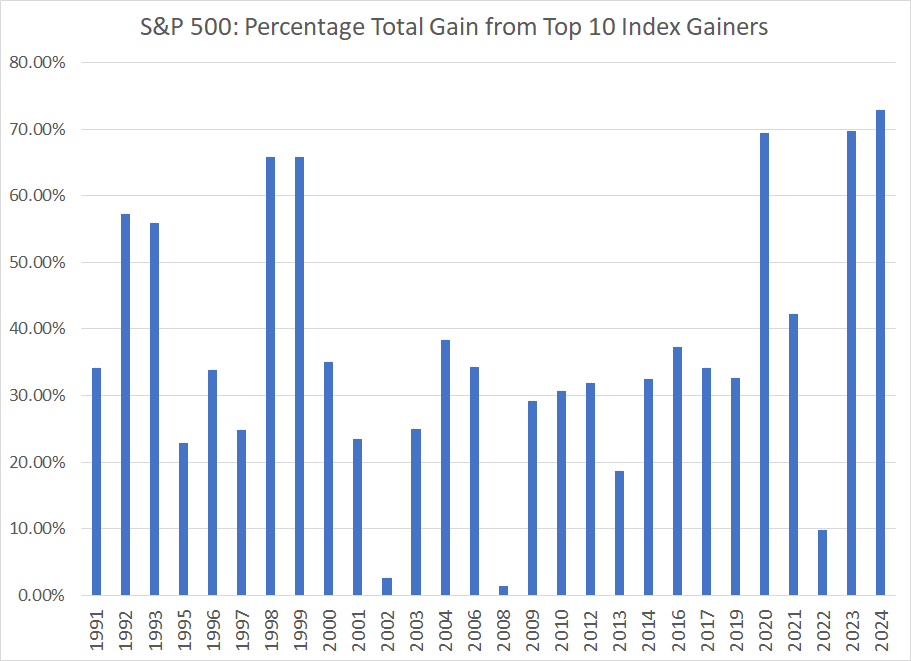
To create this chart, I examined all calendar years since 1990 when the S&P 500 rose or sold off by more than 7.5% -- that’s all but 6 years over this period.
For each of these years, I looked at the total point gain for the S&P 500 and the 10 index components that contributed most to each year’s gain. The blue columns above show the percentage of the S&P’s total point gain attributable to these top 10 components. I have also included the above-referenced data for year-to-date 2024 for comparison.
The average for all years in my chart, excluding year-to-date 2024, is about 35.5% -- in an average year the 10 S&P 500 stocks that add the most to the year’s gains account for a bit over one-third of the index total.
As you might expect, in bear market years like 2002, 2008 and 2022 the ratio is low. That’s because when the broader market is down significantly, there are relatively few index components that rise in value and gains from those winners tend to be modest.
On this basis, 2023 was the narrowest rally for the S&P 500 since at least 1991 – while the index jumped more than 26%, a whopping 69.8% of the S&P’s total point gain was down to just 10 stocks. Microsoft, Apple and NVIDIA alone underpinned more than a third of the market’s total gains for the year.
There are only three other years on my chart that can compare to 2023 – 1998, 1999 and 2020. The first two represent the height of the late 1990’s dot-com and Nasdaq Bubble; the 1998-99 melt-up ended in a nasty bear market between 2000-02 that erased all of those gains and then some.
Of course, the 2020 precedent is less ominous: The stock market rallied 31.5% in 2019, 18.4% in 2020 and a whopping 28.7% in 2021 before finally seeing a significant (18.1%) decline in 2022.
Not all narrow-breadth market rallies are immediately followed by a crash.
However, lopsided rallies of this magnitude do render the stock market vulnerable to a significant correction or pullback. They’re also characteristic of a late-stage bull market, the final surge in the broader market averages before the start of a bear market.
For example, in the final two years of the bull market that led to the March 24, 2000 peak, just 10 components of the S&P 500 accounted for just shy of two-thirds of the S&P 500’s more than 41.6% gain. And, in the two years leading up the S&P 500’s January 3, 2022 peak, just over half of market gains were driven by just 10 components.
In contrast, it’s highly unusual for new bull markets to start with such extreme, narrow breath. For example, in the first two years of the 2002-07 bull market the top 10 S&P constituents only generated some 25% of the market’s total gain.
This was true even back in the 1990s:
Source: Bloomberg
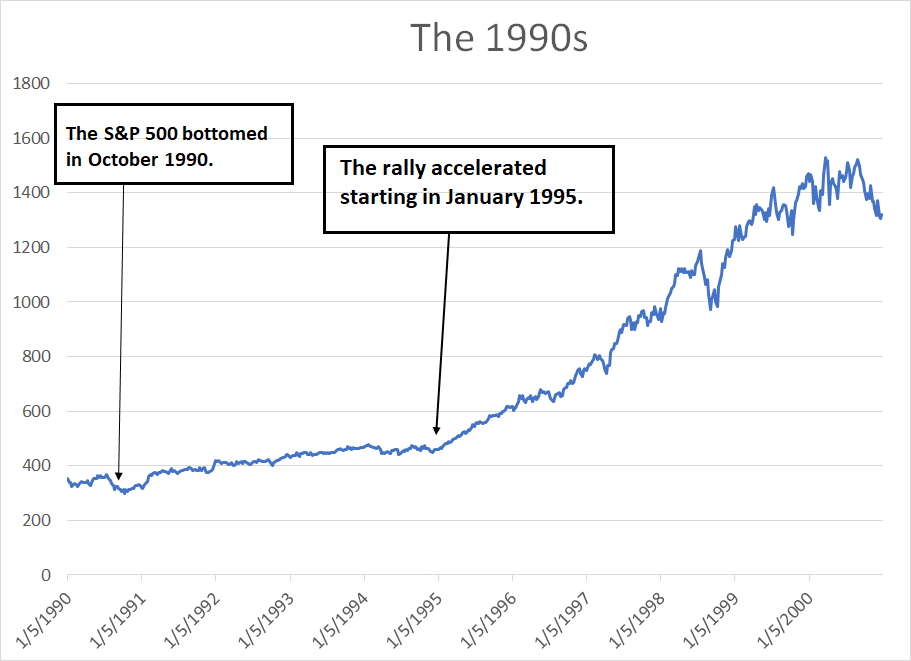
As you can see, the great bull market of the 1990s started in October 1990 when the S&P 500 bottomed following a bear market associated with the 1990-91 recession.
The index then entered a shallow advance from October 1990 through early February 1994. A series of Fed rate hikes pushed the upper bound of the Fed Funds target from 3% at the beginning of ’94 to 6% by early 1995; the S&P 500’s bull market then stalled, and the index returned just 1.35% in 1994 with all gains resulting from dividends paid by index constituents (the S&P 500 was lower on a price-only basis).
The S&P 500’s record-setting rally in the 1990s started in January 1995. In the first two years of that advance, the S&P 500 jumped 67.8% and only 25% of those gains were the result of the top 10 index constituents – most stocks in the S&P 500 were higher and strength was broad-based.
It wasn’t until the end of the great 90’s bull market circa 1998 that market breadth began to narrow, finally ending with a very narrow advance in the months leading up to the year 2000 market peak.
Contrast that history with the market rally since the October 12, 2022 market lows when just 10 stocks have driven almost 55% of the total index point gain.
That’s not normal, at least not for the early stages of a bull market.
And that brings me back to this:
Source: Bloomberg
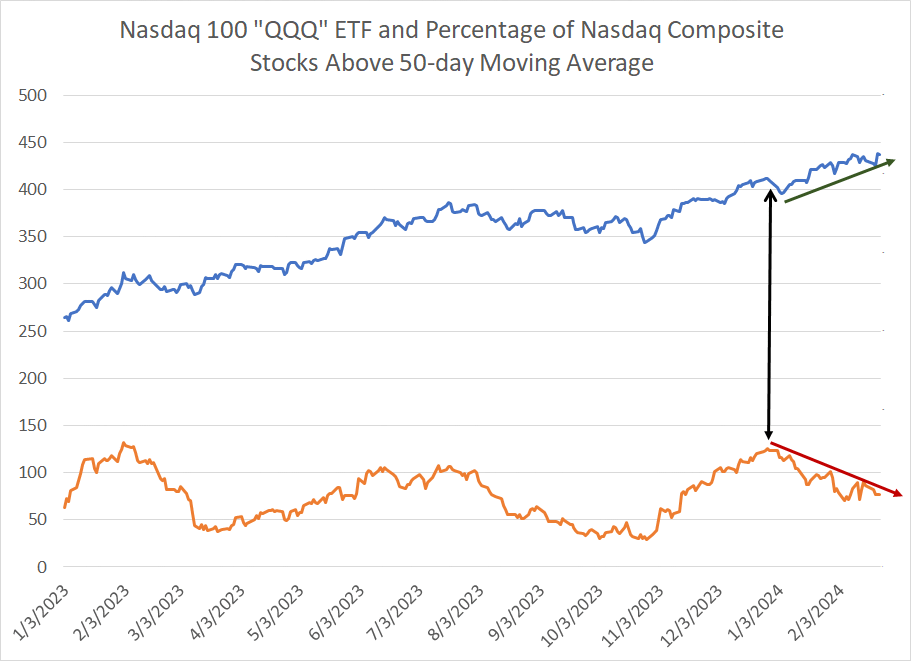
This chart shows the Nasdaq 100 “QQQ” ETF as a blue and the percentage of stocks traded on the Nasdaq Exchange trading above their 50-day moving average as an orange line.
As you can see, the QQQ is up significantly since late December, however the portion of Nasdaq stocks in an uptrend on this basis is down from a high over 75% to around 50% in recent days.
Sometimes it can take time for deteriorating breadth to result in meaningful downside for the broader market. Last summer for example, breadth began rolling over about 2 months before the market experienced meaningful downside in August-October. Such appears to be the case right now as well. However, I continue to believe caution is warranted in the near–term – with fewer and fewer stocks supporting the rally, particularly in the Nasdaq, it remains vulnerable to a correction.
The Broadening
Two additional points are worth noting.
First, it remains unlikely any broader market correction over the next few weeks would represent the absolute peak of the rally.
In the latter stages of bull markets, the S&P 500 typically experiences multiple 5% to 10% correction before reaching the absolute peak. The end of the great 1990s bull market offers a classic example:
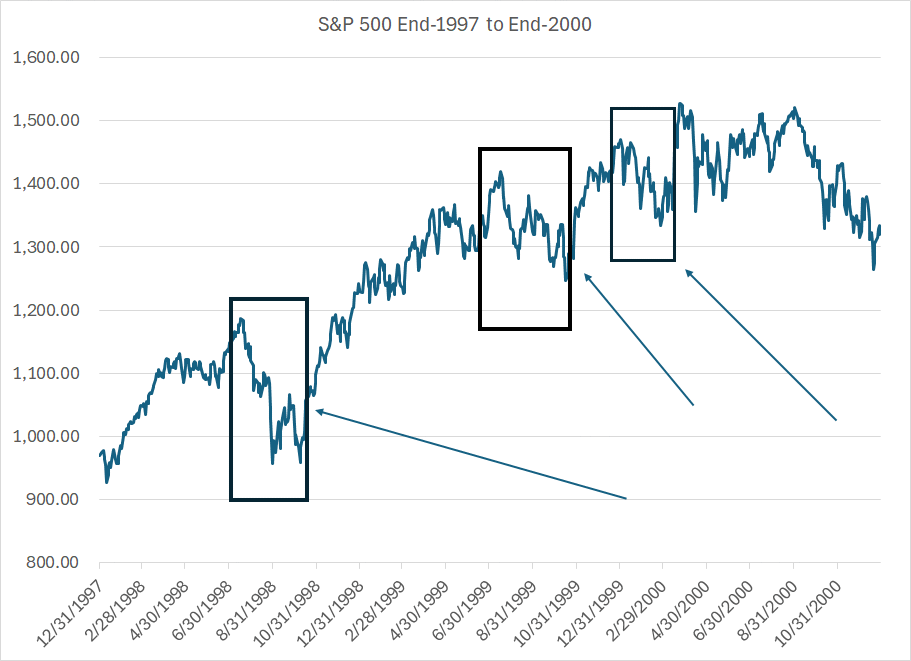
Source: Bloomberg
There’s an old saying that holds market tops are a process while bottoms are an event.
Fear is a sharper, more intense emotion than greed. So, bottoms tend to take the form of a short, sharp sell-off and a spike in market fear signaled by indicators like the S&P Volatility Index (VIX) while tops tend to take the form of multiple rallies punctuated by sharp corrections and sell-offs before the final peak.
The second point: I continue to see some tentative signs of a broadening out.
Sectors, markets and industry groups outside the US growth heavyweights that dominated returns last year are beginning to flash signs of strength:
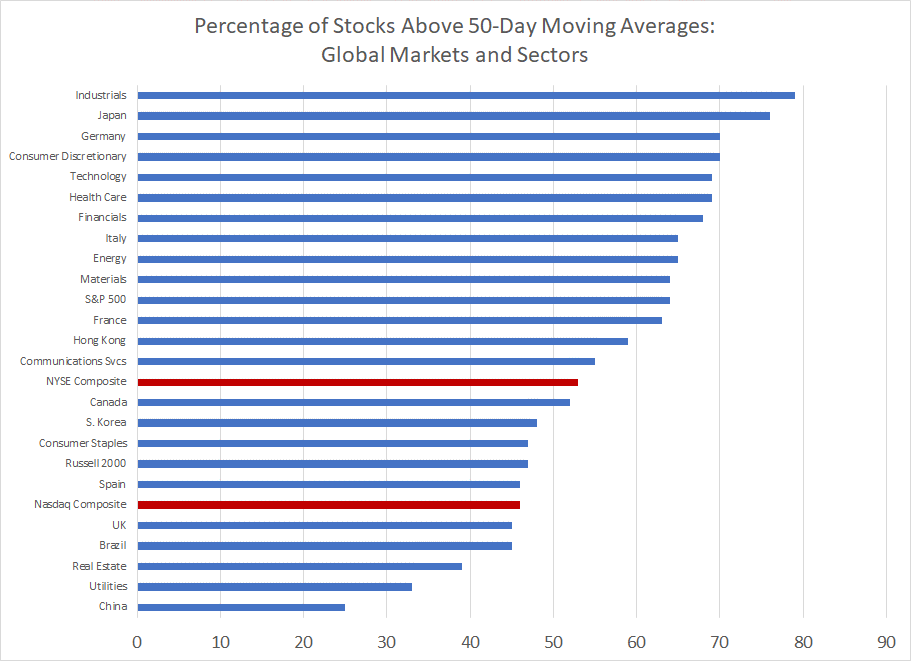
Source: Bloomberg
This chart shows the percentage of stocks trading above their 50-day moving average for all sector indices in the S&P 500 as well as for select global markets. I’ve highlighted the bars for the NYSE and Nasdaq Composites in red such that any indices located above these red bars are showing stronger breadth on this basis.
Granted, this is far from the last word on market breadth and there are multiple other factors at work; however, groups like the S&P 500 Industrials and Japan’s Nikkei 225 are up this year supported by a broad number of constituent stocks.
That’s a sign of underlying strength that’s been sorely missing from the S&P 500’s advance since late 2022.
With these points in mind, I’m making some adjustments to the model portfolio this week:
Actions to Take
Keep reading with a 7-day free trial
Subscribe to The Free Market Speculator to keep reading this post and get 7 days of free access to the full post archives.