

Oil Bears Everywhere
Oil Bears Everywhere
How to gauge oil market sentiment

On October 16, 2008 The New York Times published an opinion piece written by billionaire investing legend Warren Buffett titled “Buy American. I Am.”
Investors of a certain vintage will recall it was the height of the 2007-09 financial crisis and Great Recession, just over a month following the bankruptcy of Lehman Brothers. The US was clearly in recession with the US shedding more than 400,000 jobs in the month of September alone; the S&P 500 plummeted almost 39% from its highs in October 2007 to the market close on October 16th, 2008.
In his Op-Ed, Buffett noted the scary headlines, predicted unemployment would rise further and envisioned further declines in business activity; yet, he also stated he’d been buying American stocks.
His buying was based one simple investment rule:
“Be fearful when others are greedy and greedy when others are fearful.”
In other words, sentiment regarding the economy and residential housing in the fall of 2008 was already negative, investors were bearish and stock prices were already discounting a great deal of bad news for corporate earnings. Buffett reasoned widespread panic at the time presented an opportunity to buy quality stocks at good prices.
The outlook was likely to be brighter over the long haul, but by the time the economic news improved, stocks would be trading at much higher prices.
As Buffett put it: “If you wait for the robins, spring will be over.”
Buffett’s piece was a classic contrarian call.
The rationale is pretty simple. When sentiment is bearish on a particular market or commodity that usually means the price is already factoring in a great deal of bad fundamental news and there are few sellers left to flee. At the same time, when sentiment turns, you’re likely to have plenty of bears caught on the wrong side of the market, looking to increase their exposure.
As it turned out, the market had further to fall in the months after Buffett’s Op-Ed — from the close on October 16th to the ultimate closing low on Match 9, 2009, the S&P 500 fell an additional 27.4% . However, over the long haul his call proved prescient with the S&P 500 up 29.3% in the two years following that article and over 100% in the ensuing 5 years.
You may have also heard of an infamous title that appeared on the front cover of BusinessWeek magazine back on August 13, 1979: “The Death of Equities: How Inflation is Destroying the Stock Market.”
To be fair, BusinessWeek was at least half correct in the short-term — the S&P 500 traded roughly sideways for 3 years after that article was published and inflation remained elevated, reaching a peak of 14.8% in March 1980.
However, the BusinessWeek’s cover was late to the bear party — an investor who bought stocks on August 13, 1979 would have enjoyed gains of 398.9% over the ensuing 10 years (more than 17% annualized) as inflation receded to below 5% by the end of the 1980s.
The contrarian rationale makes logical sense and there are myriad examples in history of successful contrarian investors; yet, there’s one glaring problem:
How Do We Measure Sentiment?
When, exactly, are investors too bearish?
I know it might seem obvious investors were bearish in the periods I’ve just outlined; however, these are all examples selected with the benefit of hindsight. It’s more difficult to judge sentiment in real time.
For the stock market as a whole, I’m not convinced sentiment is bearish enough at this time to mark a true, durable low.
I know some will argue that point and, to be fair, there are signs of mounting negativity such as the proliferation of bears in the American Association of Individual Investor (AAII) surveys:
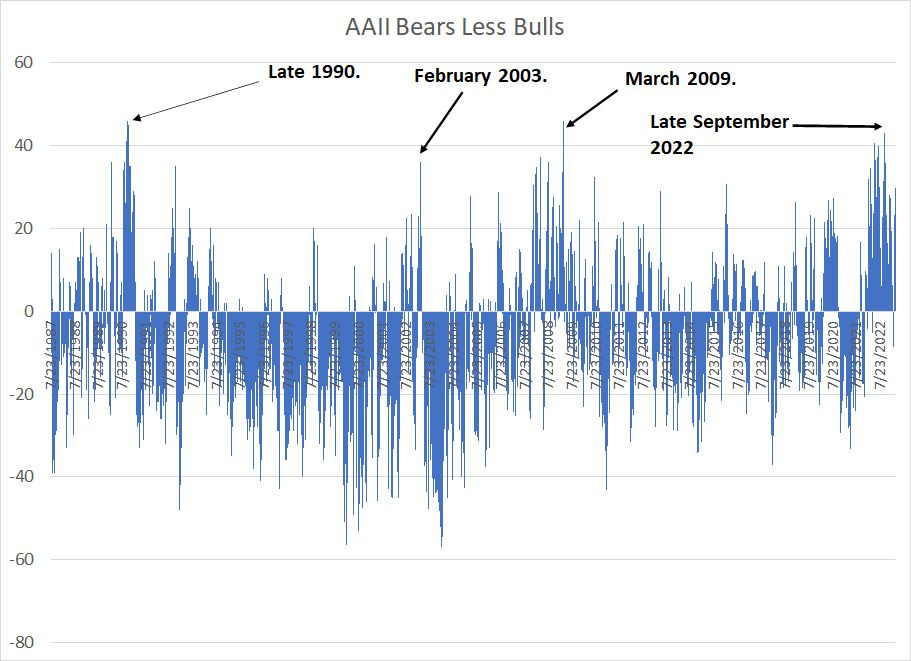
Source: Bloomberg
This chart presents the results of a survey of individual investors asked for their sentiment towards stocks over the next 6 months. The bars represent the total percentage of bears less the percentage of bulls — a high number indicates a proliferation of bearish sentiment.
When this indicator spikes to around 35% to 40% it’s often a sign an important market low is near. Indeed, all the dates labeled on my chart — late 1990, early 2003 and March 2009 — all proved solid buying opportunities for the broader market. We reached a similar level of bearishness in the AAII survey in late September of last year.
However, the S&P 500 is still expensive by any historic yardstick despite the decline since early 2022.
In the March 16th issue of The Free Market Speculator, “Stagflation and the Coming Lost Decade,” I examined the Cyclically Adjusted Price to Earnings (CAPE) ratio, a measure of market valuations created by Professor Robert Shiller of Yale University.
Simply put, as of the end of February, the S&P 500 traded at a CAPE of 30.4 times compared to 16.4 times in October 2008 when Warren Buffett penned his “Buy American” Op-Ed, 9.13 times in August 1979 when BusinessWeek predicted the “Death of Equities,” and 21.2 times in February 2003 when the market was finally in the early stages of a recovery from the “Tech Wreck” years.
If investors are so bearish right now, then why is the S&P 500 trading in the 95th percentile in terms of CAPE valuations based on monthly data since January 1881?
However, there is one sentiment and positioning metric I’ve found particularly useful over the years for commodity markets and it’s currently flashing a bullish contrarian signal for crude oil:
Commitment of Traders
Every Friday afternoon the Commodity Futures Trading Commission (CFTC) releases its Commitment of Traders (CoT) report, which reports data on futures market positions held by different categories of traders across multiple markets.
The data is not released in real time. For example, the most recent data from CFTC, released last Friday afternoon (March 24th), covers futures market positioning as of Tuesday March 21st.
This year, CoT data has been subject to even longer lags.
Back in late January, a group of hackers attacked ION Trading UK, a derivatives trading software firm. This delayed reporting of information from futures market participants that underpins weekly CoT reports. As a result, this series was unavailable for weeks; CFTC finally caught up on all delayed CoT reports just last week.
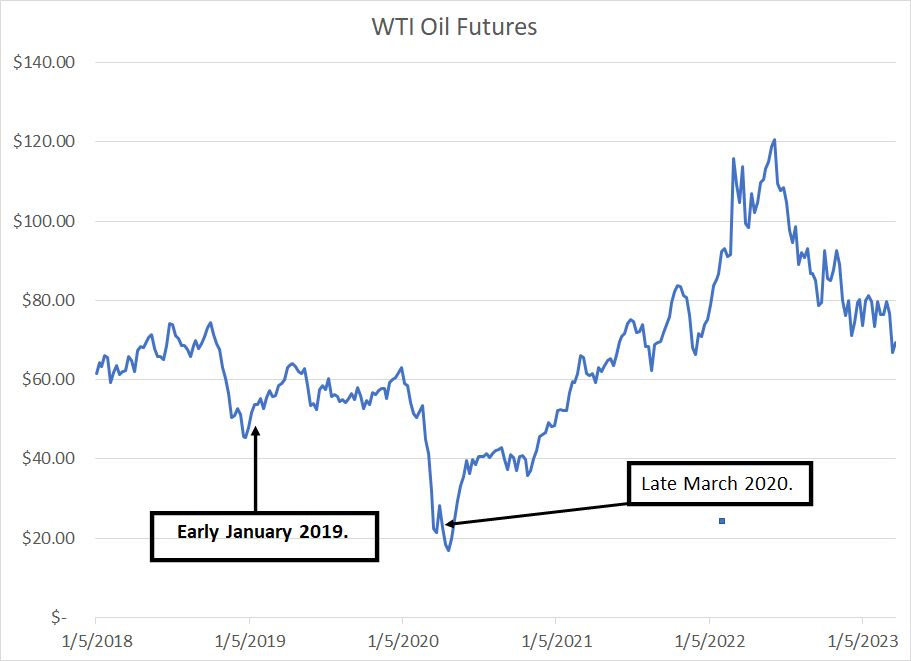
What I found most interesting in that release was the hefty short position in West Texas Intermediate (WTI) crude oil futures.
Take a look:
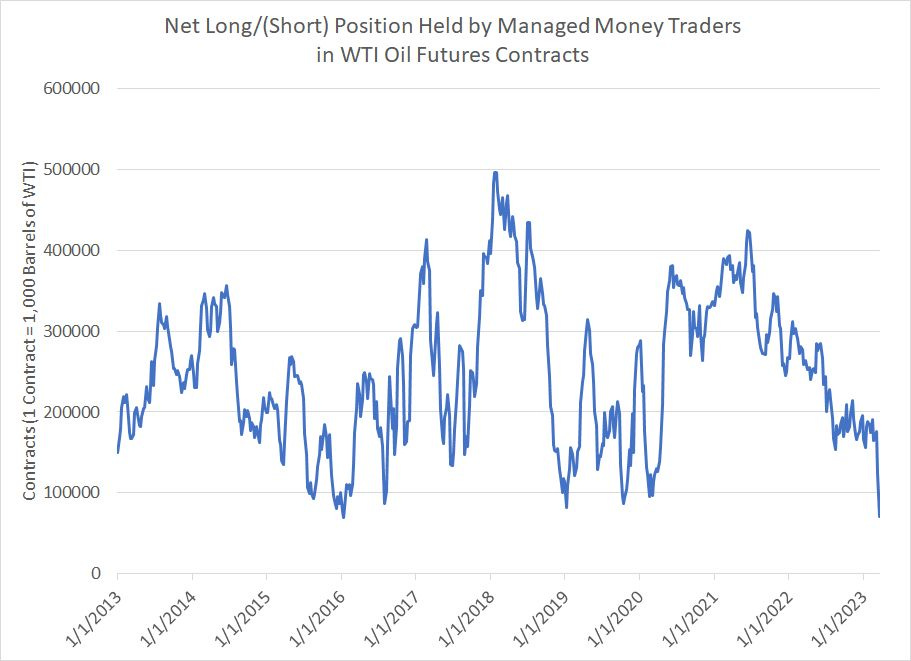
Source: Bloomberg
This chart shows the net position of managed money traders in the NYMEX WTI oil futures market. The data includes both futures and options positions quoted in terms of net contracts long or short (negative number).
Each WTI oil futures contract covers 1,000 barrels of oil so, for example, if traders are net long 250,000 contracts that means they’re net long futures covering about 250 million barrels of crude oil.
There are multiple categories of trader participating in the crude oil futures market. For example, you have companies looking to hedge their exposure to oil prices — examples would include producers looking to sell oil futures to lock in a price for their production or an airline looking to buy oil futures to protect against rising jet fuel prices.
In this case, I like to look at managed money traders, a category that’s comprised primarily of speculators in the oil futures market such as hedge funds. These traders are seeking to profit from a rise or fall in oil prices, not to hedge inherent business exposure.
My chart shows weekly data since the beginning of 2013; I look for extreme positioning.
For example, in early 2016, managed money traders were net long less than 100,000 WTI Contracts (100 million barrels of oil), the smallest net long position on my chart up to that date. At the time, traders were worried about weakening US economic growth and rising recession risks as well as OPEC’s strategy at that time of oversupplying the market to squeeze high cost producers.
Well, take a look at this chart:
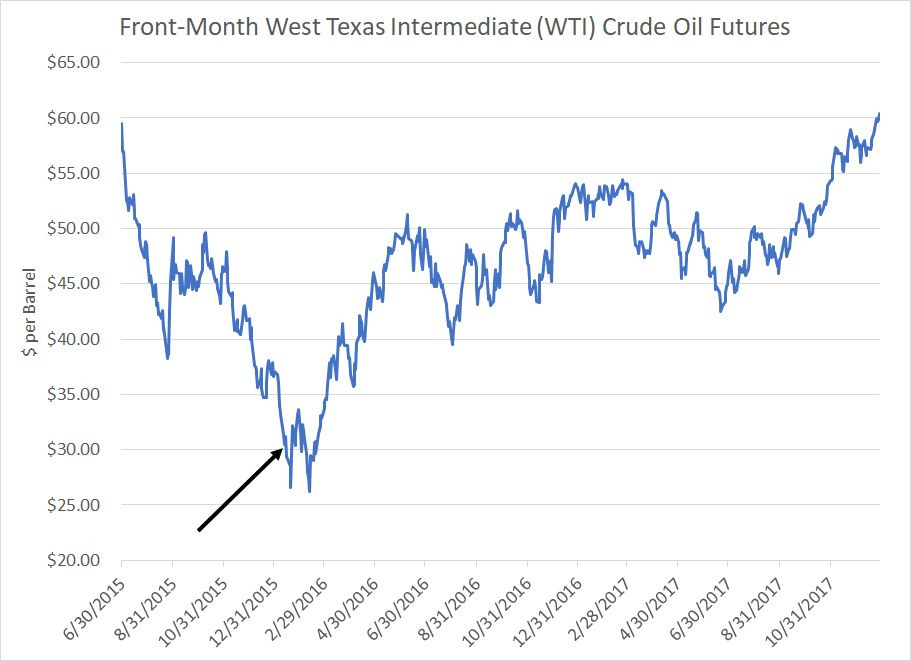
Source: Bloomberg
The black arrow marks January 12, 2016, the date when the net managed money futures position fell to its nadir of +69,755 WTI contracts. That plunge in managed money positions indicated speculators were more bearish crude than they’d been in years.
While it didn’t mark the exact low for crude, it was a good contrarian signal that oil prices were due a significant rally — as you can see, oil more than doubled from under $30/bbl in early 2016 to more than $60 by the end of 2017.
Last week, CFTC reported managed money traders were net long just 71,302 WTI oil contracts as of March 21st, the smallest net long position since the early 2016 low for crude.
The net speculative position in WTI can fall for two reasons — traders increase their shorts or sell down their long positions. Last week it was new short positions in crude that drove the downside in the net position — managed money traders added 44,551 gross short positions while reducing their long positions by just over 8,100.
Indeed, managed money traders are now short more than 126.58 million barrels worth of WTI futures, the largest gross short position in WTI in more than four years. That’s a lot of oil bears who would likely be looking to cover their positions should oil prices begin to break higher again.
In Europe, the key oil price benchmark is Brent crude oil; the ICE futures exchange provides a similar dataset on futures market positioning for this contract. So, let’s take a closer look at the combined commitments data for Brent and WTI in a slightly different way:
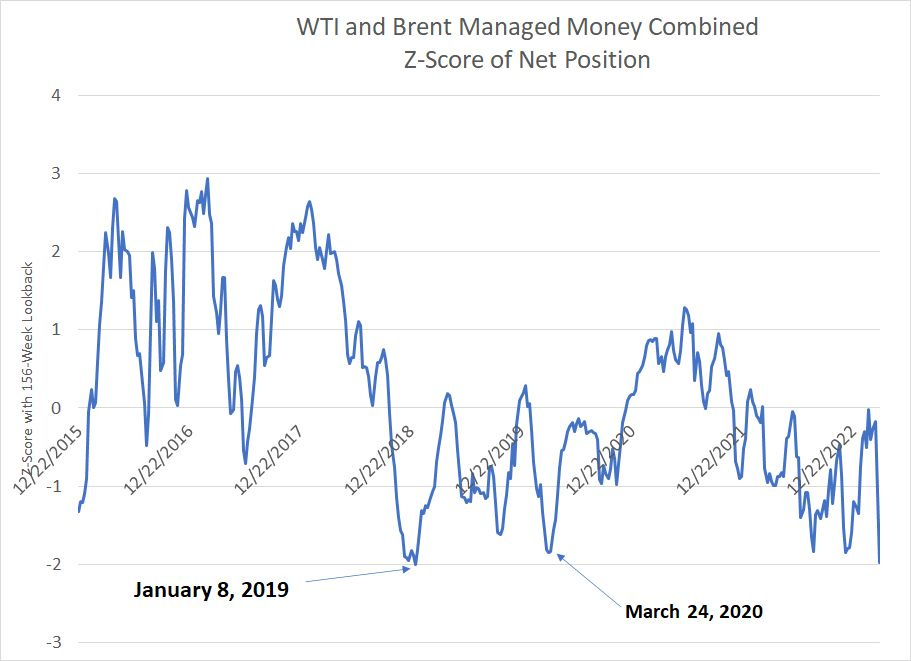
Source: Bloomberg
This chart shows the Z-Score of net managed money futures positioning in the combined Brent and WTI markets since early 2016 based on a 156-week (3-year lookback window).
Simply put, a z-score is measured in standard deviations above/(below) the average (mean). So, a reading of +2.0 would indicate speculators current net long position is 2 full standard deviations above the 3-year average (mean) and a reading of -2.0 would indicate a net position in oil futures that’s two standard deviations below (less long than) average.
I’ve labeled two different dates where the net position fell below -1.75 standard deviations on this basis, indicating a potential contrarian buy signal for oil:
Source: Bloomberg
Once again, when managed money traders get this bearish oil, it’s usually time to start looking for a bottom.
As of last week, the z-score of combined Brent and WTI positions dropped more than 2 standard deviations below the 3-year average, signaling the most bearish sentiment on this basis in more than four years.
Granted, readings of -1.8 in mid-August and late November 2022 only generated short-lived bounces in WTI on the order of 15%. However, with WTI testing key technical support in the low-to-mid $60’s last week and sentiment reaching such a bearish extreme, the probability oil is putting in an intermediate-to-longer-term low is rising in my view.
The Tide vs. Timing
I must warn readers once again that contrarian signals like this are not flawless timing indicators.
Just as Buffett was months early buying stocks back in 2008 and the “Death of Equities” cover in August 1979 was published 3 years before a historic bull market in stocks kicked off in late 1982, I wouldn’t be at all surprised to see oil retest last week’s lows in coming weeks.
What is clear is that sentiment towards crude is already very negative and market participants are already pricing in significant demand destruction from an increasingly likely economic downturn (recession).
It’s also worth remembering that WTI has already pulled back a total of 46.1% from the closing highs set in early March 2022. That’s in the ballpark of the 49.1% peak-to-trough decline in WTI during the 2000-02 bear market and recession, and the 35.4% pullback for crude amid the recession of1990-91.
Meanwhile, I see potential upside catalysts for oil on both the supply and demand sides of the equation.
After all, oil demand from China is picking up as the economy finally reopens following years of COVID lockdowns.
Meanwhile, while US demand is clearly weakening and oil storage is about 35.2 million barrels above the five-year seasonal average that’s only AFTER more than 222 million barrels worth of releases from the government’s Strategic Petroleum Reserve (SPR) since the end of 2021 alone.
US refining margins remain elevated:
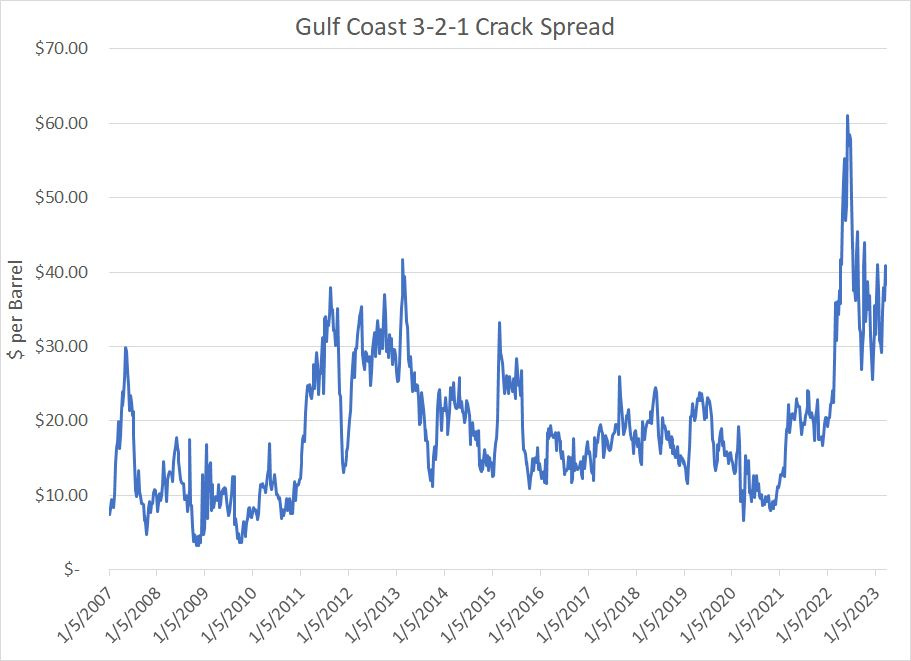
Source: Bloomberg
This chart shows the WTI 3-2-1 Crack Spread, the theoretical per barrel profit margin for a US refiner converting 3 barrels of oil into 2 barrels of gasoline and 1 barrel of diesel fuel.
Typically, as demand for refined products like diesel, heating oil and gasoline weakens, the prices for these products decline. Thus declining profit margins for refiners — companies in the business of buying oil and producing gasoline/diesel — is often an early tell of weakening demand for crude and related products.
With crack spreads near $40/bbl long before peak demand amid summer driving season, we’re just not seeing a collapse in demand right now.
US producers remain disciplined. The US active oil-directed rig count has fallen from a peak of 627 rigs last November to 593 rigs today and many US producers are guiding to modest production growth for 2023 even with prices above their corporate breakevens.
And, OPEC production remains elevated right now with Saudi Arabia still producing almost 10.4 million barrels of oil per day. That leaves room for OPEC to enact additional production cuts later this year should oil supply/demand balances appear looser than expected.
In short, contrarian indicators like this are best viewed as measures of the prevailing tide of market conditions over the intermediate term — with speculators already betting on further declines in oil prices, the probability of an upside surprise in the supply/demand balance is elevated and the path of least resistance for crude over the next 6 to 12 months is higher not lower.
DISCLAIMER: This article is not investment advice and represents the opinions of its author, Elliott Gue. The Free Market Speculator is NOT a securities broker/dealer or an investment advisor. You are responsible for your own investment decisions. All information contained in our newsletters and posts should be independently verified with the companies mentioned, and readers should always conduct their own research and due diligence and consider obtaining professional advice before making any investment decision.