

Oil Futures Fortunes
Oil Futures Fortunes
Responding to a common question I've received this week about oil

Do you remember the March 6, 1999 cover of The Economist magazine?
I sure do. I’d picked it up from the local newsagent near my graduate school in London, and the cover story was “Drowning in Oil,” featuring a photo of two oilfield workers covered in “black gold.”
Here’s a quote from the opening paragraphs: “The world is awash with the stuff, and it is likely to remain so.”
I won’t go through all the particulars of that piece, but the gist of it, as you may have already gathered from that sentence, was that a persistent glut of oil on the global market could see the price of oil sink to as low as $5/bbl.
I’m by no means disparaging The Economist — anyone who attempts to forecast or analyze financial markets will be humbled eventually and, most likely, on multiple occasions. And, back in those days anyway, The Economist and the distinctive gold-colored Financial Times were pretty much required reading.
Further, the basic analysis in that article almost a quarter century ago didn’t seem quite as crazy as it may sound today with the benefit of hindsight:
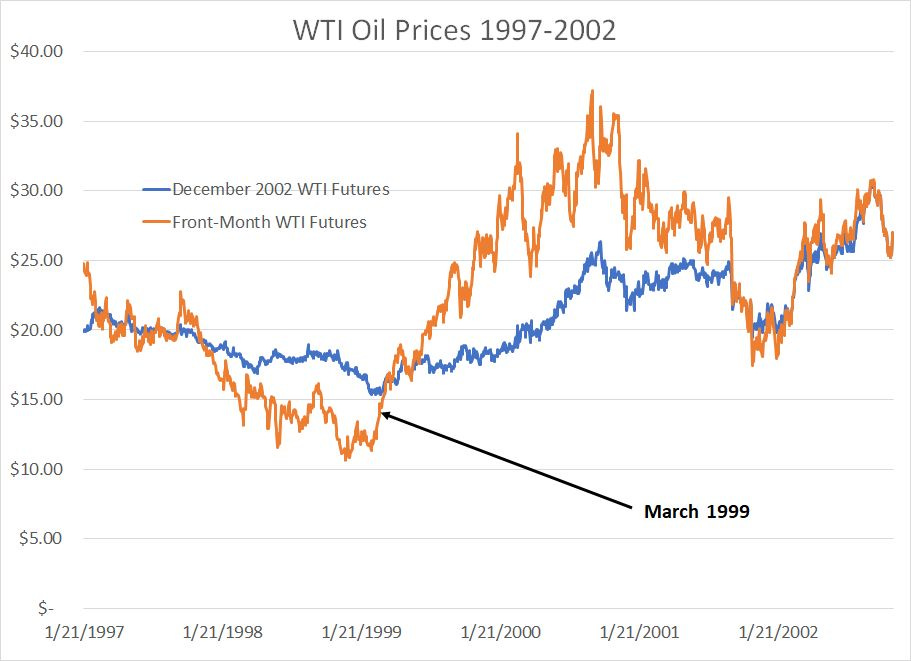
Source: Bloomberg
This chart shows the price of front-month West Texas Intermediate (WTI) oil futures (the orange line) and the WTI December 2002 futures contract between 1997 and 2002.
As you can see, WTI was trading under $15/bbl in March 1999 and the futures for WTI delivery in December 2002 traded at roughly $16/bbl. So, while that’s somewhat higher than the $5/bbl price mentioned in The Economist piece, it hardly seemed implausible.
This article hasn’t aged well because it came close to marking the absolute lows for oil — WTI reached highs over $35/bbl by the autumn of 2000, jumped over $50/bbl in 2004 and reached a record peak of near $150/bbl, 10 times its early 1999 price, by the summer of 2008.
I’m reminded of this piece from 1999 because of an article that appeared in Barron’s magazine last weekend, regarding oil and energy stocks.
To be fair, I haven’t read the article in its entirety though I saw the executive summary on Bloomberg and the one point I’ve been asked about repeatedly this week is the assertion that the futures market “expects” crude prices to drop to the mid-$60s/bbl by 2025.
In one sense, that statement is correct. Take a look:
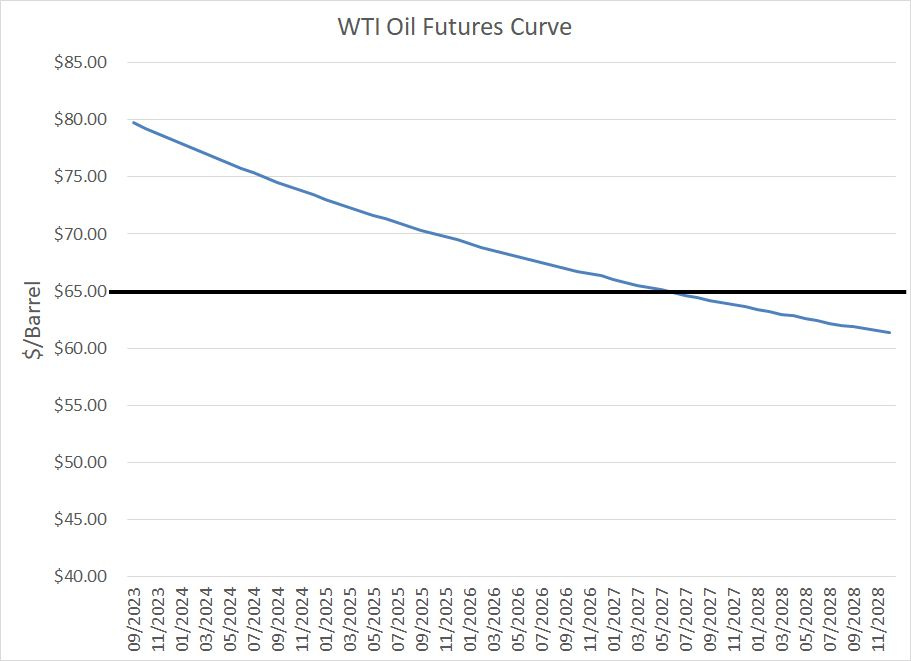
Source: Bloomberg
This chart shows the current futures curve for WTI, a graphical representation of the closing prices for WTI oil delivery from September 2023 through December 2028.
There’s a distinctive downward slope to the curve — known as backwardation — with the current and front month futures selling for around $80, falling to below $70/bbl by 2025 and below $65/bbl (the thick black line on the chart) by 2027.
At first blush that doesn’t seem like a bullish set-up:
After all, why buy energy stocks if oil is expected to decline from $80 to below $70 in two years’ time?
However, the truth is that’s not a compelling argument for lower oil prices for this reason:

Source: Bloomberg
To create this chart, I examined historical trading in WTI oil futures back to January 2013 to determine the efficacy of using WTI futures to predict the path of oil prices two years out.
For example, on the last trading day of January 2013 (January 31, 2013) the January 2015 oil futures sold for $92.31/bbl. The actual price of oil at the end of January 2015, just two years later, was $48.24/bbl. That’s a deviation of -47.7% — oil futures “predicted” the price of oil to be much higher in January 2015 than what actually transpired.
This chart shows the percentage deviation from futures price two years ahead and the actual price with positive numbers indicating WTI outperformed futures market “predictions,” and negative numbers suggesting the opposite.
A quick glance at this chart shows the futures market is a terrible predictor of changes in oil prices over time.
Indeed, if we look at the absolute value of deviations on this chart (the percentage deviation regardless of sign) it’s more than 41% over two years. Take the current WTI price of close to $80/bbl as an example; two years ago in July 2021, oil futures for delivery this month sold for just $61.75/bbl, 29% below the actual price today (that’s the final data point depicted in my chart).
The straight average is about +9%, meaning that since 2013 the oil futures market has tended to underestimate the performance of oil on this basis by a considerable margin.
There are a number of explanations for this, but I think the most compelling is that markets “work” because you have a large number of market participants expressing their views simultaneously. Many of these participants may be unsophisticated or have no inside knowledge of supply and demand; however, as a group, they tend to have some predictive ability, the wisdom of the crowd.
The problem is the July 2025 futures have an open interest of just over 3,000 contracts right now which represents 3 million barrels of oil. That’s nothing in the context of a 100 million barrel per day global oil market or even the 19 or 20 million bbl/day US oil market.
Yesterday, a paltry 142 contacts of the July 2025 futures changed hands.
In short, there’s no wisdom of the crowd in oil futures markets two years out for the simple reason there’s no “crowd.”
DISCLAIMER: This article is not investment advice and represents the opinions of its author, Elliott Gue. The Free Market Speculator is NOT a securities broker/dealer or an investment advisor. You are responsible for your own investment decisions. All information contained in our newsletters and posts should be independently verified with the companies mentioned, and readers should always conduct their own research and due diligence and consider obtaining professional advice before making any investment decision.