


Oil: The Imaginary Glut
The shale plateau and the lie of energy equivalence...

Last week, crude oil prices broke from a tight trading range to the highest levels in about three months.
In my view, there’s more upside for West Texas Intermediate (WTI) to the low $90s/bbl in the first half of 2025.
Amid all the chatter about geopolitics and the potential fallout from US elections, there are only three, interrelated factors that have any bearing on the global oil market – supply and demand balanced by price.
This week let’s dive into the most important factor influencing oil prices this year in my view: Supply.
At the end of last year, the crowd appeared to have embraced the first half 2025 (H1 2025) oil glut scenario. The basic idea is that even if OPEC+ maintains their voluntary cuts well into 2025, non-OPEC production growth will be more than adequate to meet growing global oil demand, a pattern that should lead to building oil inventories, acting as a headwind for prices.
Here's a basic look at what the International Energy Agency (IEA) is forecasting for supply in 2025:
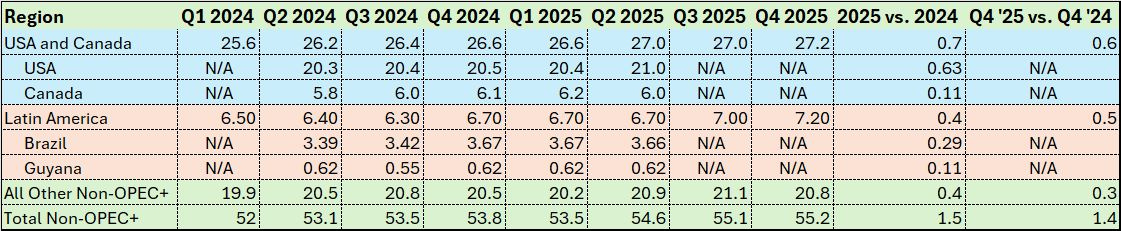
Source: International Energy Agency September 2024 Oil Market Report
I created this table based on IEA’s estimates in its September 2024 Oil Market Report, the last month for which I have access to the entire monthly report.
This table shows expected oil production in millions of barrels per day for select non-OPEC countries and regions. One source of confusion that arises when comparing oil supply estimates between different organizations such as IEA, OPEC and EIA is what’s meant by the term “oil.”
Defining “Oil”
After all, the Energy Information Administration (EIA), part of the US Department of Energy, pegged US oil production in October 2024 at just 13.457 million barrels per day. As you can see in my table above, IEA estimates US Q3 and Q4 2024 production at 20.4 and 20.5 million bbl/day respectively. That’s a discrepancy of around 7 million barrels per day of US oil production.
There are a few explanations.
First, the EIA also estimates the US produced an extra 710,000 bbl/day in October 2024 classified in its monthly petroleum report as “Transfers to Crude Oil Supply.” That’s primarily condensate and other liquids that are blended with crude oil in pipelines and storage facilities.
However, by far the bigger factor at work here is US production of natural gas liquids (NGLs), which EIA estimates at about 7.23 million bbl/day in October 2024. Of that 7.23 million, the largest components are ethane (2.97 million bbl/day), propane (2.219 million bbl/day) and natural gasoline (874,000 bbl/day).
The problem is NGLs just aren’t the same thing as crude oil.
Ethane, for example, is primarily used in the production of ethylene; however, if prices aren’t high enough, ethane routinely ends up mixed with methane (natural gas) and forms part of US natgas supply. You can’t just mix ethane, or propane for that matter, with crude oil and refine that mixture into useful products like gasoline, diesel and jet fuel.
Regardless, let’s simply ignore these definitional complexities for a moment, and take IEA’s forecasts at face value, starting with their estimates for oil supply growth from the US and Canada. In Q4 2025, IEA estimates total US/Canada production at 27.2 million bbl/day, up about 600,000 bbl/day compared to Q4 2024. They also estimate average production for the full year 2025 up about 700,000 bbl/day compared to total average daily production in 2024.
US Oil Production is Flat
And look at the split between US and Canada within this region – IEA is forecasting the US to account for most of that growth in supply, a total of 630,000 bbl/day of production growth with Canadian output up about 110,000 bbl/day. Differences in the figures are due to rounding.
That’s nonsense in my view:
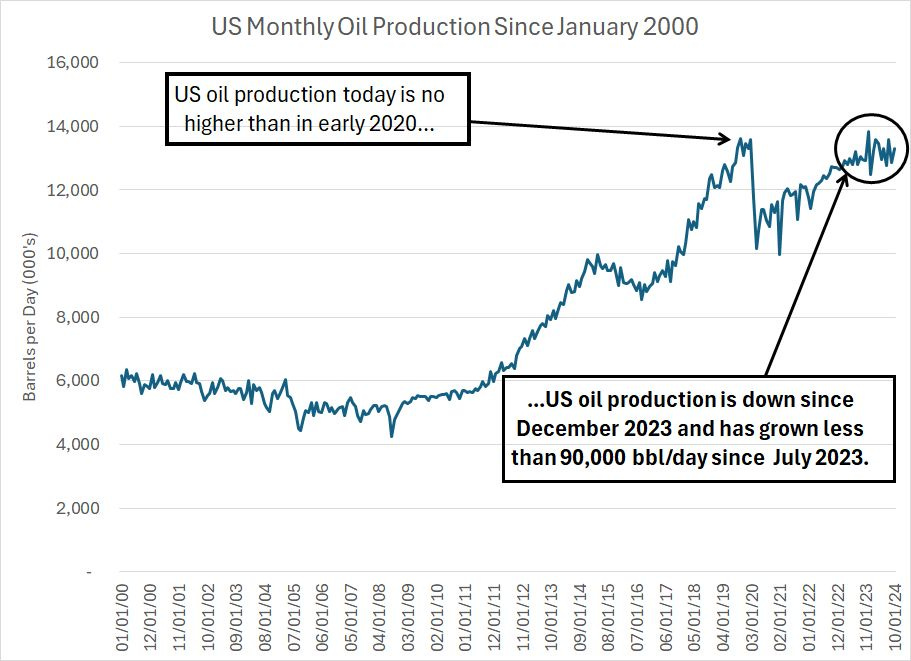
Source: Energy Information Administration
This chart shows total adjusted US oil production since January 2000. I’m defining that as EIA’s estimated US oil production plus their adjustment factor. The adjustment factor is an error term designed to help EIA’s monthly supply, inventory and demand estimates balance. In this case, adding the adjustment factor to the raw production data helps render more recent production estimates comparable to data released before mid-2023 when EIA changed their US oil supply estimation methodology.
Just look at this chart and compare it to the International Energy Agency’s forecasts for 2024 and 2025 output. IEA seems to be forecasting a return to rapid growth in US shale production – something more like we saw before 2019-2020. Meanwhile, the reality is that US oil production today is flat with where it was 5 years ago at the beginning of 2020. Looking at more recent trends, US oil production today is up less than 90,000 bbl/day since the middle of 2023.
That’s a plateau for US oil output near peak levels, not growth.
So let me ask you this:
What, exactly, is going to power a step-change higher in US oil production through 2025?
It certainly isn’t a rise in oil prices that makes drilling more profitable for US producers:
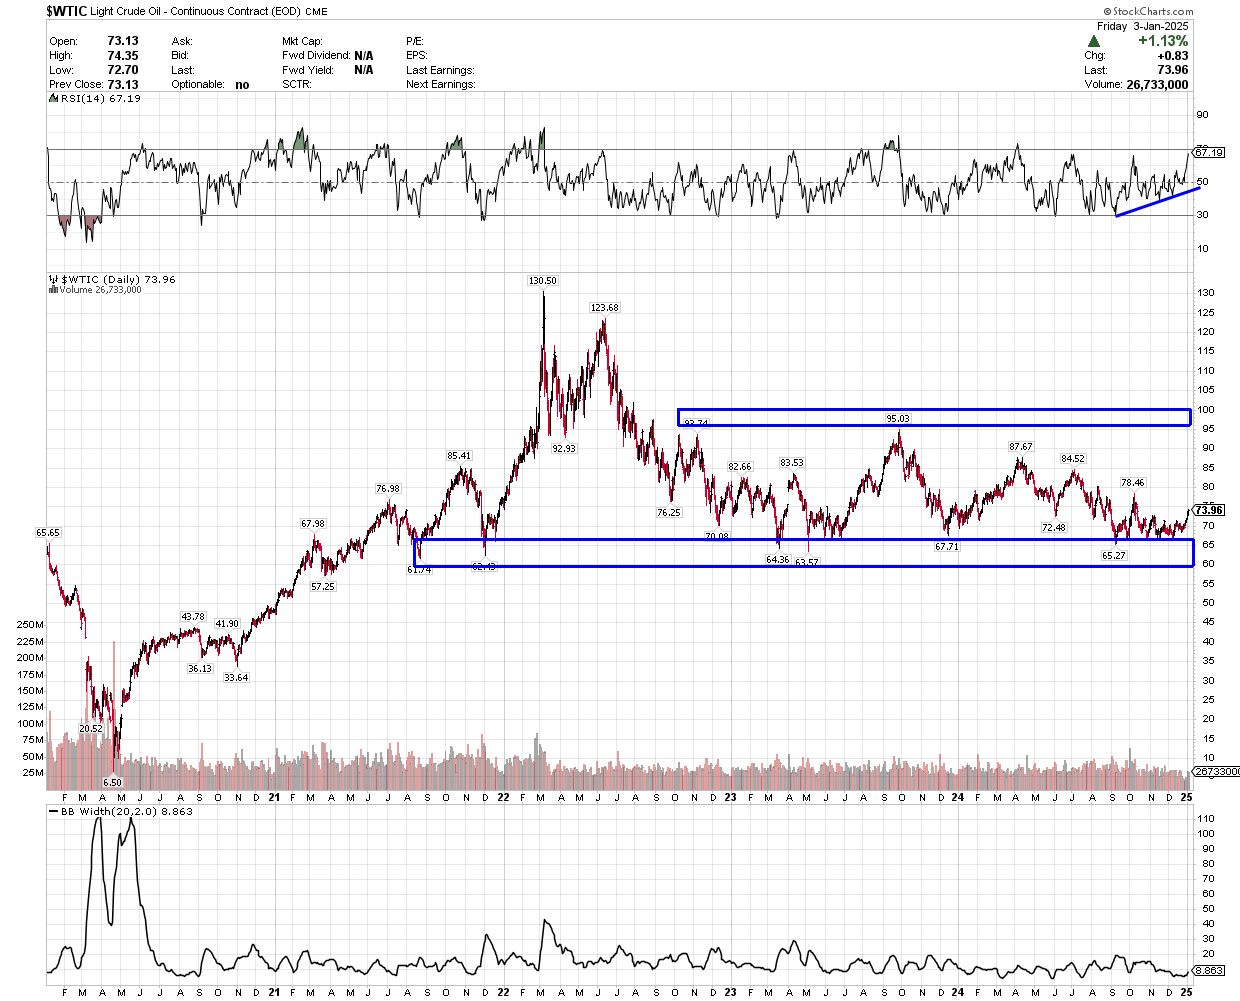
Source: Chart Courtesy of Stockcharts.com
I’ve labeled some key support and resistance zones for WTI Crude Oil prices on this chart as rectangular boxes.
As you can see, there’s a clear support zone for crude oil between around $62 and $67/bbl and a clear resistance zone in the low-to-mid $90s/bbl. At a current price of $73.96/bbl, we’re closer to the bottom of that range than the top.
By my calculation, high-quality US shale producers like Diamondback (NSDQ: FANG) can generate positive free cash flow at their current production rates and cost structures even with a realized price of around $45/barrel:
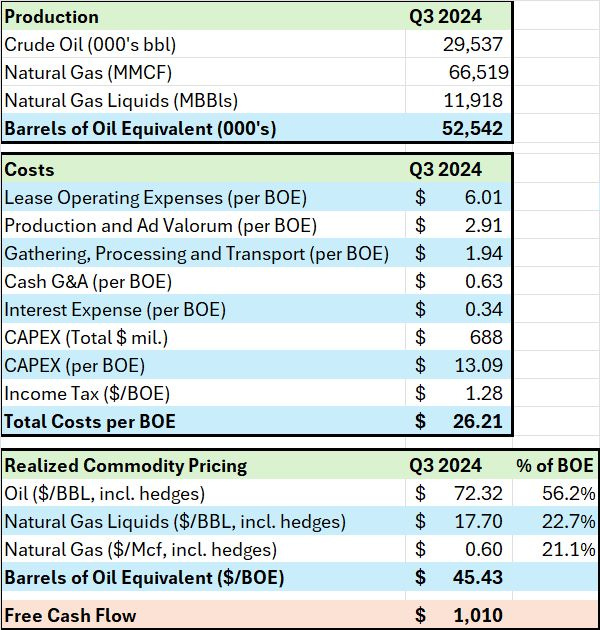
Source: Diamondback Energy Q3 2024 Earnings Release
In addition, note that the largest single cost line-item for FANG – just as for most other producers – is capital spending (CAPEX), which accounts for $13.09/bbl of the $45.43 “breakeven” cost per barrel.
CAPEX generally relates to the cost of drilling and completing (fracturing and putting into production) new wells. So, in a low commodity price environment, FANG can preserve free cash flow by cutting CAPEX to reduce costs. Over time, drilling fewer new wells – less CAPEX -- results in lower oil production; however, that’s desirable in a low commodity price environment when producers are in capital preservation mode.
Why drill and produce more oil at low prices when you can cut costs and bring that production onstream when prices are more favorable?
I’d emphasize two points:
First, even at current oil prices, US oil production has been flat for well over a year now as I showed you earlier.
Total US total oil production is the function of CAPEX decisions made by hundreds of companies of various sizes like FANG, and FANG is one of the lowest cost US shale producers in the US. So, why in the world would we expect overall US production growth to suddenly take off even with oil prices near the low end of their current price range?
That’s just silly. IEA’s US production growth estimates just don’t match up with reality on the ground when it comes to actual US crude oil production.
Second, just because a company can spend within their cash flow at $45/bbl doesn’t mean they’ll simply wait until oil falls to that level to cut production.
Jump on any quarterly earnings call from a US oil or gas producer and you’ll see what I’m talking about – analysts scrutinize and grill management on even the most modest changes in CAPEX plans. Shares are quickly punished if it seems a producer is losing their capital discipline (CAPEX per Barrel of Oil Equivalent is a common metric).
I can guarantee you that if a producer like FANG did NOT cut CAPEX should oil fall below its recent range, Wall Street and the company’s shareholders, would be calling for a change in management or simply selling the shares, driving down the value of the company’s stock and impairing access to capital.
None of this adds up unless, perhaps, you make the convenient assumption that some natural gas liquids (NGLs) like ethane and propane are the same thing as “oil” even though they can’t be used in the same applications.
It’s Harder to Grow Oil Production
In that regard, look at this:
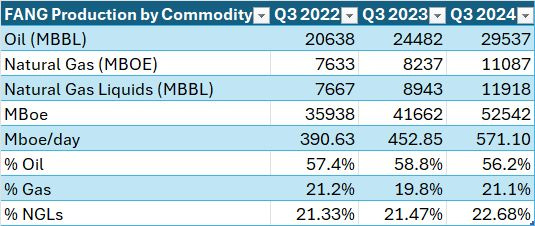
Source: FANG Quarterly Earnings Calls
I examined actual FANG production in Q3 2022, Q3 2023 and Q3 2024. FANG is primarily considered an oil producer, and its assets are in the heart of the Permian Basin region, the most prolific shale basin in the US.
However, in Q3 2024 crude oil only accounted for about 56.2% of total FANG output on a thousands of barrels of oil equivalent basis (MBOE), down from 57.4% two years ago. Meanwhile, natural gas has been fairly consistent at 21.1% of FANG output while NGLs have gained share, rising from 21.33% of FANG’s production in Q3 2022 to 21.47% in Q3 2023 and 22.68% in Q3 2024.
Two points:
First, FANG is one of the better producers on this basis. Many US shale producers are seeing their production mix shift more rapidly in favor of natural gas and natural gas liquids (NGLs), which makes it harder for them to grow oil production in absolute terms.
Take Devon Energy (NYSE: DVN) as an example:
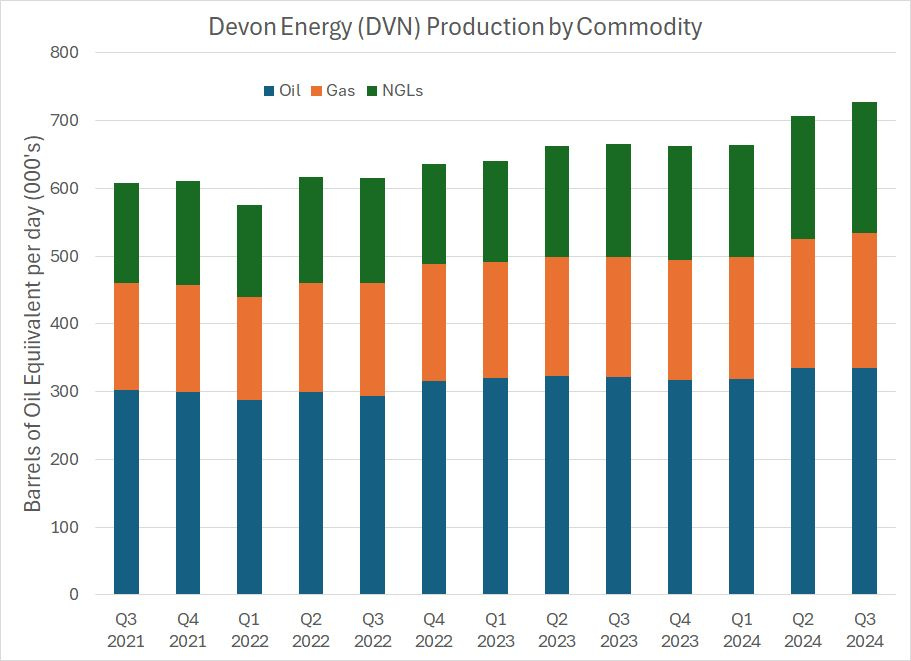
Source: Devon Quarterly Earnings Calls
Devon produces from a number of shale fields though their most important region is the Delaware Basin, the western portion of the Permian . This chart shows Devon’s production for each quarter since Q3 2021 in barrels of oil equivalent per day (BOE/day).
The blue part of each column represents DVN’s oil production. And, while oil is DVN’s most important commodity on this basis, it still accounts for less than half the company’s total output – indeed, in Q3 2021, oil comprised 49.8% of DVN’s total output, compared to just over 46% today. Over the same time period, NGLs have grown from 24.3% of total output to 26.7% while natural gas is up to 27.3% of production from 25.8% in Q3 2021.
By convention, 1 barrel of liquids – whether it’s crude oil or a mixed barrel of NGLs – equals 1 barrel of oil equivalent (BOE). Meanwhile, since there are about 6 million British Thermal Units (BTUs) in a barrel of oil and 1 million BTUs in 1,000 cubic feet of natural gas, gas volumes are converted into BOE using a 6,000 cubic feet = 1 BOE ratio.
Those energy equivalence conversions do NOT reflect the realities of pricing.
For example, in Q3 2024, DVN sold its oil for $73.74/bbl including hedges while NGLs fetched just $19.25/bbl on the same basis – a barrel of NGLs was worth around 26% of a barrel of oil in Q3 2024. Meanwhile, 1,000 cubic feet of gas was worth just $0.84 meaning that 1 BOE of gas (6,000 cubic feet) was worth just $5.04, less than 7% of the value of a BOE of oil.
Second, from a purely mathematical perspective, if the price of NGLs and natural gas are low, or fall, relative to the price of oil then a producer will need higher oil prices to maintain the same level of free cash flow.
On a related note, if a company’s production mix shifts in favor of natural gas or NGLs trading at a lower value on an oil-equivalent basis – the situation over the past few years -- that company will need higher average oil prices to offset its less favorable production mix.
Bottom line: IEA’s “oil” production growth outlook for 2025 looks like pure fantasy whether you care to look at monthly oil production data released by EIA over the past few years or dig into results from individual producers like Diamondback (FANG) and Devon (DVN).
Of course, the US isn’t the only source of non-OPEC supply growth expected in 2025 though it does account for around 42% of their total non-OPEC supply growth forecast for this year.
Looking beyond the US, IEA has penciled in 400,000 bbl/day of new supply from Latin America – Brazil and Guyana account for all that growth. While it’s tough to confirm the exact estimate there, that seems reasonable, at least directionally, given Exxon’s project timetable in Guyana and Brazil’s ongoing developments.
However, IEA’s forecast for 400,000 bbl/day of new supply from all other non-OPEC+ countries – outside the US, Canada and Latin America – seems suspect to me. Most other non-OPEC+ regions of the world are experiencing declining output, so it’s unclear where IEA expects these new barrels to come from.
Take a look:
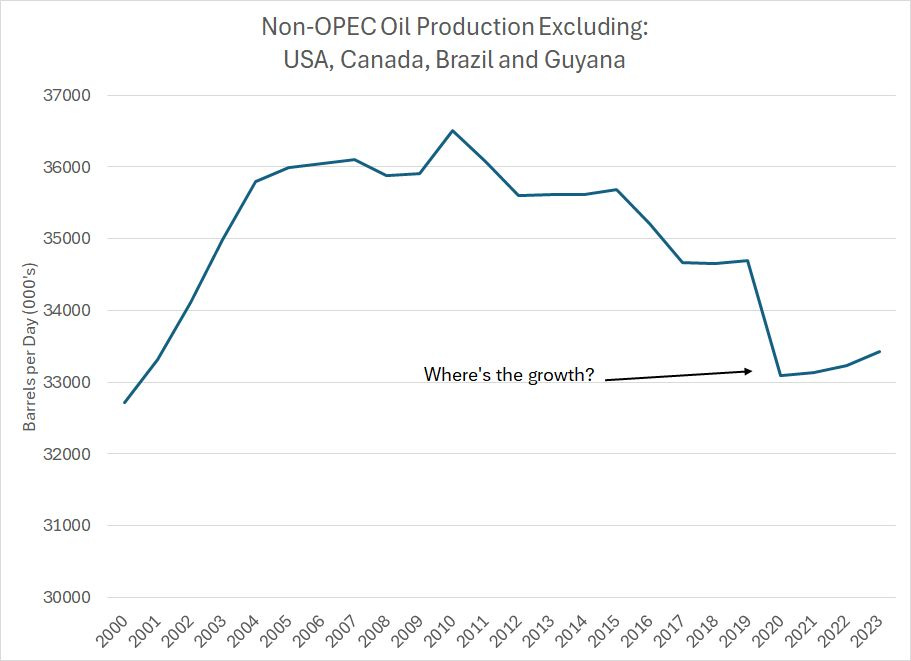
Source: BP Statistical Review of World Energy 2024
This chart shows total non-OPEC oil production excluding the US, Canada, Brazil and Guyana.
As you can see, non-OPEC production outside these four countries plunged from 2010-2019 and has remained, at best, flat over the past few years. If the IEA’s forecast for 400,000 bbl/day of production growth from these countries were to pan out, it would be the first time in about 20 years that’s happened.
In aggregate, my view has been, and remains, that fears of a supply glut in H1 2025 are wildly overblown and at some point early this year I suspect markets will come around to the view that US oil production is likely to be flat to down this year barring a significant rally in crude needed to incentive more CAPEX and drilling activity from shale producers like FANG and DVN.
The recent rally in oil coming as it has in the absence of major geopolitical headlines suggests the adjustment higher in oil prices may now be underway.
With these point in mind, I’m recommending our first options trade recommendation in Free Market Speculator today:
Keep reading with a 7-day free trial
Subscribe to The Free Market Speculator to keep reading this post and get 7 days of free access to the full post archives.