

Overbought Energy
Overbought Energy
There's an energy and commodity supercycle underway

The first quarter of 2024 is officially in the history books, and it was a good one for large-cap US stocks – the S&P 500 jumped 10.54%.
That’s rare –the S&P 500 has only returned more than 10% in Q1 in 10 of the past 52 years, less than 20% of the time.
Looking at just those 10 years with a 10%+ return in Q1, all save 1 saw the S&P 500 build on those gains through the final 9 months of the year for an average return from Q2 through Q4 of 8.67%. The average return from Q2 through Q4 of each year over the same 52 years is about 9.16% and the S&P 500 is positive almost 77% of the time.
(If you’re wondering, the one year where the S&P 500 started strong, but ended weak was the infamous 1987 crash year).
One more set of stats for you. In years where the S&P 500 is up 10%+ in Q1, the S&P 500 goes on to produce positive returns in Q2 some 80 percent of the time for an average gain of around 4.74%. The all-sample average for Q2 is a positive return 75% of the time for an average of +3.50%.
Bottom line: The S&P 500 is up a lot in Q1, but that doesn’t necessarily mean we’re going to see a significant pullback in Q2 or for the rest of the year – indeed, closer to the contrary.
My view remains the bigger story in markets this year will be rotation and a change in leadership.
It’s telling the Nasdaq 100 underperformed the S&P 500 through the first quarter, rising just 8.72%. Further, in the final two months of Q1, the S&P 500 Information Technology Index slipped into 7th place out of 11 sectors. The top three-performing sectors in the market over the past (roughly) two months are Energy (+14.1%), Materials (+13.4%) and Industrials (+11.96%).
All three of these recent winners underperformed the S&P 500 in 2023.
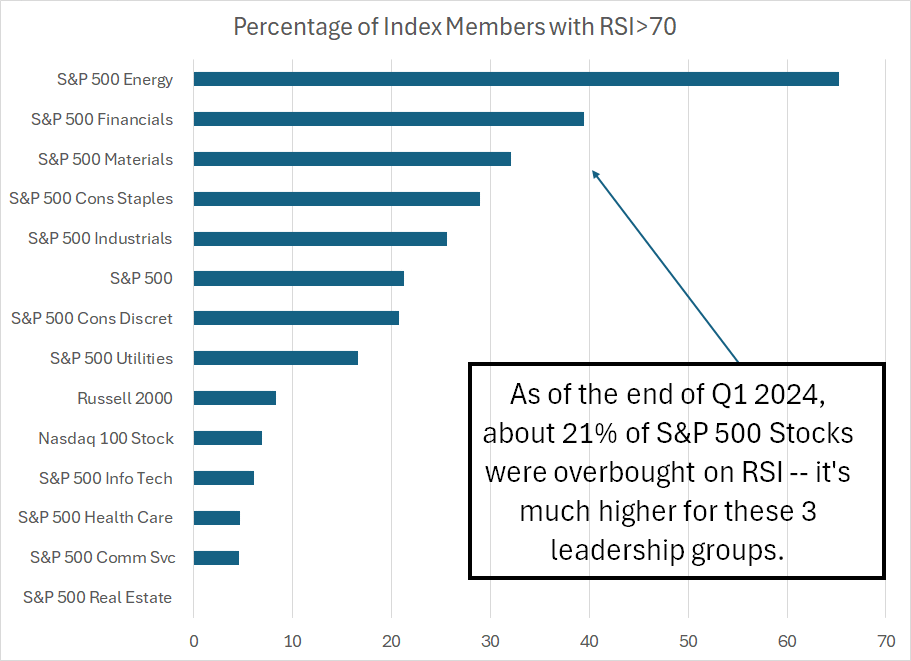
And here’s a chart to ponder:
Source: Bloomberg
I’ve written about the 14-Day Relative Strength Index (RSI) in Free Market Speculator before, most recently in “Warning: Happy New Year.” It’s a technical indicator that evaluates near-term momentum in a stock or index; readings above 70 suggest an “overbought” market while readings under 30 are “oversold.”
I use RSI in several different ways.
First, if a stock is near oversold on RSI, into technical support and I think the move is overdone from a fundamental perspective I will often look at that as a buying opportunity. A good example of this was Walmart (NYSE: WMT) late last year, which I wrote about in “Don’t Forget the Micro Tells.”
Second, if a stock or exchange-traded fund (ETF) is overbought on RSI and approaching a technical resistance level or nearing a key catalyst event like earnings, I may look at that as an opportunity to book partial gains on a long-side trade. We did that with the Russell 2000 ETF (NYSE: IWM) in the model portfolio that’s part of the paid tier of FMS late last year.
However, this point is CRUCIAL:
It’s bullish NOT bearish when a stock or index frequently registers as overbought.
One of the things I watch when assessing breadth and momentum is to look at the number of stocks in an index registering as overbought or oversold over time.
Just consider that since January 1, 1990, the 90th percentile for the S&P 500 is 14.83% of S&P 500 members have an RSI over 70 on a given trading day. That means that RSI is above 70 for more than 14.83% of S&P 500 members on only 10% of trading days since January 1990.
Currently a whopping 21% of S&P 500 members are overbought.
However, just consider the 4-week average return for the S&P 500 following a 14.83% RSI>70 reading is +1.85% compared to a full-sample average of +0.91%. The 8-week return is 2.72% compared to a 1.79% full sample average.
In contrast, the 90% percentile for S&P 500 members with an RSI reading below 30 – oversold – is 8.55%. That means more than 8.55% of S&P stocks have an RSI less than 30 on only 10% of all trading days since 1990.
Following readings of 8.55% or more on this basis, the S&P 500 loses an average of 0.6% over the ensuing 8-week period compared to that full sample average of +1.79%.
So, when I see an index – like the S&P 500 Energy Index or the S&P 500 Materials today – with 25% to 30% or more of index components overbought on RSI that tells me the group has a ton of upside momentum and is likely experiencing a rally on expanding breadth.
It is not a reason to sell.
Indeed, this is exactly what you’d expect at the beginning of a new “supercycle” for energy stocks.
Energy is a (Super)Cyclical Industry
When it comes to commodity-focused industry groups like energy and basic materials, it’s crucial to remember these groups are deeply cyclical.
I’ve written about the fundamentals driving oil and natural gas on multiple occasions in Free Market Speculator including in my December 15th piece on oil titled “Oil’s Well.” However, from a big picture perspective, oil like all commodities is driven by three basic forces: Supply, demand and price.
The problem is that while demand can change quickly, as can commodity prices, supply in most markets is sticky. That’s because it takes significant capital spending and, usually, years of development to open new mines or oil/natgas projects and boost supply.
The fixed nature of supply for many commodities over the short-to-intermediate term explains why these industries tend to see multi-year supercycles. Simply put, it took years of elevated prices in the 1970’s to incentive the development of fields in places like Mexico, the North Sea of the UK and Norway and the North Slope of Alaska – it was this surge in non-OPEC supply that ultimately brought down oil prices in the 80’s.
Fast forward to the early 2000’s and the situation is similar. It took a steady increase in oil and gas prices from 2000-08 to provide the economic spark that led to large scale shale development in regions like the Barnett Shale and Marcellus for natural gas and the Permian and Bakken Shale for oil. Increased supply from these new shale sources is what eventually brought down natural gas and oil prices.
New sources of supply don’t materialize overnight – that’s why commodities tend to experience prolonged periods of rising prices.
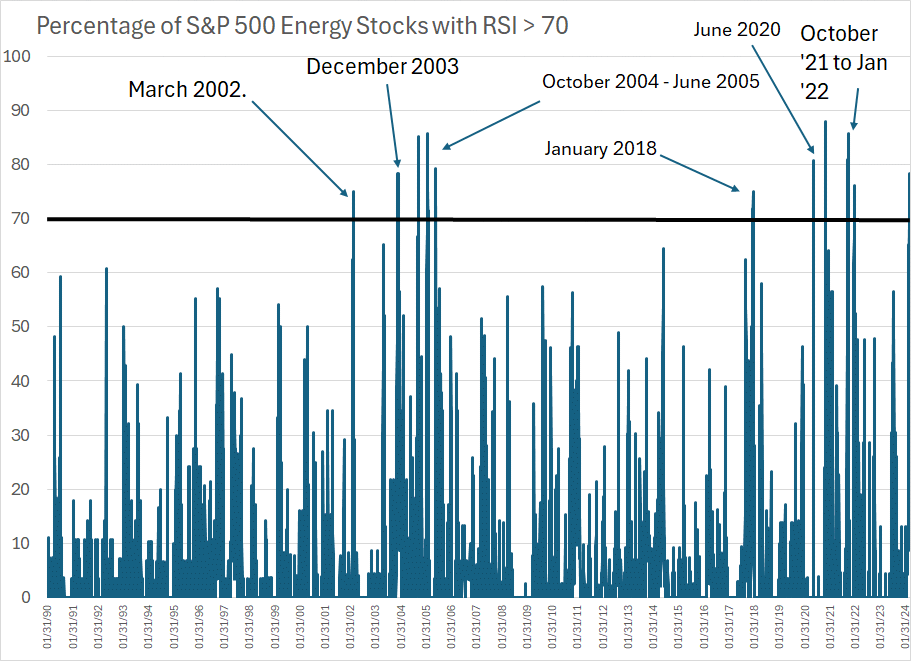
What’s interesting is the pattern of extreme overbought RSI readings we’re seeing in energy right now – as of yesterday’s close a whopping 78% of stocks in the S&P 500 Energy Index had an RSI over 70 – provides further technical confirmation that a new supercycle is underway:
Source: Bloomberg
This chart shows the percentage of stocks in the S&P 500 Energy Index with an RSI above 70 on every trading day since January 1990. I’ve also labeled the 70% level as a black line and some of the dates when we saw a proliferation of overbought readings over this period.
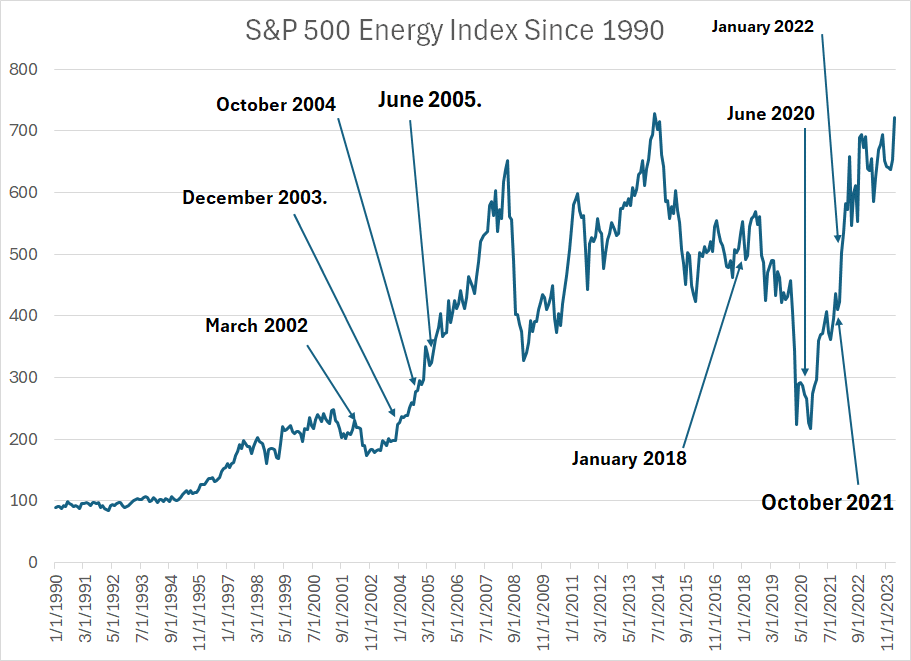
As you can see, we saw a flurry of overbought readings in energy stocks in 2002-03, 2004-05 and 2020-22. With those dates in mind, take a look at the S&P 500 Energy Index over the same period:
Source: Bloomberg
As you can see, these periods of extreme overbought readings tend to group just before and in the early stages of major, multi-year rallies in energy stocks.
An investor who bought the S&P 500 Energy Index at the end of December 2003, for example, enjoyed a total return of almost 301% -- that’s over 14% annualized – through the middle of 2014, a period of more than a decade. That’s significantly better than the 119% gain in the S&P 500 or 183% in the Nasdaq 100 over the same holding period.
Of course, this indicator doesn’t always “work.” For example, that signal in January 2018, labeled in my chart above, was a dud as energy stocks fell further into the COVID lockdown crash of early 2020. However, the pattern of extreme overbought readings in June 2020, October 2021, January 2022 and again in the past few days looks reminiscent of the start of the last supercycle in 2002-03.
The S&P 500 Energy sector is the top-performing group in the index since the end of 2020 rising 194.4% almost triple the return of the next best-performing sector in the index, Information Technology up 70.7%.
Short-term pullbacks are always a possibility, but this supercycle remains in its early stages.
DISCLAIMER: This article is not investment advice and represents the opinions of its author, Elliott Gue. The Free Market Speculator is NOT a securities broker/dealer or an investment advisor. You are responsible for your own investment decisions. All information contained in our newsletters and posts should be independently verified with the companies mentioned, and readers should always conduct their own research and due diligence and consider obtaining professional advice before making any investment decision.
Great information to know about the Energy sector Elliott. Any thoughts on small vs large caps in energy, energy service companies vs producers, an offshore vs onshore?