

Profiting from Bond Volatility
Profiting from Bond Volatility
Sorting through the Fed's rate hike expectations

Editor’s Note: Thank you for all the questions and feedback about the new Free Market Speculator paid tier. As a reminder, I am offering 30-day free trials to the paid tier through tomorrow June 2nd, by tapping here.
Lately, I’ve received a ton of questions from readers about bonds and, specifically, Treasury bonds.
So, in this issue I’ll take a closer look at the bond market and what I see over the next 6 to 12 months plus an exchange traded fund (ETF) I added to my model portfolio back in early March. This ETF might be worth a look for those interested in exposure to fixed income with an income “kicker” from the recent surge in bond market volatility.
Over the past three months, market expectations for Fed policy have been on a wild ride.
You can see it all in this chart:

Source: Bloomberg
This chart shows interest rate expectations in the Fed Funds Futures market on 3 different dates: March 8, 2023, March 24, 2023 and yesterday afternoon (May 31st).
On March 7, 2023 Fed Chair Jerome Powell gave a speech on Capitol Hill saying, among other things:
Although inflation has been moderating in recent months, the process of getting inflation back down to 2 percent has a long way to go and is likely to be bumpy. As I mentioned, the latest economic data have come in stronger than expected, which suggests that the ultimate level of interest rates is likely to be higher than previously anticipated. If the totality of the data were to indicate that faster tightening is warranted, we would be prepared to increase the pace of rate hikes. Restoring price stability will likely require that we maintain a restrictive stance of monetary policy for some time.
Source: Federal Reserve Semiannual Monetary Policy Report to the Congress March 7, 2023
That’s a pretty unambiguous and hawkish statement and markets took it to suggest growing risk of a 50 basis point hike at the Fed’s upcoming meeting on March 22nd. On March 8th, the Fed Fund Futures market was pricing in 100% probability of a Fed hike on March 22nd and a 71.2% chance the central bank hiked rates 50 basis points (0.50%).
At that time, markets were looking for the Fed to hike rates to a peak of about 5.7% by the time of the central bank’s September 20, 2023 meeting and then hold rates at around that level through the end of January 2024. Specifically, the market penciled in a roughly 50/50 shot the Fed cut just once by 25 basis points at some point between September of this year and January 2024.
Of course, on March 8th the world changed. That very evening SIVB Financial, the parent of Silicon Valley Bank, announced it had sold about $21 billion worth of securities on its books to improve liquidity, realizing a loss of $1.8 billion. The bank also announced a plan to sell common stock and convertible preferred stock to raise capital.
The stock closed at around $268 on March 8th and just two days later on March 10th it was seized by the FDIC.
As you might expect, the resulting regional banking crisis prompted a major shift in expectations for Fed policy; just over two weeks after Powell (strongly) hinted the Fed might hike 50 basis points at its March 22nd meeting, the central bank hiked just 25 bps.
And in the wake of that March 22nd meeting and press conference, the Fed Funds futures market was convinced the Fed was finished hiking for the current cycle.
Indeed, as of March 24th, futures were fully pricing in a series of rate cuts starting over the summer; by the time of the Fed’s January 31, 2024 meeting, market participants were looking for the Fed’s key target rate to be around 3.75%, fully pricing in four 25 basis point cuts (a full 1% of cuts) and about a 1-in-4 chance the Fed cut 5 times by next January.
Shortly thereafter, expectations swung in the opposite direction. While the regional bank crisis did spread beyond SVB, it didn’t morph into a reprise of the 2007-09 financial crisis. While smaller banks faced deposit flight, bigger banks like JP Morgan Chase (NYSE: JPM) remained on solid footing.
The stock market began to recover and there was no immediate, rapid deterioration in the economic data.
So market expectations as of yesterday’s close (the gray line on my chart) show 36% probability the Fed hikes at its next meeting on June 14th, and an 82.9% chance the central bank hikes 25 basis points on either the June 14th or July 26th meeting.
Even more important in my view is that markets are only pricing in a single 25 basis point cut to rates from this summer’s peak by January 31, 2024 and just 43% probability the Fed cuts 50 basis points from that cycle peak by the end of January next year.
Indeed, recent speeches from Fed policymakers suggest the central bank’s main focus right now is to convince markets it plans to keep rates at or above current levels into 2024. Fed commentary has strongly pushed back against the “pivot narrative” that a short pause would be immediately followed by an aggressive cutting campaign.
From Short Rates to Long Rates
The Fed generally focuses on controlling short-term interest rates directly; however, shifts in Fed policy expectations, and the outlook for economic growth and inflation, do have a meaningful impact on longer term interest rates as well.
Take a look:
Source: Bloomberg
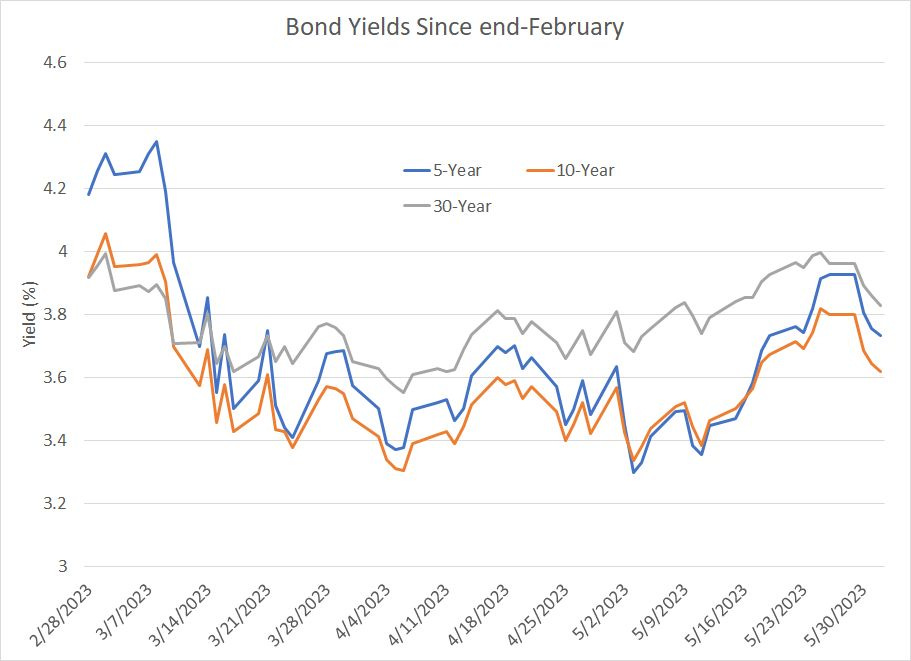
This chart shows the yields on 5-year, 10-Year and 30-Year Treasury bonds since the end of February and the pattern tracks my prior chart.
Specifically, rates were near the high end of the range in early March then fell (bond prices rallied, yields fell) through the March regional banking mess. Yields were then rangebound through much of April before rallying yet again (bonds prices fell, yields rose) through much of May.
In short, you could say the bond market looks rather confused regarding two potential scenarios:
Is the economy strong and speculation alive and well in the stock market, both factors that might drive the Fed to hike more aggressively this summer and keep rates higher for longer?
Or, is the economy weakening, headed for recession, and recent stock market strength simply a function of a speculative bubble in artificial intelligence and a handful of large-cap Nasdaq and growth stocks?
Readers of The Free Market Speculator know I tend to side with scenario #2 and ultimately I’d expect bonds to rally and yields to fall as market participants seek a safe haven from equity market storms and price in lower yields ahead.
That said, the exact timing of final descent into recession, and the collapse of the growth-and-AI pillars of support for equity markets, remains somewhat uncertain.
Bottom line is that I’m looking for a general decline in yields over the intermediate term (I’m bullish bonds) but it’s likely to be a bumpy ride as has been the case since the end of February.
There is a way to express this market view that I’ve been recommending to readers since early March in the model portfolio that now underpins The Free Market Speculator paid tier.
Let me explain:
Covered Call Bond ETFs
I am typically not a fan of “complicated” exchange traded funds (ETFs); however, in this case, I made an exception because it allows investors to unlock a powerful options strategy without trading a single option directly.
The specific ETF is called the iShares 20+ Year Treasury BuyWrite Portfolio ETF (NYSE: TLTW) and it tracks US Treasury bonds with more than 20 years remaining until maturity. Simply put, the TLTW fund owns the iShares 20+ Year Treasury Bond ETF (NYSE: TLT) and then sells out-of-the-money call options on TLT with about 1 month remaining until expiration.
A call option gives the holder the right, but not the obligation, to buy the underlying asset – in this case the TLT fund – at a predetermined strike price on or before expiration of that option.
Perhaps the best way to illustrate is with a simple example:
As of the close on May 31st, the iShares 20+ Year Treasury Bond ETF (NYSE: TLT) sold at a price of $102.99. Meanwhile, the call options on TLT with an expiration date of June 30th, 2023 and a strike price of $105 sold for about $1.20 each.
To create a covered call strategy similar to that employed by TLTW, an investor could buy 100 units of TLT at a price of $102.99 for a total cost of $10,299 and simultaneously sell (write) the TLT June 30th, $105 calls for proceeds of $120. There are essentially 3 possible outcomes:
Scenario #1: The price of TLT could rally significantly through the end of June, closing above $105.
In this event, the buyer of the calls you sold would likely exercise those calls, paying you $105 per unit or $10,500 for your 100 units of TLT. You would also get to keep the premium you earned by selling the calls of $120 and any distributions paid by TLT in the interim (in this case, TLT will pay its next monthly distribution on or around Monday June 7th).
So, you would make a profit in this scenario, but you are essentially giving up any capital appreciation in TLT above $105, the strike price of the calls you sold.
However, also note that since you’re selling the calls for $1.20 each, TLT would need to rally above $106.20 by May 12th for you to be worse off with the covered call than just buying and holding TLT.
Following June 30th expiration you’d also be free to buy additional units of TLT to maintain your position in the fund.
Scenario #2: TLT could trade roughly sideways closing around $103 on June 30th.
In this case, the owner of the calls wouldn’t exercise their option to buy TLT at $105 when it’s trading below that price, so the options you sold would expire worthless You’d keep the $120 premium earned by selling the calls and you’d be in a position to sell more calls to generate more premium against your position in TLT.
In this case, you’d earn more income by selling the calls than simply holding TLT.
Scenario #3: TLT could sell off significantly as it did back in February.
In this case you’d still lose money on TLT as you own the ETF, and it would decline in price. However, the premium generated by selling the calls would help soften the blow, reducing your losses.
And you’d still be in a position to sell new calls on TLT after June 30th to generate additional income from TLT plus you’d receive any monthly distributions paid by TLT as in both other scenarios I just outlined.
Of course, you don’t need to make any of these transactions, and you don’t need to trade any options – this is simply an example of roughly what’s going on behind the scenes when you buy TLTW.
Broadly speaking, when the underlying asset sees a powerful rally, the covered call strategy will limit your returns because the calls you’re selling to generate premium will be exercised. However, in the other two scenarios, either rangebound trading or a sell-off, premium generated by selling calls will enhance income and returns compared to buying the underlying asset outright.
Now, this point is crucial:
Covered Calls are Best for Volatile Markets
The premium received from selling call options will depend heavily on volatility in the bond market – in this case, the tendency for longer-term US government bonds to vary in price from day-to-day or week to week. I won’t dive into the way options are priced in this article; suffice it to say when traders expect the price of an asset to make larger price swings, the price of options on that asset will rise.
In other words, in periods of rising volatility, the premium “paychecks” you earn as a seller of covered call options become more attractive.
In this case, I believe volatility in the government bond market – and ETFs like TLT – will remain elevated compared to the norm of the past decade.
Take a look:

Source: Bloomberg
This chart shows the implied volatility priced into call options on the TLT fund, which is the calls TLTW sells to implement its strategy. The higher the implied volatility, the more expensive the options, and the more premium a call seller can generate.
This chart shows weekly implied volatility since the end of June 2009.
I’ve labeled some spikes in bond market volatility over this period including the COVID lockdown panic in 2020, the taper tantrum back in 2013 as the Fed announced plans to wind down quantitative easing, and the US sovereign credit downgrade in August 2011.
All these events caused short-lived spikes in implied volatility that faded within a few weeks. And generally, bond market volatility remained in the 10 to 15% range on this basis for most of the period covered by my chart.
This is a feature of the Fed’s policy accommodative monetary policy over this period.
In short, coming out of the financial crisis and Great Recession years of 2007-09, the Fed was primarily focused on supporting growth rather than fighting inflation – indeed, for most of this period, inflation was below the Fed’s 2% target. Of course, keeping interest rates near zero was part of that plan as was quantitative easing (QE).
However, an equally important component of the Fed’s strategy was forward guidance on rates – essentially, the Fed sought to reassure markets it would maintain ultra-low rates for as long as needed to support growth. This also reassured companies that their borrowing costs would remain low. Even when the central bank did hike, they did so at a glacial pace compared to prior cycles.
The result was a collapse in bond market volatility.
However, as you can see that’s all changed since roughly the middle of 2021 and implied volatility in TLT calls has risen from that 10% to 15% range to an 18% to 25% range in recent months.
This is also by design and it’s part of the Fed’s tightening plan.
You see, the Fed is now fighting inflation not trying to support growth. Thus, they’re raising interest rates and, through a series of supersized 75 basis point hikes last year the Fed has been tightening at the fastest pace in 40 years. The Fed does NOT want the market to believe it’s likely to cut rates aggressively at the first sign of trouble; indeed, Chair Jerome Powell and other speakers have attempted to stress their plan to tighten policy until inflation is clearly back under control.
The near-term, intermediate-term and long-term path and level of interest rates is more uncertain today than it’s been at almost any time in the past 30 years.
My view is that this will continue for as long as the US, and most economies around the world, remain in a more inflationary – even stagflationary -- regime. This will force central banks to balance their mandates to support growth AND control inflation in a way they haven’t done in close to 30 years.
Simply put, I’m bullish Treasuries and believe yields will generally fall over the next 6 to 12 months, because I am looking for the US economy to enter recession. This will likely prompt the Fed to (eventually) cut rates and it should also drive a significant leg lower in the stock market; historically investors flee to Treasuries as a safe haven against a falling stock market.
However, it’s unlikely to be a placid rally for bonds (decline in yields) – I’m looking for more jagged volatility such as we’ve seen since last summer and inflated implied volatility in the fixed income options market.
That adds up to an ideal market environment for a covered call strategy and I believe TLTW could continue to generate superior returns to TLT this year.
As for that final point:
The Proof is in the Pudding
So far this year the TLTW fund is up more than 9% including capital gains and monthly distributions paid, compared to a roughly 4.5% gain in the TLT ETF on the same basis.
Take a look:
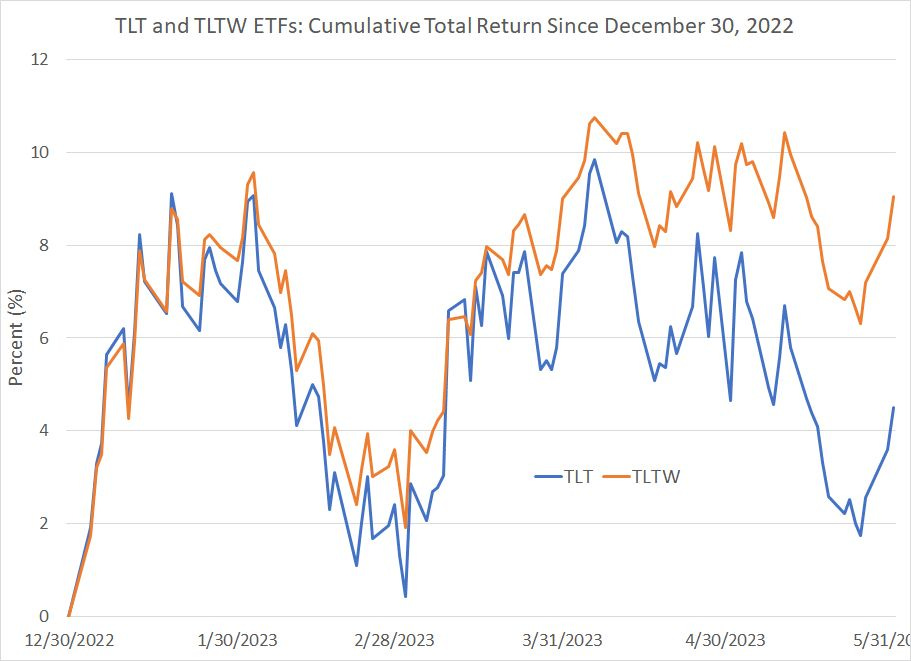
Source: Bloomberg
As you can see, these two ETFs tracked closely through roughly the beginning of February and the divergence grew even more stark starting in late March. That’s due to the rollercoaster ride we’ve seen in expectations for Fed policy, interest rates, inflation and the economy since that time that I just outlined.
Both ETFs pay monthly distributions and TLTW’s monthly payouts reflect both the interest payments made on 20+ year US Treasuries as well as the premiums earned by selling covered calls.
For example, the ETF’s most recent payout was $0.531039 per unit on May 8th. With the stock trading at $33.40 per unit that annualizes to about a 19% yield. So, if you look at a simple price chart of TLTW, you’re not getting the full picture — most of the return from holding this ETF so far this year has come from the monthly payout, not price appreciation.
In Case You Missed It
On Sunday, I announced a new paid, subscription-only tier to The Free Market Speculator.
I know it was a holiday weekend and many of you were busy or hosting start-of-summer barbeques. So, if you happened to miss my announcement, here are the details:
I’m not removing or changing any features of the free version of this publication.
Free FMS subscribers will continue to receive market commentary every Tuesday and Thursday morning at 10 AM Eastern Time along with periodic special issues, updates and alerts. That includes my popular occasional series Myths, Half Truths and Misinformation as well as links to podcasts, interviews and discussions I do for other media and publications.
I won’t be changing the focus of this Substack, which includes commentary related to economic trends, commodities like oil and natural gas, equities and exchange traded funds (ETFs).
The comments section of all free articles remains open for questions, comments or suggestions and all free FMS readers can e-mail me directly right here: freemarketspeculator@substack.com. I can’t promise I’ll respond to every e-mail or comment I receive; however, I will endeavor to do so, either directly or as part of a future article or alert.
The centerpiece of the new paid tier of FMS is a model portfolio. This portfolio includes specific stock and exchange traded fund (ETF) recommendations, advice on when to buy and when to sell, position sizing and ongoing risk management.
To make the portfolio easy to track, I created it with a hypothetical $100,000 initial stake, so readers seeking to follow the recommendations should size their positions accordingly.
The FMS model portfolio is focused on building wealth over the long haul. While there are no guarantees in markets, my main goals are to produce positive absolute returns each year and beat the benchmark S&P 500 over holding periods of 2 to 3 years or longer.
Paid tier readers to FMS will receive subscriber-only posts, alerts, and articles each month outlining my detailed rationale for new recommendations, updates on existing model portfolio holdings, strategy and market updates. I will post at least 2 special subscriber-only model portfolio updates monthly, which will include an ongoing performance summary.
Finally, I’ll be rolling out additional features for the paid FMS tier over the next three months pending subscriber feedback on what frequency would be most useful for readers.
That includes a subscriber-only online “chat,” allowing you to ask any questions you like about the markets, economy, oil prices or specific recommendations in the model portfolio – ask any question on the chat, and I’ll answer it live. The entire Q&A session will be archived for perusal at your leisure.
I’ll also be launching a regular video presentation and market update series, hosted through the Substack platform.
The cost of the new paid FMS tier is $30 per month, or you can select my annual subscription option at a discounted rate of $299. Normally, I’ll be offering a 7-day free trial to FMS for new monthly and annual readers; however, through June 2nd (tomorrow) I’m offering a free 30-day trial to the paid tier using this link:
I’ve been writing and publishing financial newsletters and services for almost a quarter century now, and I’ve always enjoyed interacting with subscribers. That’s why I’ve been a speaker at over 100 conferences and in-person events over the years, and it’s why I first offered a monthly online subscriber Q&A chat to readers way back in 2005.
However, one of the (many) things about Substack I’ve grown to appreciate is this platform facilitates a two-way conversation between writers and readers of a publication like FMS. I can hold conversations with readers on an ongoing basis, not just once a year at a 3-day investor conference in Vegas.
So, I’d like your feedback. If there are any features or specific content you’d like to see in the paid version of FMS, I’d like to hear about it. Simply drop me an e-mail at freemarketspeculator@substack.com or post a comment using the link below:
DISCLAIMER: This article is not investment advice and represents the opinions of its author, Elliott Gue. The Free Market Speculator is NOT a securities broker/dealer or an investment advisor. You are responsible for your own investment decisions. All information contained in our newsletters and posts should be independently verified with the companies mentioned, and readers should always conduct their own research and due diligence and consider obtaining professional advice before making any investment decision.