


ProShares Ultra Bloomberg Crude Oil (UCO): Don’t Fear the Leverage

Some investors avoid leveraged and inverse leveraged exchange-traded funds (ETFs) like the ProShares Ultra Crude Oil ETF (NYSE: UCO), or the inverse equivalent ProShares UltraShort Crude Oil ETF (NYSE: SCO), based on the erroneous view these ETFs do a poor job tracking their benchmarks.
Some brokers have even restricted trading in leveraged and inverse ETFs.
However, rather than avoiding these products out of fear or arbitrary rules, it’s worth learning exactly how they work because in many circumstances leveraged ETFs can be an outstanding way to trade moves in commodities like oil and natural gas or stock indices like the Nasdaq 100 and S&P 500.
The easiest way to illustrate is with an example: The ProShares Ultra Bloomberg Crude Oil ETF (NYSE: UCO) which is designed to track the price of West Texas Intermediate (WTI) crude oil prices.
Specifically, the ProShares website has this to say about the fund’s investment objective:
“ProShares Ultra Bloomberg Crude Oil seeks daily investment results, before fees and expenses, that correspond to two times (2x) the daily performance of the Bloomberg Commodity Balanced WTI Crude Oil Index.”
Source: ProShares
The Bloomberg Commodity Balanced WTI Crude Oil Index is an index designed to track the performance of West Texas Intermediate (WTI) crude oil futures using three different futures roll strategies.
Per Bloomberg, one-third of the index follows a monthly futures roll schedule, one third of the index follows a June annual roll schedule and one-third of the index follows a December annual roll schedule. Here’s how that works in practice:

Source: Bloomberg
This table shows the three contracts tracked by the Bloomberg Commodity Balanced WTI Crude Oil Index on the first business day of each month this year.
For example, the first business day in January 2022 was Monday January 3, 2022 and on this date, the Bloomberg Index was invested equally in 3 contracts: The March 2022 WTI oil futures (33.33% weight), The June 2022 WTI oil futures (33.33% weight) and the December 2022 WTI oil futures.
Starting on January 4, 2022 and ending on January 5, 2022 – the second and third business days of this month – the Bloomberg WTI Index rolled out of the March 2022 WTI oil futures contract and into the April 2022 WTI futures contract. The index would have officially rolled half of its March 2022 futures into April on the 4th of January and the second half on the 5th.
Also note how the index handles the annual roll schedule for June and December.
On the first business days of January – March 2022, this index will track the June 2022 crude oil futures contract. Then, on March 2nd and 3rd this year – the second and third business days of March 2022 – the index would sell the June 2022 futures and buy into the June 2023 futures contracts. By the first business day of April 2022, the Bloomberg Index would hold equal weights in three contracts: June 2022 futures, June 2023 futures and December 2022 futures.
Note that since oil futures with different expirations trade at different prices, the Bloomberg Commodity Balanced Crude Oil Index is NOT the same as tracking the spot price of oil or the front month futures contract.
The reason ETFs like UCO track an Index that includes multiple oil futures contracts rather than just the front month has to do with the extreme dislocations and anomalous trading in the commodity futures market amid the initial coronavirus outbreak in the spring of 2020.
Specifically, on April 20, 2020, front month oil futures (the May 2020 futures at the time) traded to a closing low of negative $37.63 per barrel and to an intraday low of $-40.32/bbl. However, on April 20, 2020, the June 2021 oil futures closed at positive $34.99/bbl and the December 2020 futures sold at $32.41/bbl.
Indeed, the Bloomberg Index also incorporates a failsafe that allows for an adjustment of the roll schedule in the event of what Bloomberg calls a Market Disruption Event (MDE) – such as a temporary suspension of trading by the exchange -- or in any situation where any of the WTI futures contracts tracked by the index settle below a price of $10/bbl.
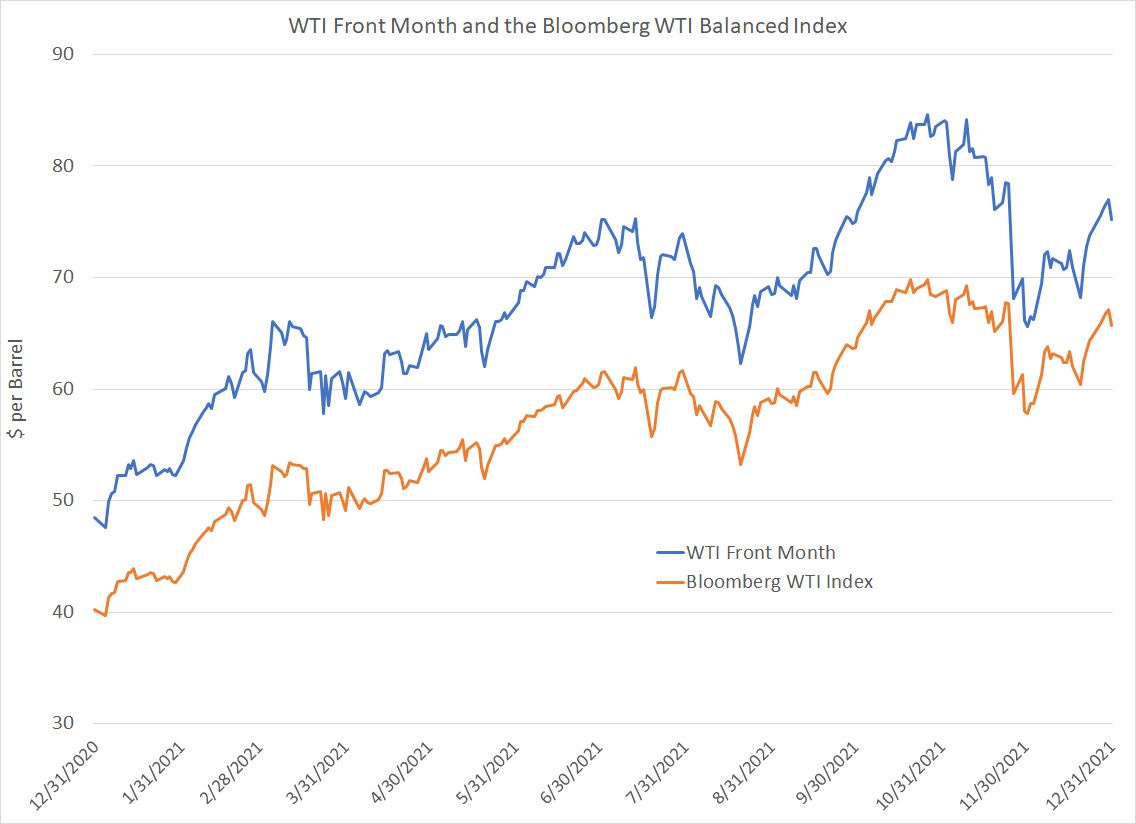
So, here’s a chart showing the front-month price of WTI oil futures from the end of 2020 through the end of 2021 compared to the index value for the Bloomberg WTI Balanced Commodity Index:
Source: Bloomberg
As you can see, the front month price of oil futures settled at $48.52/bbl on December 31, 2020, rising a little over 55% to $75.21/bbl on December 31, 2021.
The WTI crude oil index actually did a bit better than that, rising 63.1% from $40.2599 on December 31, 2020 to $65.6654 on December 31, 2021. Moreover, you can also see from my charts that the trends in the Bloomberg Index and the front-month futures exhibit similar trends – these indices track one another well.
The biggest difference is that the Bloomberg index was slightly less volatile than the front month WTI futures in 2021 – the annualized volatility for front-month WTI futures based on the data in my chart was 34.95% compared to 31.06% for the Bloomberg Commodity Index.
This makes sense because short-term events such as the closure of an important trade route, a hurricane that hits oil infrastructure on the US Gulf Coast, or even the release of barrels from the US Strategic Petroleum Reserve (SPR) can have a major impact on short-term supply and demand conditions for oil but will tend to have only a muted impact on the longer-term outlook.
And this brings me to the point that causes so much angst for investors – the performance of UCO relative to the Bloomberg Commodity Index.
For example, as I just outlined, the Bloomberg Index was up 63.1% in 2021, so you might expect to see the UCO ETF – designed to return twice the Bloomberg WTI Index – up 126.2%. But, UCO actually returned 139.26% last year, about 13 percentage points more than you might expect at first blush..
However, recall that UCO is designed to track twice the DAILY return from the Bloomberg WTI Commodity Index, NOT twice the return over any other holding period.
The key point to understand is that there’s a big difference between twice the daily return and twice the return over a longer period such as one year.
Consider the following table:
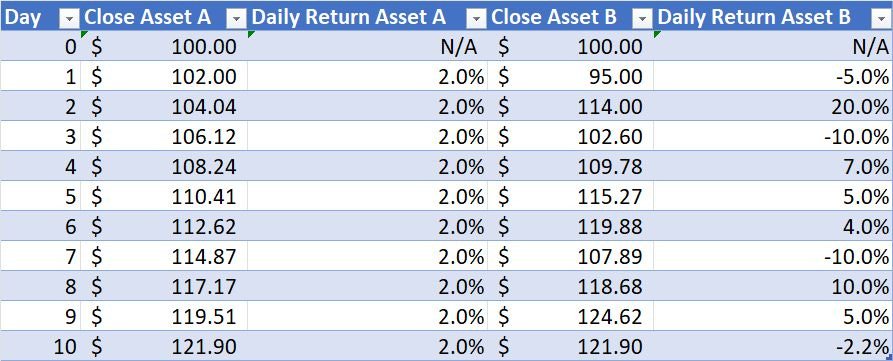
This table shows the performance of two hypothetical indexes I’ve (unimaginatively) dubbed “Asset A” and “Asset B” over 10 trading days.
Both Asset A and Asset B have an initial value of $100 and rise to a price of exactly $121.90 by the close of trading 10 days later, an increase of 21.9%.
The big difference is how they get to that return – Asset A simply generates a 2% daily return, while Asset B swings wildly, jumping as much as 20% in a single trading day and falling as much as 10%; yet, at the close on Day 10, Asset B and Asset A both close at $121.90.
In short, Asset B is a lot more volatile.
So, let’s assume there are leveraged ETFs designed to track the performance of Asset A and Asset B – “Leveraged A” returns twice the DAILY performance of Asset A and “Leveraged B” returns twice the DAILY performance of Asset B.
Let’s Look at what that means for the price of Leveraged A and Leveraged B:

Every single day “Leveraged A” returns 4%, which is twice the 2% daily return of Asset A. Since “Leveraged A” started at $100, it closes at $148.02 on day 10 for a rally of 48.02%.
Recall that Asset A returned 21.9% over the same 10 trading days, so while Leveraged A tracked twice the DAILY performance of Asset A perfectly over these 10 days, it did far better than twice the performance of Asset A over 10 trading days. Specifically, twice Asset A’s 10-day return would be +43.8%, but Leveraged A was up 48.02%.
Now look at Leveraged B, which returned exactly twice the daily performance of Asset B over this 10-trading day period. Yet, Leveraged B closed on Day 10 at $137.87.
In this case, Asset B was up 21.9% and twice that return would be 43.8% just as for Asset A. However leveraged B was up just 37.87% even though it followed its objective of tracking twice the daily performance of Asset B perfectly.
Based on these 10 hypothetical trading days the volatility of Asset A is 0% because it returns the same percentage every business day while the volatility of Asset B is about 149% annualized.
Obviously, this is a simplistic example that’s based on two extreme assets – one with elevated volatility and one with no volatility. However, this hypothetical example reveals one crucial point – when trading leveraged ETFs, it’s important to evaluate the volatility of the underlying index.
The more volatile the underlying asset, the higher the probability a daily leveraged ETF based on that asset will underperform twice the performance of the underlying over longer holding periods.
From Hypothetical to Real: The UCO Example
So, let’s perform the same basic calculations, except using the actual performance of the UCO ETF, the Bloomberg WTI Index I outlined earlier, and an asset that meet’s UCO’s objective perfectly, which I’ll call “Synthetic UCO.”
For ease of comparison, I’m setting Synthetic UCO’s starting price on December 31, 2020 at $36.27, the same as the real UCO.
So, here’s a chart of Real UCO vs. the synthetic UCO from December 31, 2020 to December 31, 2021:

Source: Bloomberg
As you can see, there’s very little difference between these two. In fact, I show real UCO closing at $86.78 on December 31, 2021 compared to synthetic UCO at $87.07.
Real UCO rose 139.26% over this time while synthetic UCO rose 140.06%, a difference of just 0.80%.
This likely reflects a combination of rounding errors and UCO’s expenses.
UCO tracked its benchmark and investment objective closely. And, as I outlined earlier, over a one-year holding period UCO returned considerably more than twice the annual performance of the Bloomberg WTI Index it tracks.
So, that brings me to the key questions:
How much volatility is too much and when should you avoid buying a leveraged ETF that tracks daily returns in this way?
Is it possible that buyers of UCO simply got lucky last year in that the ETF generated more than twice the annual return of the Bloomberg WTI index?
Taking Leverage to Monte Carlo
To answer these questions, I took this analysis one step further using a technique called a Monte Carlo simulation.
The Bloomberg WTI Index had 252 trading days in 2021 and returned 63.1%. The annualized price volatility for this index in 2021 was 31.1%. The DAILY volatility of returns for the index last year was 1.9646% -- the Wall Street convention is to quote volatility on an annualized basis by multiplying the daily volatility by the square root of 250, because there are about 250 trading days each year.
So, what I did is to simulate 10,000 years of hypothetical daily price history for the Bloomberg WTI Index using Excel.
In each simulated case, I started with a beginning value of $40.2599 on December 31, 2020, which is the actual closing price of the Bloomberg WTI Index on December 31, 2020.
I then had Excel create 252 random numbers for each simulation – these represented returns for each simulated “day” of trading history for the WTI Index. And this point is crucial: These random numbers had a mean of 0.1943% and a standard deviation of 1.9646%.
I used the mean of 0.1943% because an index that rises by that amount each day will produce a total return of 63.1% over 252 trading days, in line with the performance of the WTI Index last year. I used a daily standard deviation of 1.9646%, because that’s the observed standard deviation for the same WTI index last year.
Note that because Excel is generating random numbers to create a hypothetical price history for WTI over a one-year period using a specific mean return of 0.1943% per day, the average return for synthetic WTI over the 10,000 simulated years will be about 63.1% -- in the case of the 10,000 simulated returns I created the actual average was 63.09%.
Yet, the daily numbers are still random, and that 1.9646% standard deviation of daily returns is high enough that some of these simulated years will show total returns over 252 trading days that are far higher or lower than 63.1% -- there’s an element of chance at work here, hence the term Monte Carlo simulation.
Indeed, even though the positive daily mean return puts the odds in favor of WTI showing a positive return over a simulated one-year (252 trading day) holding period, that doesn’t always happen – using these parameters 758 of my 10,000 simulations (about 7.6%) showed a negative return over 252 trading days.
Finally, I created a synthetic leveraged ETF to track twice the daily performance of WTI over each of my simulated one year (252 trading day) holding periods.
Here’s what I found:
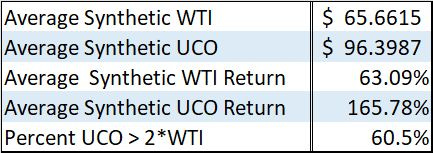
The average closing price for the “synthetic” WTI over 10,000 simulated 252 trading day years was $65.662, which is very close to the actual closing price of $65.665. This represents an annual gain of 63.1% as you’d expect given the parameters I used and the high number of simulations.
However, look at the average percent return over the same 10,000 252 trading day periods from UCO – it’s 165.8%. That’s more than 2.62 times the average annual return from my 10,000 synthetic WTI simulation runs.
As the final row of the table shows, in 60.5% of the 10,000 simulations I ran, the annual return from synthetic UCO was more than twice the annual return from synthetic WTI.
In other words, in more than 60% of cases, UCO gave investors more leverage to the upside in oil due to way it tracks DAILY returns in the Bloomberg WTI Index.
That’s a strong argument for buying UCO to play a rally in oil if your intended holding period is roughly 1 year and you expect gains of that magnitude.
Now, I did the same simulation, but I changed the assumed annualized volatility of WTI from 31.1% to 60% -- this increases the standard deviation of daily returns to 3.7796%. Recall that I use this parameter in Excel to define the standard deviation of daily returns for my 10,000 one-year simulations.
Here’s the results of those 10,000 “year” simulations:

I didn’t change the average mean daily return used to create my simulations, so as you’d expect, the average price for synthetic WTI after 252 trading days was $66.2858, pretty close to the average price of synthetic WTI under my original simulation.
In other words, under these revised simulation parameters, synthetic WTI tended to see wilder day-to-day swings but the average total return over the course of the year was about the same.
And the average return from synthetic UCO was 173.9%, which is still more than double (about 2.69 times) the annual return from synthetic WTI of 64.64%.
The big change: Synthetic UCO only returned more than twice synthetic WTI over 252 trading days in 32.3% of all simulations.
Even though my synthetic UCO tracked 2 times the daily change in synthetic WTI perfectly in all 10,000 simulations, UCO underperformed 2 times WTI over the course of a year almost 78% of the time.
Bottom line: When trading leveraged ETFs, the volatility of the underlying index or commodity you’re tracking is absolutely crucial.
Of course, the mean daily return used to create these simulations is also important – one of the reasons that synthetic UCO produces such strong gains relative to synthetic WTI in my simulations is that I’m assuming a more than 63% rally on average in synthetic WTI over the course of a year (252 trading days).
So that brings me to my final set of simulations:
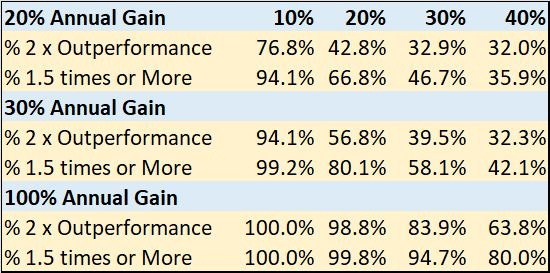
To create this table, I ran simulations of the performance of a hypothetical 2 times daily leveraged ETF tracking an underlying asset over the course of the year. I looked at assets gaining 20%, 30% and 100% over the course of 252 trading days under four different volatility regimes – 10%, 20%, 30% and 40% annualized volatility.
After 10,000 simulated years for each of these parameters, I’ve displayed the percentage of cases where the 2 x daily leveraged ETF exceeded the underlying asset’s return by more than 2 times over the course of a year and the percentage of situations where the ETF beat the asset by at least 1.5 times or more.
As you can see, volatility and expected return both have an important role to play in deciding whether to buy a leveraged ETF. For example, if you’re looking for gains around 20% over the course of a year out of an asset, and the underlying asset tends to show volatility of around 30% annualized, you might want to avoid buying a leveraged ETF on that index. That’s because the leveraged ETF offered a return of 2 times the underlying asset in less than one-third of cases.
In contrast, if the underlying has annualized volatility of around 10%, the ETF will usually outperform.
However, if you’re looking for an asset to double in price (100% return over a year) then buying leveraged ETFs even on assets with 40% underlying volatility made sense in my simulations.
From Simulation to Reality
As I’ve just explained there are 3 parameters to watch when deciding on whether a leveraged ETF is appropriate: Expected holding period, expected returns and the volatility of the underlying asset.
In this piece, I outlined a case for WTI oil prices to rally to $110/bbl in 2022; oil is currently trading at about $83, so a move to $110 would represent a 32%+ gain. Based on weekly data since January 2014, oil’s annualized volatility (based on the Bloomberg WTI index) is 30.5% though if we exclude the anomalous data from 2020, volatility drops to about 26.9%.
Bottom line, given volatility of less than 30%, an expected gain of more than 32% and a holding period of less than a year, the probability that UCO actually performs better than 2 times the rise in the price of oil is close to 60%.
And given that summer in the Northern Hemisphere usually marks a seasonal peak in global oil demand, any spike higher in oil prices this year is most likely to come over the next 6 or 7 months.
With these points in mind, UCO represents a reasonable way to trade this bullish oil outlook.
DISCLAIMER: This article is not investment advice and represents the opinions of its author, Elliott Gue. The Free Market Speculator is NOT a securities broker/dealer or an investment advisor. You are responsible for your own investment decisions. All information contained in our newsletters and posts should be independently verified with the companies mentioned, and readers should always conduct their own research and due diligence and consider obtaining professional advice before making any investment decision.