


Put the Bear Back in the Box (For Now)
I'm looking for new highs in the S&P 500

Staying in a hotel last week I had the occasion to do something I rarely do – I watched business television for about two hours with the sound on.
(Usually, on those rare occasions I watch financial television, the TV is on mute, and I only unmute when I see something, or someone, I’m particularly interested in hearing).
The experience was rather depressing – a lot of talk of tariffs, US sovereign debt downgrades, the “crashing” stock market and spiking yields.
However, for those of us who can be bothered to watch markets and read or listen to corporate earnings reports and economic data releases, this commentary is puzzling.
After all, amid all the talk of spiking yields in response to Moody’s decision to downgrade the United States’ credit rating from Aaa to Aa1, it’s worth noting that the yield on 10-Year Treasuries closed at 4.441% on Friday May 16th, just before the downgrade news and ended a week later at 4.509%.
I’m just not sure a 6.8 basis point rise in the 10-Year over the course of one week represents a notable surge in yields. After all, since June 2020, there have been 1,248 rolling 5 trading day holding periods for the 10-year, and yields have risen more than 6.8 basis points in 424 of those (more than 1/3rd of the time).
And, it’s worth noting that as of the close last week, the 10-year yield had declined under 4.42%, below the trading range prior to the Moody’s decision.
And let’s just look at the chart of 10-Year yields:
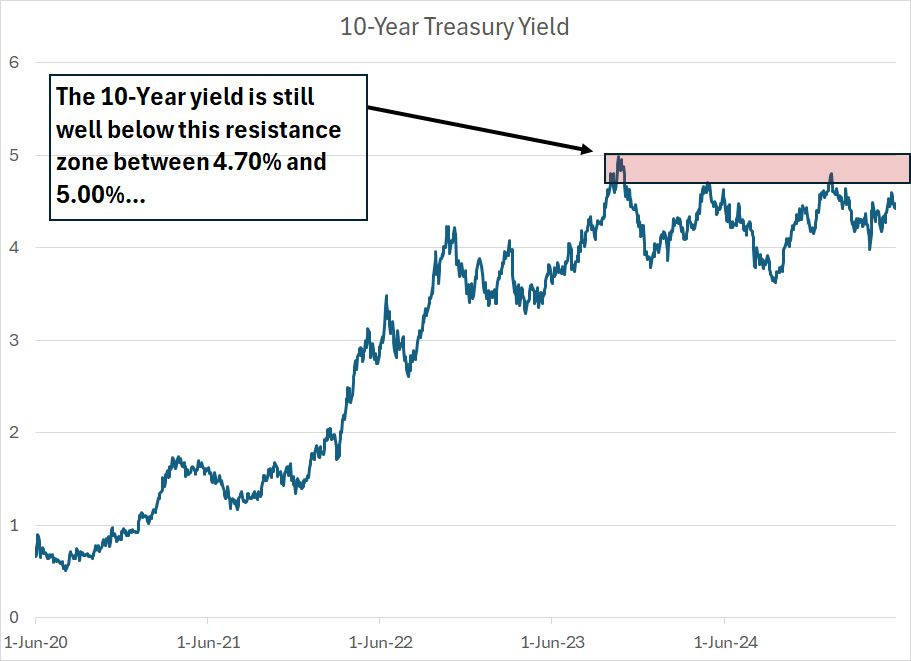
At under 4.42%, the 10-year yield is below a key resistance level that’s been in place for most of the past two years around 4.70% to 5.00%. And yields also remain well below the January 2025 peak at 4.803%.
Indeed, if you’re looking for a message from yields over the past couple of weeks, it’s more likely bullish than bearish Treasury bonds. After all, yields rose to around 4.60% midweek in the knee-jerk Treasury sell-off after the debt downgrade, then rallied hard into the second half of the week (rising prices means falling yields). This past week we got additional follow-through.
It’s also worth noting that as we approach midpoint of 2025, the Bloomberg US Aggregate Bond Index, a broad index of Treasuries, US corporate and mortgage bonds, is still up 2.55% year-to-date, which beats the roughly 0.9% gain in the S&P 500.
Even more important, look at this chart:
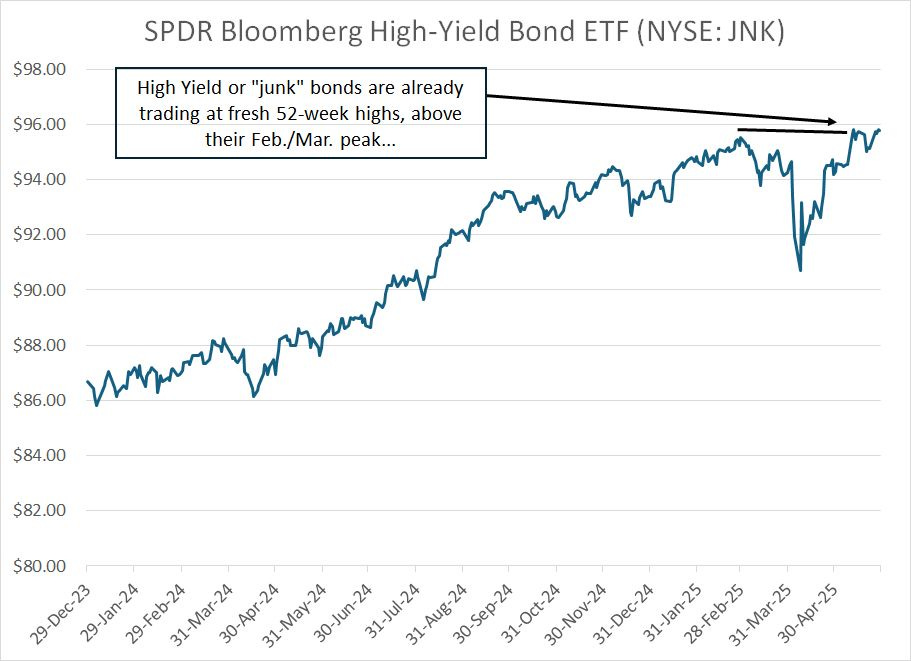
I’ve written about high-yield credit spreads on a few occasions in this service; this chart is simply a slightly different way of looking at the same theme. The SPDR Bloomberg High Yield fund (NYSE: JNK) is a popular exchange-traded fund (ETF) that tracks high-yield or “junk” bonds, which refers to bonds issued by companies with below investment grade credit ratings.
As you might expect, when market participants are worried about a potential recession or some sort of credit crisis, junk bonds tend to get hit hardest as corporates with lower credit ratings could struggle to service their debts should the economy sour.
Look at my chart above and you can see how the JNK fund was hit hard back in March and early April when global markets were in turmoil around tariff concerns and markets began to price in rising probability of a US recession. However, since that time, JNK has rallied to fresh 52-week highs and year-to-date it’s up about 2.72%, which is better than the iShares iBoxx Investment Grade Corporate (NYSE: LQD) ETF up 2.42% and the aforementioned Bloomberg US Aggregate Bond Index up around 2.55%.
Bonds issued by companies with below investment grade credit ratings are outperforming Treasuries and investment grade corporates – that’s NOT what happens when the probability of recession is rising or elevated.
And how about this one:
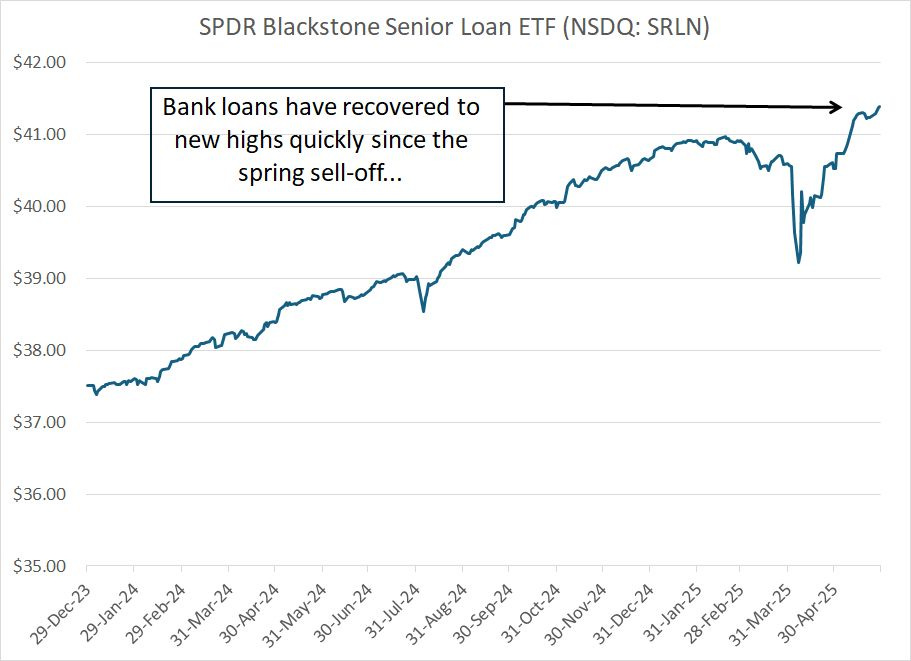
The SPDR Blackstone Senior Loan ETF (NSDQ: SRLN) owns a portfolio of bank loans and it’s one of the more popular ETFs tracking this niche of the credit markets.
Two key characteristics of bank loans are they typically have a lower credit quality than a portfolio of high-yield bonds and carry floating rates that adjust automatically over time based on a spread over key interest rate benchmarks like the Secured Overnight Financing Rate (SOFR) or 90-day Treasury Bills.
In SRLN’s case, 33.17% of the loans in the ETF’s portfolio are rated “B” and just over 30% are rated “B-.” Look at the JNK bond ETF I covered earlier, and you’ll find 50.8% of bonds in the portfolio rated “BB” and 38.14% rated “B.” In other words, SRLN’s average credit quality is lower than JNK.
Given these characteristics, you’d expect to see SRLN underperform investment grade bonds, Treasuries and even some junk bond indices when perceived risk of an economic downturn is higher. You’d also expect SRLN to underperform if markets are expecting the Fed to cut rates dramatically, because a falling Fed policy rate resets the rates paid on corporate loans lower, reducing the yield on SRLN’s portfolio.
The fact that SRLN recovered its springtime losses quickly and is now breaking out to fresh highs, suggests receding worries about the health of the US economy and growing expectations for the Fed to hold off on rate cuts until the end of this year or even forgo a cut entirely in 2025.
There’s a common view that fixed income markets represent the smart money and equities (stocks) the dumb money. I’m not sure that’s entirely true; however, I believe it’s crucial to watch the messages you’re getting from fixed income and credit markets and compare those to what we’re seeing in the economic data and stock market.
And right now, the bond market is telling us the headlines about tariffs, the US credit downgrade and handwringing about rising risk of recession don’t matter – the US economy looks OK, at least for now.
And someone please tell the pundits on TV that the bond market isn’t crashing.
Treasury yields are in the middle of a range that’s been in place for more than two years now and are down (prices up) since the Moody’s US debt downgrade.
Meanwhile, in aggregate, the US bond market is beating the S&P 500 year-to-date while more economy-sensitive corners of the fixed income and credit markets are leading coming off the April lows and breaking out to fresh highs.
One more quick chart on this topic and then I’ll move on:
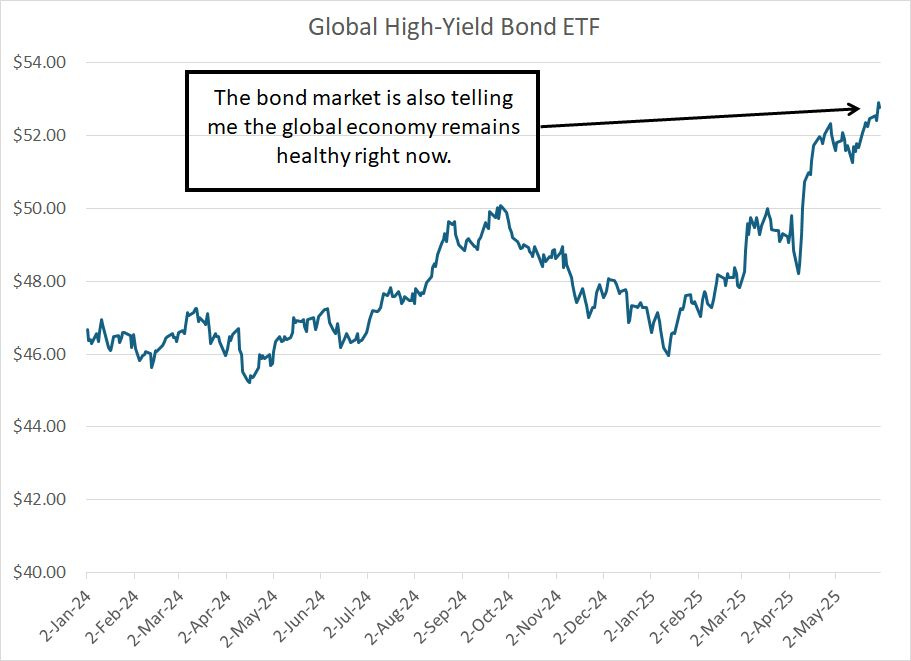
This is a chart of an ETF I recommend in sister publication Smart Bonds, which tracks the global high-yield bond market. These are bonds issued by companies in currencies other than the US dollar, which carry below investment grade credit ratings.
About two-thirds of the portfolio is in bonds rated “BB” with an additional 27% in bonds rated “B.”
As you can see, this ETF has been a strong performer this year, jumping almost 12.5% year-to-date. That’s slightly better than the roughly 11.3% gain in the Bloomberg International Corporate Bond Index, which tracks investment grade corporate bonds issued in currencies other than the US dollar.
Again, this is NOT what you’d expect to see if markets were worried about a global recession or a major disruption to global supply chains and trade caused by US trade policy.
I believe we’re getting a similar message from equity markets as well:
Refiners and Energy Demand
Refiners are rather unique in the energy industry because they don’t make money from rising oil or natural gas prices.
Rather, refiners are essentially manufacturing companies in the business of converting raw crude oil into usable products like gasoline, diesel, jet fuel and heating oil. Thus, crude oil represents a refiner’s largest cost center – oil is a raw material they must buy to manufacture refined products, so rising oil prices can harm refining profit margins.
Instead, refiners make money based on the so-called “crack spread,” the relative prices of crude oil, gasoline and diesel. Simply put, when gasoline and diesel prices are stronger than oil prices, refiners’ profit margins will expand.
A simple rule of thumb to remember is that refiners are sensitive to energy demand.
Of course, when demand for gasoline and diesel rises, that will ultimately mean an increase in demand for crude oil, which is likely bullish for crude. However, oil prices also have significant supply factors to consider – OPEC production policy and shale producer capital spending (CAPEX) decisions are just two of the most powerful supply side factors that can overwhelm changes in demand and influence oil prices.
A classic example is that back in the summer of 2015 when oil prices had collapsed from their 2014 highs over $100/bbl to the $40/bbl range. Most energy stocks were hammered as a result – the SPDR Energy ETF (NYSE: XLE) plunged more than 40% from its summer 2014 peak to its summer 2015 lows.
However, crude oil prices fell because of a prominent change in OPEC production policy starting in November 2014 in response to a massive surge in US shale production – the decline in oil prices starting in late 2014 was driven entirely by surging supply, NOT weak demand.
Indeed, lower gasoline prices in the summer of 2015 relative to the norm in the prior three years resulted in a major surge in US gasoline demand during summer driving season that year. As a result, US refining stocks performed well in this period – Valero (NYSE: VLO), for example, jumped over 70% from its late 2014 lows to its mid-2015 highs.
What’s interesting right now is that we’re seeing a similar dynamic – gasoline and diesel prices in the US are holding up better than West Texas Intermediate (WTI) crude oil and refiners are outperforming most other corners of the energy markets.
The only significant exception to that is stocks levered to natural gas, a theme I’ve covered at some length in this service and something we’ve been benefiting from in the model portfolio.
Take a look:
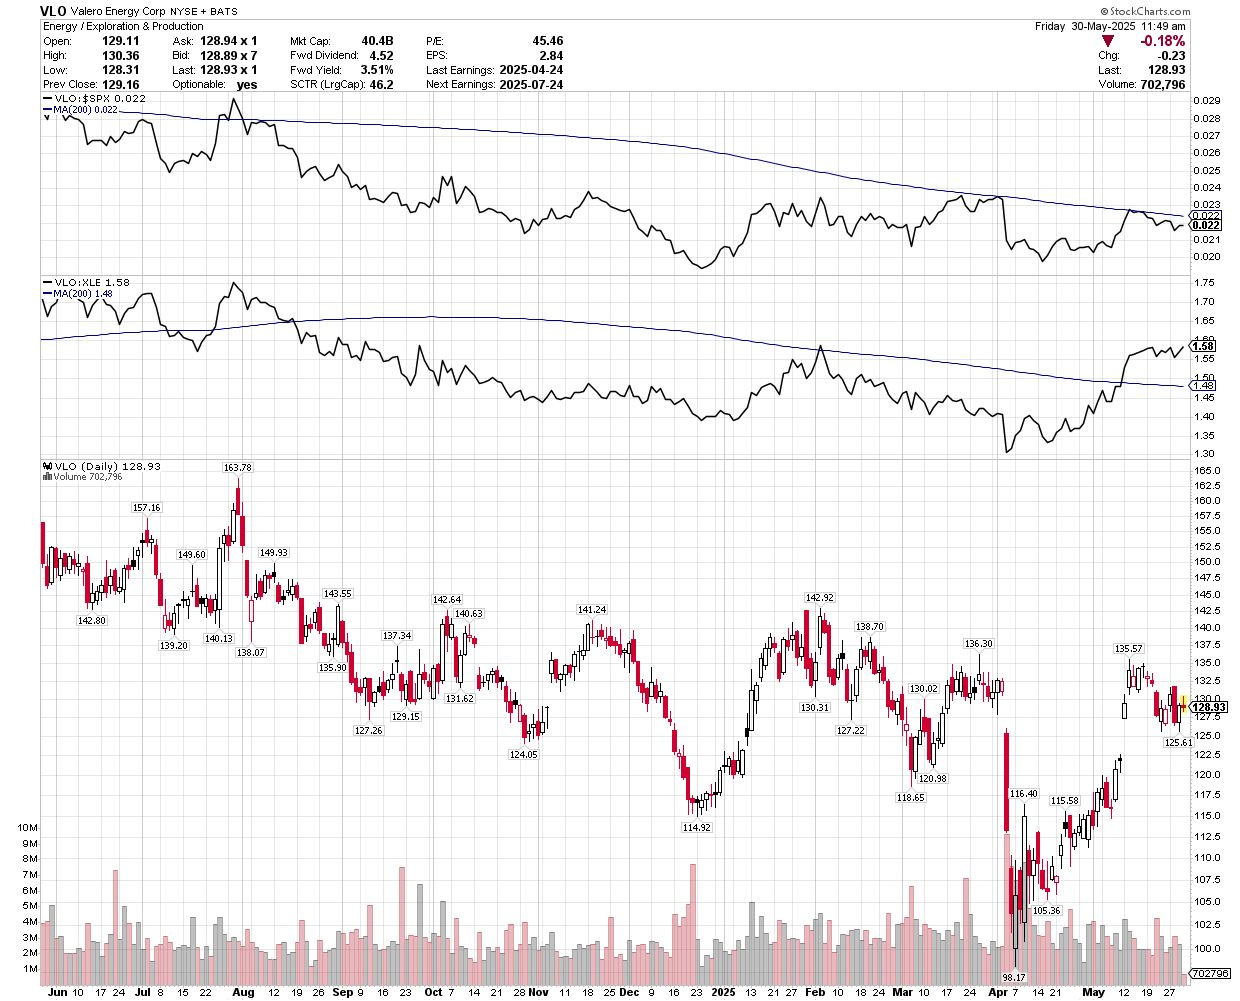
Source: Chart Courtesy of StockCharts.Com
This is a chart of Valero Energy (NYSE: VLO), the largest independent refiner in the US that’s active in the refined product export market as well.
The top pane of my chart shows VLO’s performance relative to the S&P 500 while the middle pane shows the performance of VLO relative to the XLE energy sector ETF. As you can see, VLO outperformed both the S&P 500 and the rest of the energy sector coming off the early April lows.
And while the S&P 500 has played a little bit of catch-up since mid-May, VLO is the strongest relative to the rest of the energy sector than it’s been in almost a year.
As I wrote in “What’s Working Now,” I believe oil prices are finding a low and are likely to trade significantly higher later this year. After all, oil has been steady in the face of OPEC’s decisions to return production at a far faster pace than investors had expected. It’s also increasingly clear US shale production is more likely to fall significantly into late 2025 than rise, and that probability grows the longer oil prices remain below $70 to $75/bbl.
However, the strength in refiners specifically also suggests there may be a bullish demand side story this summer as well – if demand for energy were truly weak heading into summer, then I’d expect refiners to be underperforming the energy sector.
Strong energy demand has bullish implications for US and global economic growth.
And consider this:
Consumer Strength
Amid all the talk of flagging consumer confidence this year, talk of empty store shelves and significant inflation caused by US trade policy it’s worth noting that many consumer stocks are performing well right now.
When consumers are stressed, they cut back on what they want – discretionary spending – so that they can better afford what they need. Cruises are clearly an example of discretionary spending and strength in cruise line stocks like Royal Caribbean (NYSE: RCL) of late suggests the US consumer remains healthy:
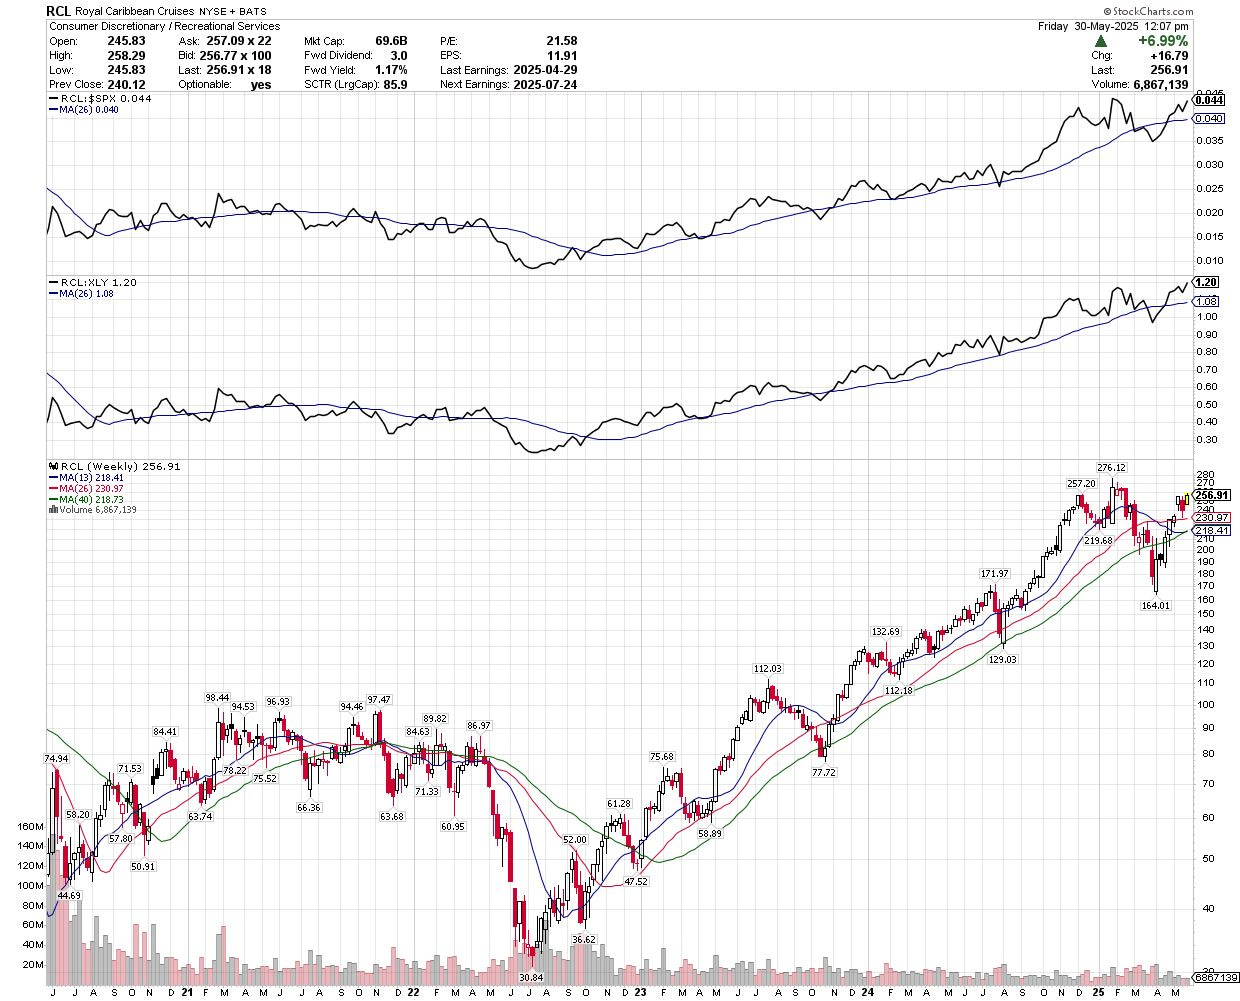
Source: Chart Courtesy of StockCharts.Com
Here’s a five-year weekly chart of Royal Caribbean (NYSE: RCL). I’ve included RCL’s relative strength to the S&P 500 in the top pane of my chart and relative to the SPDR Consumer Discretionary ETF (NYSE: XLY) on the middle pane.
As you can see, shares in RCL have surged 56.7% from their April lows and recently broke out to a fresh multi-year relative strength high compared to the rest of the Consumer Discretionary Index. RCL is also close to breaking out on a relative basis to the S&P 500.
Does that seem like the hallmark of a collapsing US consumer to you?
And that brings me to this:
That 2018 Moment
In recent years, markets have had an increased tendency to carve out “V-Shaped” lows.
It’s one of the main reasons I decided to suspend our stop-on-close recommendations back in early April, despite the persistent weakness in stocks in March-April and the S&P 500’s collapse below its 200-day simply moving average.
It’s also why I’ve recommended adding long-side exposure to the model portfolio over the past few months. I just don’t trust weakness in the broader market catalyzed by news headlines and popular market narratives because they’ve tended to be head-fakes and bear traps in recent years. That’s particularly true when we’re just not seeing any signs of weakness in the high-frequency hard economic data like the weekly initial jobless claims numbers.
To be clear, I still see some potential worries on the horizon for the US economy and markets including a growth payback or distortion caused by the pre-tariff surge in imports back in March or, perhaps, some sort of delayed surge in inflation later this year. However, those increasingly look like worries for the final quarter of 2025 or early 2026 rather than something that’s likely to impact markets this summer.
As always, I prefer to follow the lead of the economic and market indicators rather than trying to make forecasts or predictions about the distant future – right now, as I’ve been outlining in recent updates and alerts, the short-to-intermediate term outlook remains bullish.
One corollary to the current market environment is the fourth quarter of 2018:
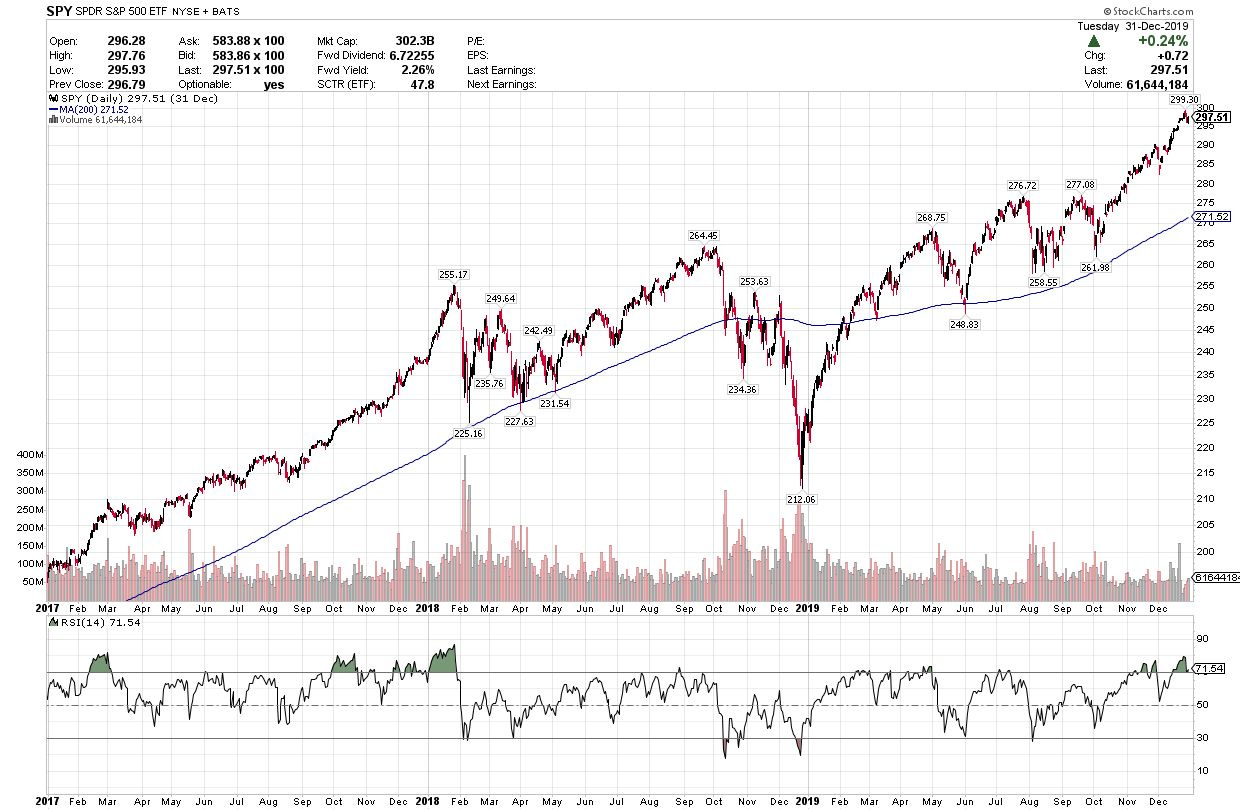
Source: Chart Courtesy of StockCharts.com
This is a chart of the S&P 500 from the end of 2016 through to the end of 2019.
What’s interesting is that the stock market was strong in 2017; indeed, it was the lowest volatility rally – the smoothest rise for stocks – since the mid-1960s that year.
The bull market accelerated in January 2018, ending with an abrupt crash into early February of that year. In the summer of 2018, the S&P 500 rallied once again, reaching fresh highs in September followed by a nasty sell-off in Q4 2018 that took stocks down almost 20% on a closing basis by late December 2018.
Then, as in March-April this year, the S&P 500 spent several weeks under its 200-day moving average, which turned lower towards the end of December 2018.
A classic shift in the primary trend.
Just look at that “V” on my chart.
The bears abruptly lost control in late December and the S&P 500 went vertical, hitting fresh cycle highs by April-May 2019. There were some pullbacks and corrections in the summer of 2019; however, stocks ultimately rallied into early 2020, peaking just ahead of the COVID lockdown crash and recession.
What’s interesting to me is that in 2018, like today, fixed income led the S&P 500 off the low:
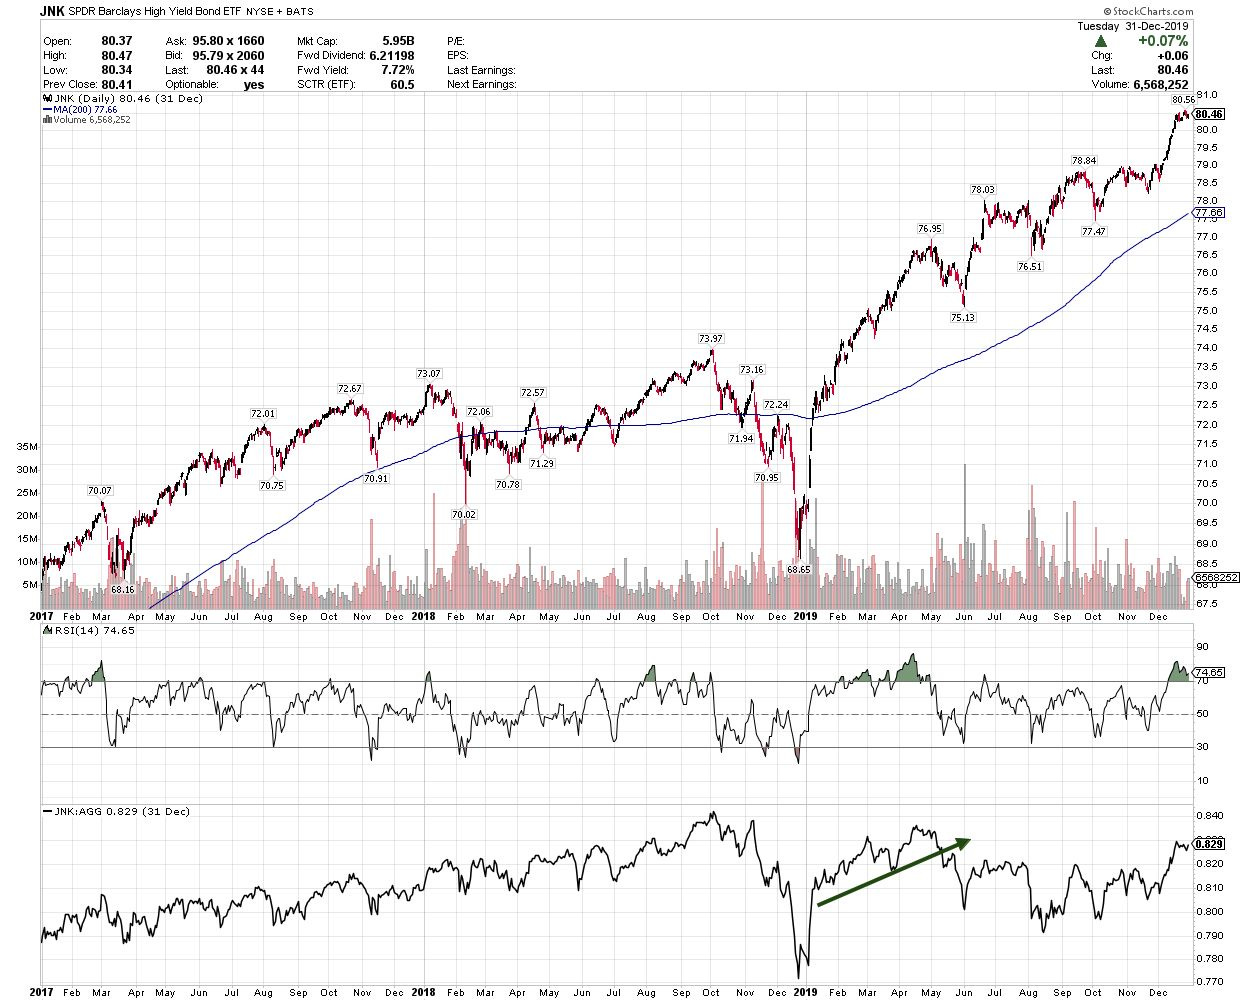
Source: Chart Courtesy of StockCharts.com
This is a chart of the SPDR Barclays High Yield Bond ETF (JNK) I wrote about earlier on in this update over the same period as my chart of the S&P 500 just above.
Like the S&P 500, high yield bonds got hit in early 2018 and hit harder in Q4 2018. However, by early February of 2019 – more than two months before the S&P 500 – the JNK fund was already logging new cycle highs, a sign that markets weren’t worried about the health of the economy.
The lowest pane of my chart shows the relative strength of JNK to an ETF that tracks the Bloomberg US Aggregate Bond Index. Note, in particular, that JNK dramatically underperformed the broader US bond market in December 2018, a sign of rising concerns about the health of the US economy.
However, into early 2019 JNK surged on both an absolute AND relative basis (I’ve drawn a green arrow to indicate this). That’s a sure sign of falling recession risks, and it’s similar to the pattern we’re seeing in high-yield bonds again this year.
Since early April I’ve been calling for a significant bear market rally in the S&P 500 this spring.
The extreme selling pressure into early April – at the lows fewer than 14% of NYSE stocks were trading above their respective 200-day moving averages – is one common hallmark of an important low. So too the gloomy sentiment evident in Bank of America’s April Global Fund Manager Survey showing a whopping 49% of fund managers expecting recession and average positioning 2 standard deviations underweight US stocks.
That call has worked, and we’ve certainly seen a powerful rally since President Trump announced a 90-day pause in most tariffs for all countries except for China in early April. Of course, that initial pause has been followed up with additional de-escalation including a trade deal with the United Kingdom and a deal to reduce US tariffs on China from 145% to 30% for 90 days and for China to reduce tariffs on the US from 125% to just 10%.
Indeed, following the larger-than-expected drop in US-China tariffs in May, the S&P 500 has popped back above its 200-day moving average, a technical level I’ve flagged as an initial target for a bear market rally from the April lows:
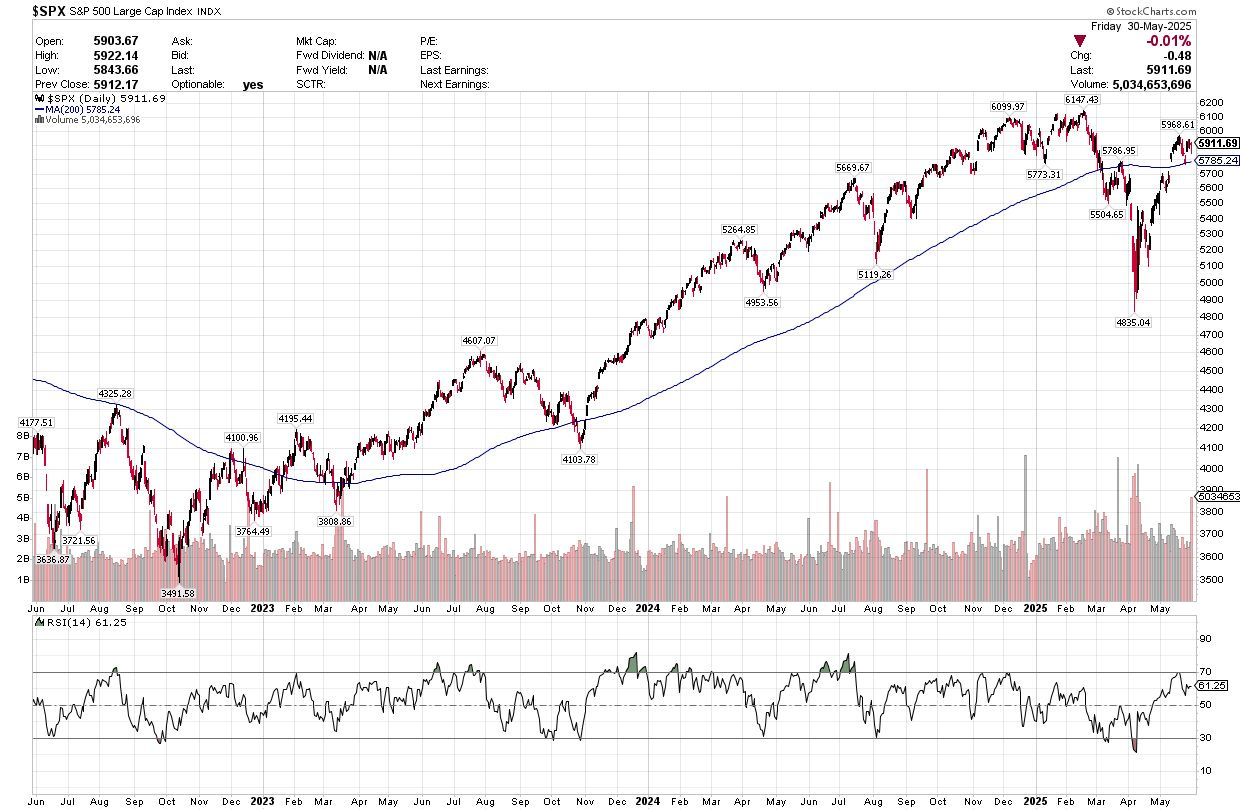
Source: Chart Courtesy of StockCharts.Com
As you can see, following May’s tariff pause announcement with China, the S&P 500 gapped higher, straight through the 200-day and an additional level of technical resistance at the peak of the late March rally in stocks.
While the 200-day was my initial target for the rally from the April lows, I see more upside ahead for the broader market this summer, likely to fresh all-time highs.
And that brings me to this:
Breadth and Broadening Participation
Stock market breadth has been positive in recent weeks.
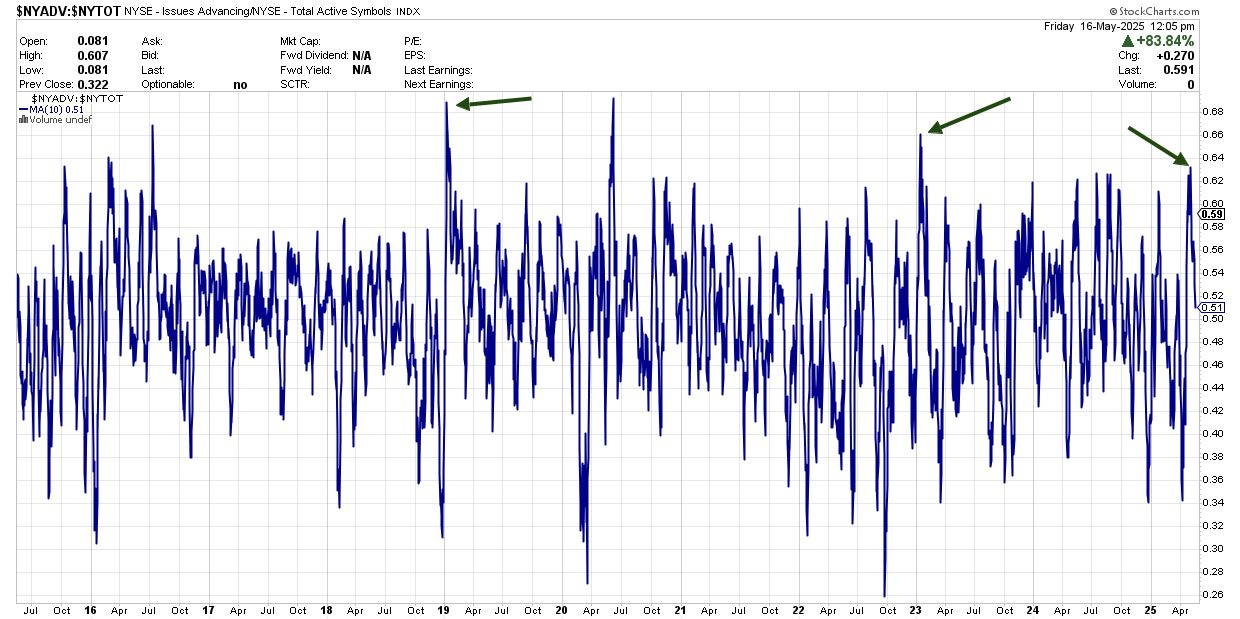
Some of you may have heard of a technical indicator called a Zweig Breadth Thrust (ZBT), named after its developer Martin Zweig. Specifically, Zweig looked at the 10-day moving average of advancing stocks on the New York Stock Exchange (NYSE) as a percentage of total issues. Situations where the 10-day moving average moves from less than 40% advancers to more than 61.5% over a period of 10 trading days or less triggers a ZBT.
It's a rare bullish signal that’s triggered just 16 times since the late 1950s and in all cases, the market traded significantly higher over the ensuing 6 and 12 months with average gains of 16% and 24% respectively.
Here’s a chart:
Source: Chart Courtesy of StockCharts.Com
I’ve marked a handful of recent ZBT signals on the chart including early 2023, at the start of the rally from the late 2022 lows, and early 2019, just as the market emerged from that nasty late Q4 2018 sell-off I’ve written about on a few occasions in this service.
The ZBT triggered most recently on April 25th.
I have no idea whether there’s anything magic about the exact levels that trigger a ZBT, but the basic concept is sound – a shift from extreme selling pressure to powerful upside momentum over a period of less than two weeks (10 trading days) is essentially the definition of a washout low for the broader market.
It’s similar in concept to this chart I’ve posted before in this service:
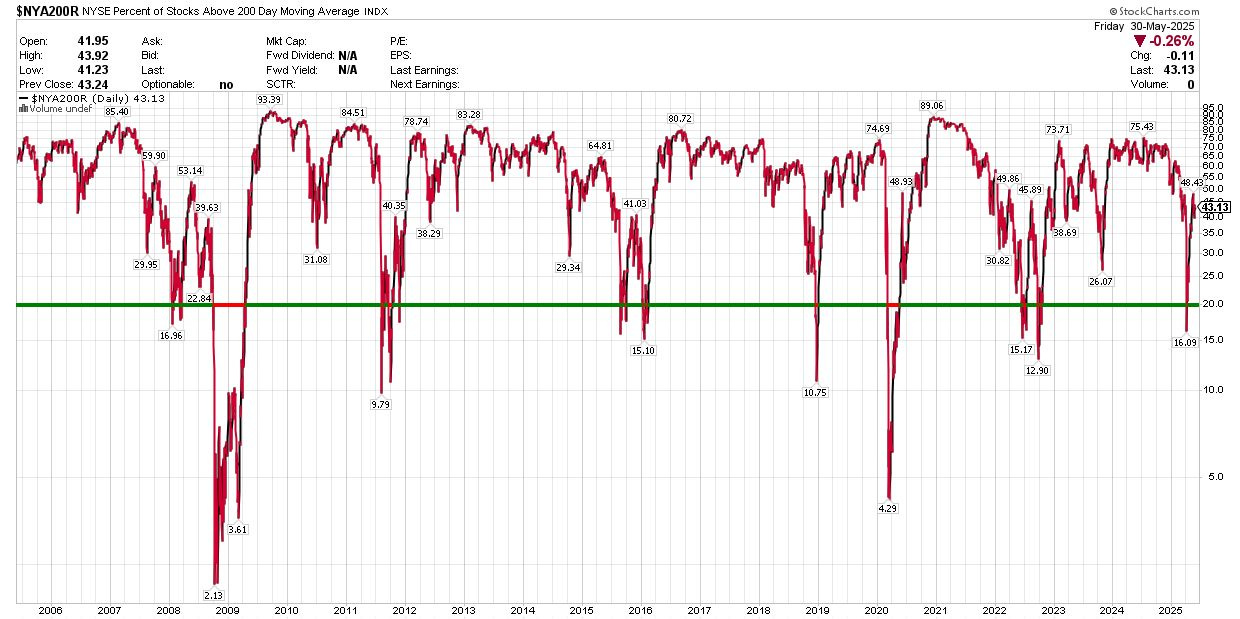
Source: Chart Courtesy of Stock Charts.com
This chart shows the percentage of NYSE stocks trading above their respective 200-day moving averages; I drew that thick horizontal line at the 20% level.
Generally, when you see this line fall below 20% on a closing basis and then quickly recover back to above 20%, that marks an important low for the market. Sometimes you’ll see retests of the low – such as in the summer of 2015 and early 2016 – however it’s provided some very useful signals such as the spring of 2020, early 2019 and the second half of 2022.
With those points in mind, here’s what I’m recommending this week:
Keep reading with a 7-day free trial
Subscribe to The Free Market Speculator to keep reading this post and get 7 days of free access to the full post archives.