

Rate Cuts, Goldilocks Now and the Dollar’s Smile
Rate Cuts, Goldilocks Now and the Dollar’s Smile
Plus an ETF to benefit from the dollar's slide...

The change in expectations for interest rates and Fed policy in recent weeks is nothing short of breathtaking.
A little over a month ago, the consensus on Wall Street was “higher for longer,” with 40% probability of one more Fed hike by January 2024 followed by perhaps 50 basis points of cuts late in the year. The yield on the 10-year Treasury closed at 4.99% and the 30-year at 5.11%.
Today, here’s what the market sees from the Fed:
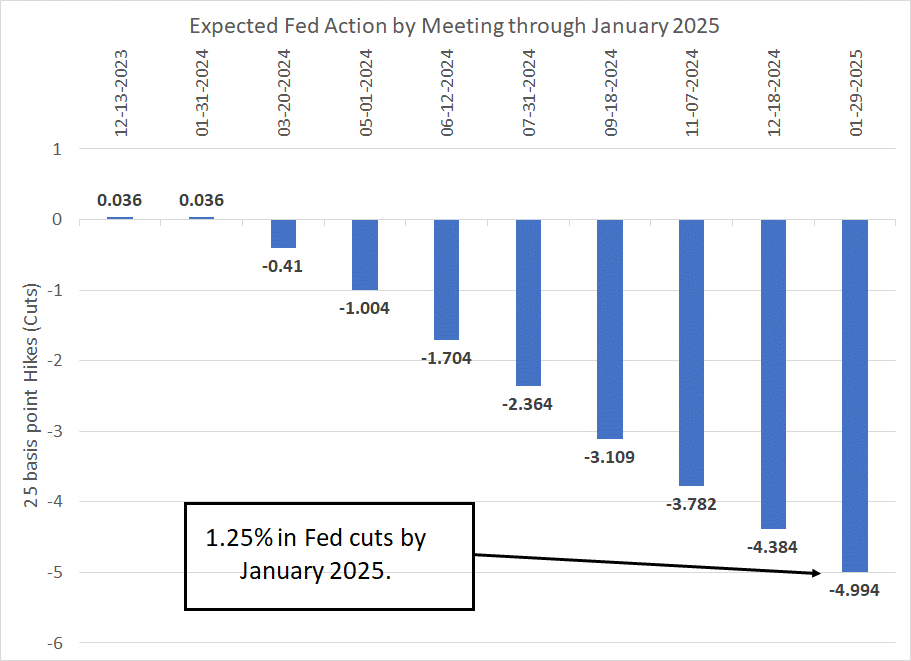
Source: Bloomberg
As you can see, Fed Funds futures are now pricing in near-zero chance of an additional Fed rate hike this cycle followed by a 41% probability they cut on their March 20, 2024 meeting and 100% probability they cut at least once by the time of the FOMC meeting on May 1, 2024.
By the time of the Fed’s January 29, 2025 meeting, just 14 months from today, the market sees the Fed cutting 125 basis points (that’s five 0.25% cuts). The yield on the 10-Year Treasury plummeted as much as 73 basis points from its closing high on October 19th while the 30-year yield sank about 67 basis points over a similar time frame.
As is their wont, equities have embraced the glass-half-full view, interpreting the more benign rates outlook as a compelling reason to buy stocks. In the final stretch of the the final day of November, the S&P 500 is up 8.65% this month, the Nasdaq 100 is up 10.7% and the long-suffering Russell 2000 has outperformed the broader market for a change, rising 9.1%.
I’ve been writing a good deal about the strong probability of a year-end seasonal rally in stocks this year including my October 13th post on Free Market Speculator, “Santa Claus and the Dip-Buyers,” as well as the October 24th post “Market Breadth and Q4 Rallies.”
And this remains my view – while it would not be at all unusual for the stock market to take a breather after such a strong advance, history suggests we could see continued strength into January 2024.
Further, seasonal rotation in stocks over the next few months should continue to support some laggard stocks and indices, particularly the Russell 2000.
Just consider this tidbit I’ve written about in the paid tier to Free Market Speculator in recent weeks:
Through the first 10 months of 2023, the Russell 2000 underperformed the S&P 500 by more than 15 percentage points, the largest performance gap in more than three decades (since 1990).
There have only been 7 years in the past 33 (excluding this year) where the S&P 500 has underperformed the S&P 500 by more than 7.5 percentage points through October 31st, which is roughly half the underperformance we saw in 2023.
In six of those 7 cases, the Russell 2000 went on to outperform the S&P 500 in the final 2 months of the year (85.7% of the time) by an average of 3.9 percentage points.
On the single occasion (out of 7 cases since 1990) where the Russell went on to underperform the S&P 500 in the final two months of the year (1998) the Russell 2000 underperformed by just 0.42% and was still higher by 11.75%. Relative performance notwithstanding that’s a pretty strong finish.
Goldilocks Now
In the short term, I see no immediate obstacles to further market upside from financial conditions either. In “Treasury’s Payday Loan Problem,” I explained how money market funds in the US hold more than $5.7 trillion in assets, up more than $1 trillion from October 2022.
Since June, these funds have been withdrawing assets from the Fed’s Reverse Repo Facility (RRP) and buying Treasury Bills. The breathtaking decline in RRP has both enabled the US government to borrow massive sums to finance its eye-popping deficit and has allowed for growth in bank reserves despite the Fed’s quantitative tightening (QT).
That pattern continues:
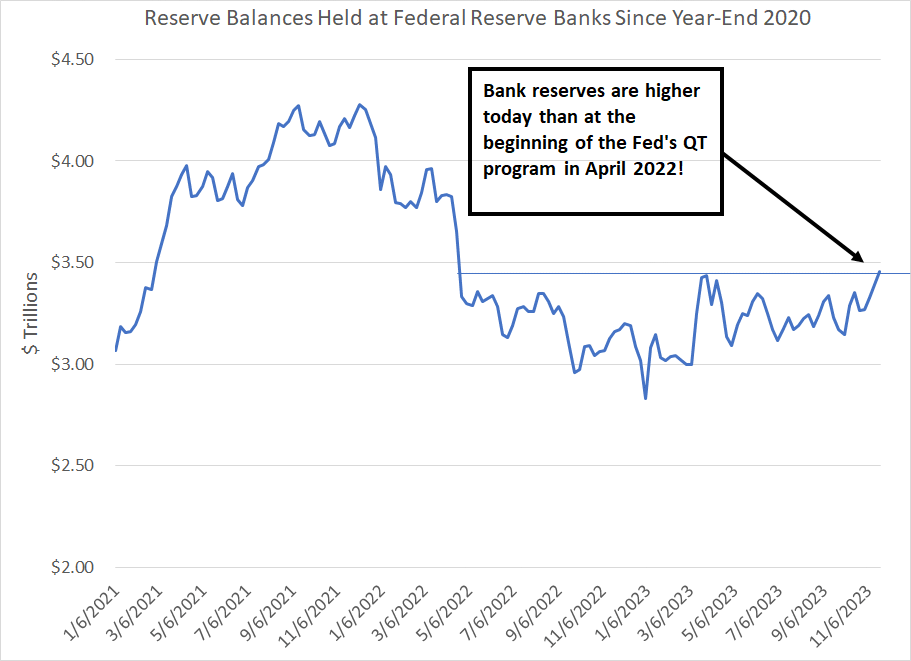
Source: Bloomberg, Federal Reserve
Indeed, as of the most recent data released by the Fed one week ago, total reserves in the US banking system stand at $3.45 trillion, up from a low of $2.83 trillion in January of this year. Indeed, US bank reserves are actually higher today than any time since April 2022, just when the Fed was beginning its quantitative tightening (QT) program.
When you consider the theoretical point of QT is to drain bank reserves and tighten credit conditions, it doesn’t seem the policy is working quite as planned this year.
Put in a different way, take a look at my chart above and you’ll see that bank reserves did fall – rather aggressively I might add – from early 2022 through the autumn and winter of that same year. Since January 2023 they’ve generally been rising – this corresponds neatly to the performance of the S&P 500, and the interest-rate sensitive Magnificent 7 stocks which dominate that index, in the form of a big 2022 sell-off followed by a rally this year.
Simply put, I see no reason why this Goldilocks scenario of moderate economic growth, benign credit conditions and a US government deficit funded by T-Bills can’t continue in the short term.
Apres Moi, Le Deluge
That’s a quote attributed to Louis XV, King of France for 59 years in the 18th century. It translates to “After me, the flood,” a reference to the Biblical flood in Genesis.
King Louis was right.
His grandson, Louis XVI, ascended the throne in 1774 and was beheaded in 1793 amid the French Revolution. Of course, one of the main drivers of the fall of monarchy in France, and his grandson’s execution, was an economic depression caused, in no small part, by ruinous spending and a series of military defeats during the reign of Louis XV.
I continue to see signs of economic weakness in the US, including a softening in the labor market and Walmart’s (NYSE: WMT) cautious tone on the US consumer I wrote about earlier this week in “Don’t Forget the Micro Tells.”
Further, the Reverse Repo Facility (RRP) at the Federal Reserve – the pot of money market fund cash that’s funded the US government and bank reserves since June – now contains less than $1.3 trillion, down $1.35 trillion in just six months since the end of May.
A back-of-the envelope calculation suggests the RRP could be empty at some point in Q2 2024 with money market funds shifted entirely to T-Bills. That would, at a minimum, make it more difficult for bank reserves to grow and for the Fed to continue its QT program without tightening credit conditions.
Much like Louis XV, the good times can roll for now but there are serious storm clouds on the horizon for 2024 and I expect we’ll be breaking out that trusty recession playbook at some point in the first half of 2024.
And that brings me to:
The Dollar’s Smile
About 20 years ago a currency analyst named Stephen Jen floated his dollar smile theory.
In a nutshell, Jen’s theory argued the US dollar tends to gain value against other currencies in environments where the global economy is strong, particularly when the US economy outperforms (good times). On the other hand, the dollar also tends to perform well amid global recessions as a “flight to safety” trade (bad times).
It’s the middle environment – neither a boom nor a bust – that tends to see the dollar weaken.
That basic idea describes the pattern in the currency through 2022-23 quite well:
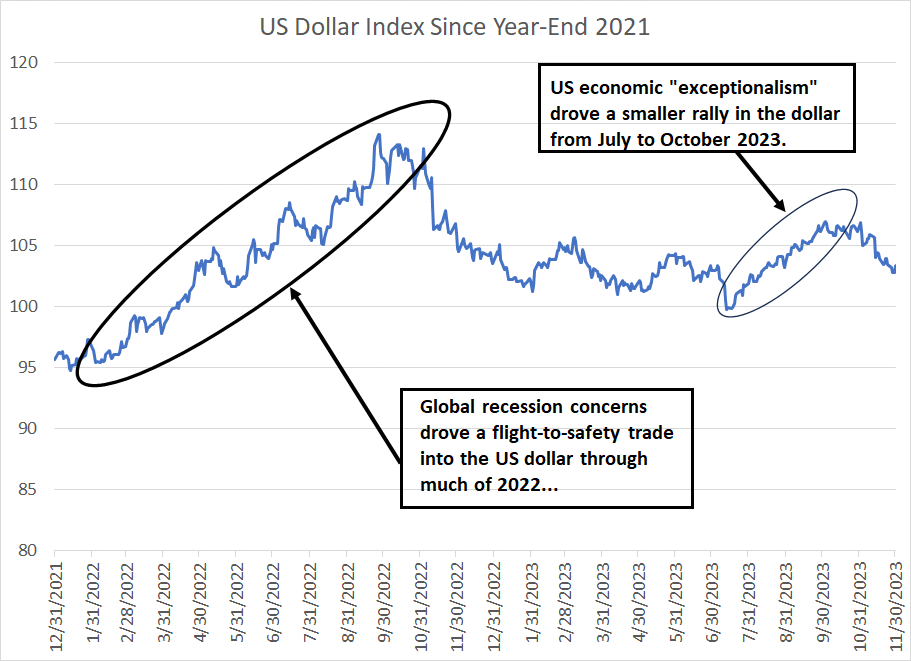
Source: Bloomberg
As you can see, the dollar benefited from a flight-to-safety trade through much of 2022 as traders fretted about a global recession, the Ukraine-Russia conflict and soaring commodity prices among other factors.
The dollar also appeared to benefit from the other side of Jen’s dollar “smile” in a short-but persistent rally from July through October 2023. Recall, this corresponds to the period when the narrative shifted in favor of US economic exceptionalism as the US economy appeared to outperform both Wall Street expectations and other major developed regions of the world, including Europe and Japan.
Adding to the case for the dollar was the gap between Federal Reserve policy and that of other major central banks around the world. The Bank of Japan, for example, is taking a gradual approach to removing the extreme accommodation of the past decade including its “yield curve control” policy. And the European Central Bank (ECB) appeared somewhat less inclined toward significant additional hikes than their counterparts at the Fed.
That left the dollar with a significant yield advantage – interest rates were higher in the US than other developed countries in real terms and that tends to lead to a stronger currency.
However, the shifts in market narrative since the end of October – in particular, the fading “higher for longer” narrative on rates – have catalyzed a break lower in the US dollar once again.
It appears we’re back in the bottom part of Jen’s “smile” as strong Q3 US economic growth is showing signs of fading into Q4 and the Bloomberg Economic Surprise index has come crashing back to Earth since late September:

Source: Bloomberg
The Bloomberg Economic Surprise Indices examine how incoming economic data compares to analysts’ consensus expectations where a rising Surprise Index suggests better-than-expected data, and a falling index the opposite.
This chart shows the US version (blue line) and the Eurozone version (orange line). Notice how these two indices tracked closely from the middle of 2022 through to roughly April of this year. Then, there was a remarkable divergence, where European data began to deteriorate while the US economy surprised to the upside.
The gap is now closing once again with US economy exceptionalism fading while the Eurozone begins to improve.
However while expectations for the US economy appear to be cooling, we’re not yet at the “Global Recession” and flight-to-safety part of the dollar Smile trade. Some three-quarters of fund managers surveyed by Bank of America this month anticipate a soft landing for the US economy with no recession over the next year. At the same time, most are looking for the rate of economic growth to recede.
My view is that this “Goldilocks” situation could continue for some time and headwinds for the dollar could persist well into 2024 until the still-likely US recession comes into view, sparking a flight-to-safety trade into the US dollar.
Historically, one of the biggest beneficiaries of a weaker dollar is emerging markets:
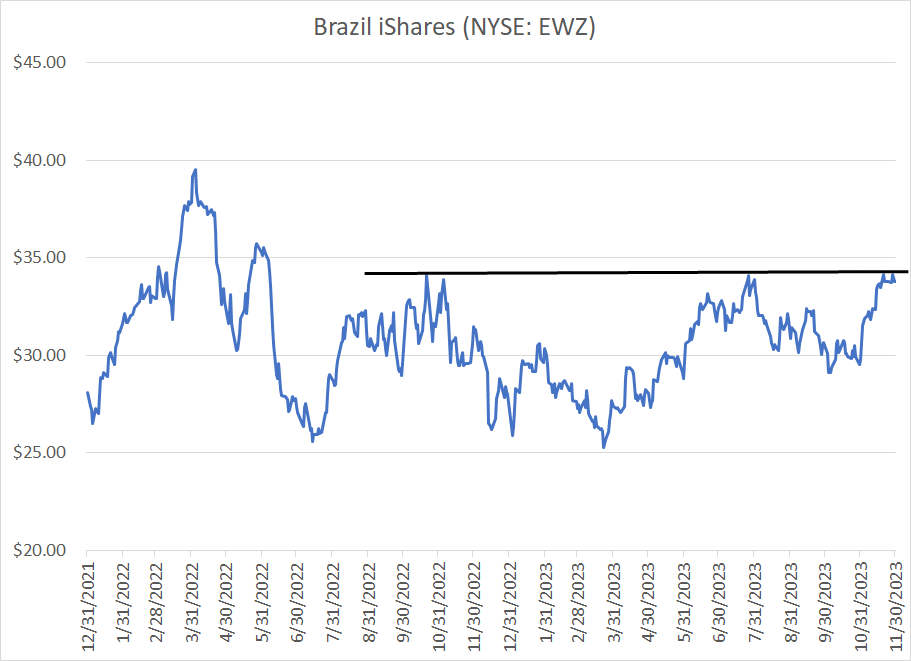
Source: Bloomberg
In the paid tier to The Free Market Speculator, I added the Brazil iShares (NYSE: EWZ) to the model portfolio last summer at lower price levels.
Today, EWZ is consolidating near a key technical resistance level at $34. Should this consolidation ultimately resolve to the upside as I expect, I may look to add to this recommendation in the model portfolio.
In early 2023, the Brazilian Central Bank had some of the tightest monetary conditions of any economy in the world and, since summer, the central bank has eased its benchmark Selic rate from 13.75% to 12.25% as inflation has eased.
I expect more easing into 2024 and that’s traditionally been a driver of equity market outperformance; coupled with a weaker dollar that’s a potentially powerful catalyst for EWZ.
If you’re not already a subscriber to the paid tier of Free Market Speculator, I’m offering 90-day free trials to the service as a special Christmas offer this year.
Tap the link below and gain immediate access to the service for the next 90 days. If you decide to cancel before your free trial term is up, your credit card won’t be billed. This offer is ONLY available by clicking here:
DISCLAIMER: This article is not investment advice and represents the opinions of its author, Elliott Gue. The Free Market Speculator is NOT a securities broker/dealer or an investment advisor. You are responsible for your own investment decisions. All information contained in our newsletters and posts should be independently verified with the companies mentioned, and readers should always conduct their own research and due diligence and consider obtaining professional advice before making any investment decision.