

Rate Scare, Growth Scare
Rate Scare, Growth Scare

The stock market is in the throes of a classic interest rate scare that’s apparent from this chart:

Source: Bloomberg
This chart shows the Nasdaq Cumulative Advance-Decline line in blue compared to the total expected increase in rates over the next 3 years (12 quarters) priced in the Eurodollar futures market in orange.
I’ve inverted the scale for rate hikes – a falling orange line indicates market expectations for more rate hikes – to make the correlation here easier to see.
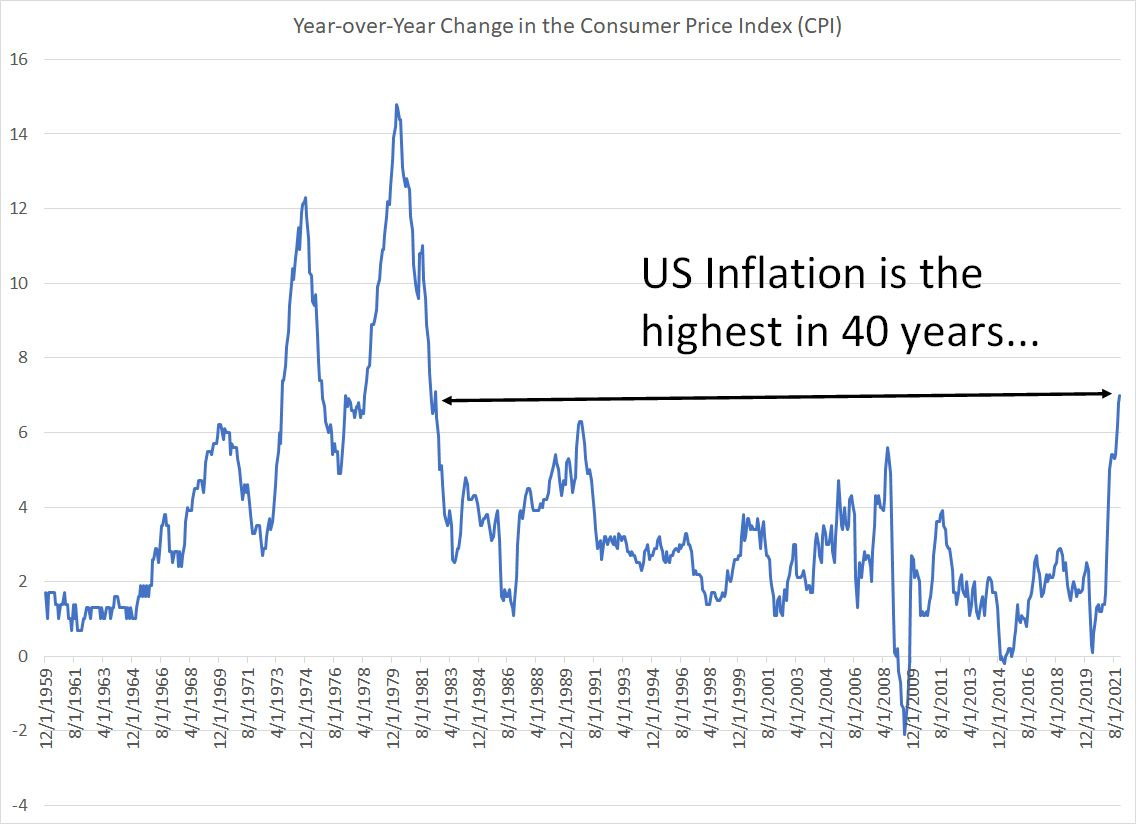
At the beginning of 2021, Eurodollar futures were pricing in less than 0.30% in total Fed hikes over the ensuing 3 years; by early April, the market was pricing in nearly 150 basis points (1.50%) in hikes over the same time frame.
Early last year market expectations for rate hikes accelerated from the week of February 12th to the week of April 2nd – over this 7-week period, market expectations for rate hikes over the coming 12 quarters jumped from 0.63% to 1.44%. It should come as little surprise that this sea-change in expectations for Fed interest rate policy coincided with the peak in the Nasdaq Cumulative Advance-Decline line for this cycle.
Then, between April 2nd and end-July 2021, the market tempered its expectations for Fed rate hikes (the orange line bounced), resulting in a prolonged period of sideways trading action for the Nasdaq Cumulative A-D line.
Finally, notice that once again market expectations for future Fed policy began to ramp starting at the end of July 2021, resulting in renewed weakness in the Nasdaq Cumulative Advance-Decline line. Right now, the Nasdaq A-D line is near its lowest levels since September 2020.
As I’ve explained, rising interest rates boost the discount factor used to assess the time value of money; simply put, when interest rates rise, it drives down the present value of future profits. The effect is magnified for growth stocks, which rely on distant future earnings streams to support current valuations.
The Nasdaq is more leveraged to growth stocks than the NYSE, and you’ll notice that I’m using the Cumulative Advance-Decline line for the Nasdaq, rather than the index itself, to assess the strength of growth stocks. The reason is that the Nasdaq 100 and the Nasdaq Composite are dominated by a handful of large-cap growth stocks that propped up the entire index for much of 2021 even as most stocks collapsed.
Indeed, the Nasdaq 100 and Nasdaq Composite are off just 6.5% and 7.9% respectively from their all-time closing highs set on November 19th. Yet, between 40% and 50% of all stocks traded on the Nasdaq are down more than 50% from their all-time highs.
In other words, the Nasdaq has been in a vicious bear market for nearly a year now; however, most in the mainstream financial media have ignored the carnage until recently when the Nasdaq’s erstwhile mega-cap market leaders have started to participate in the downside.
This is what’s meant by a rate scare and I believe markets will remain nervous about the Fed for some time given current the state of inflation in the US:
Source: Bloomberg
However, there’s also growing risk to US economic growth.
Friday’s retail sales report was abysmal with December control group sales down 3.1% sequentially compared to Wall Street expectations for flat sales month-over-month. And the release also included sizable downside revisions to November data.
The University of Michigan Consumer Sentiment survey was also weak with the expectations component coming it at 65.9 compared to 68.3 last month and well below expectations for a reading of 67.0.
In light of this news, the Atlanta Fed GDP Now model estimate for Q4 2021 annualized GDP growth stands at 5.046%, down from 7.3% annualized as of the end of December (two weeks ago).
Let me be absolutely clear: At this time, none of the economic indicators I follow are signaling imminent recession for the US.
That said, the outlook for US economic growth is deteriorating this year and it’s becoming increasingly clear the Fed will need to hike rates aggressively to bring inflation under control. Further, the deteriorating inflation picture likely makes trillions of additional fiscal stimulus out of Washington DC in 2022, envisioned by many Wall Street economists as recently as last fall, an increasingly remote prospect.
Thus, by the middle of this year we may start to see some early warning signs that the probability of recession in 2023 is rising – this would be a classic growth scare with serious market implications.
Growth scares are often associated with major corrections in the broader market and that the S&P 500 usually peaks and enters a bear market as much as 6 to 12 months before the economy enters recession.
I believe this will be a major part of the market narrative as we approach midyear.
Of course, should the market begin to grow concerned about economic growth that would likely change expectations for Fed policy – would a dovish turn from the central bank later this year be enough to “save” the Nasdaq and growth?
The big Nasdaq peak in 2000 looks analogous:
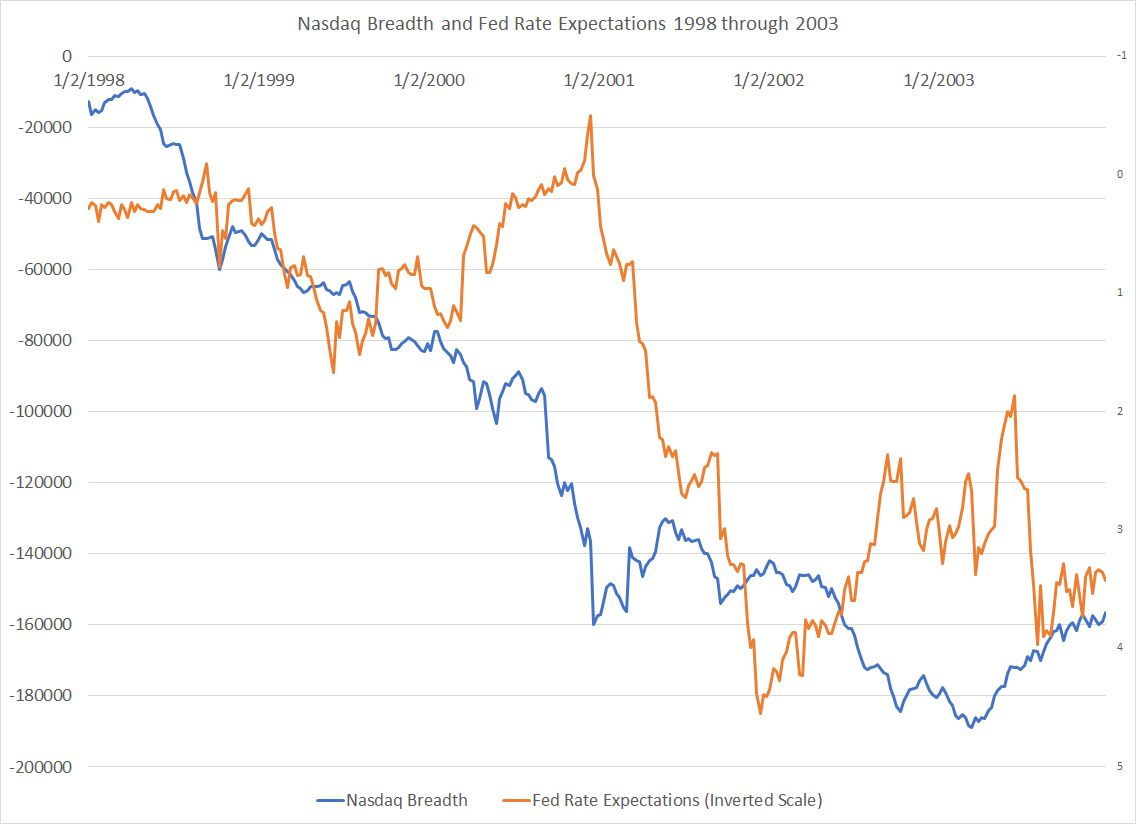
Source: Bloomberg
This chart tracks the Nasdaq Cumulative Advance-Decline line and Fed Rate expectations from 1998 through 2003.
As you can see, Nasdaq breadth was extremely weak from early 2008 until roughly March 2003; then, as now, a handful of large-cap Nasdaq components managed to prop up the major indices from 1998 until the peak in March 2000.
That said, the market began to price in a series of Fed rate hikes in September 1998; the Fed followed through with an actual hike in June 1999. Rising expectations for rate hikes starting in September 1998 followed by a series of actual hikes from June 1999 to May 2000 drove significant further deterioration in Nasdaq breadth and, eventually, a top in the Nasdaq in March 2000.
However, as the market cracked and economic data began to weaken in 2000, market participants began to price in an end to Fed rate hikes and, by December of 2000, actual cuts in the Fed Funds Rate.
The Fed delivered on those expectations with a series of cuts to interest rates starting in January 2001. And the US economy officially entered a short, shallow recession in March 2001. The yield on 10-year US government bonds fell from a peak of almost 6.8% in January 2000 to a low of around 3.57% in October 2002.
However, were Fed cuts and falling bond yields enough to support tech stocks and the Nasdaq?
The answer was clearly no since the Nasdaq Composite, Nasdaq 100 and Nasdaq breadth all continued to decline through late 2002.
Indeed, growth and the Nasdaq dramatically underperformed the S&P 500 and value stocks over this time even though yields fell and, therefore, the discount rate also declined.
I believe the reason is that in the late 1990s, just as over the past year, low real interest rates coupled with strong economic growth helped to inflate a bubble in technology and growth shares – valuations soared relative to other sectors of the market on both occasions. Clearly, rising interest rate expectations and Fed hikes in both 1999-2000 and today helped to “prick” these speculative bubbles.
However, just as speculative bubbles tend to feed on themselves on the upside regardless of underlying fundamentals, the same happens on the downside – the Y2k growth bubble continued to deflate even after the Fed began loosening policy in 2001 and the economy emerged from recession in late 2001.
In short, while there will undoubtedly be countertrend rallies for growth and the Nasdaq this year, the pattern is eerily reminiscent of the 1999-2002 period.
DISCLAIMER: This article is not investment advice and represents the opinions of its author, Elliott Gue. The Free Market Speculator is NOT a securities broker/dealer or an investment advisor. You are responsible for your own investment decisions. All information contained in our newsletters and posts should be independently verified with the companies mentioned, and readers should always conduct their own research and due diligence and consider obtaining professional advice before making any investment decision.