

Complacent Stocks Mask Rising Risks
Complacent Stocks Mask Rising Risks
The recent rally isn't as powerful as it looks...

In Tuesday’s issue of The Free Market Speculator, “Bailouts, QE and Stimulus,” I took a deep dive into the Fed’s response to the ongoing regional banking crisis.
Simply put, the $300 billion pop in the Fed’s balance sheet last week can reasonably be called a bank and uninsured depositor bailout, but it’s not quantitative easing (QE) and it’s not stimulus.
Indeed, quite the opposite, since the ongoing flow of deposits from smaller regional banks to the too-big-to-fail contingent is likely to further tighten access to credit, bringing the oncoming recession closer into view.
The events of the past few weeks brought some serious volatility to bond markets:

Source: Bloomberg
As this chart shows, the one-day plunge in 2-Year Treasury yields on Monday March 13th was larger than anything that happened amid the Lehman crisis back in 2008. It’s even bigger than the decline in yields back on October 19, 1987, a day when the S&P 500 experienced a more than 20% one-day collapse.
The plunge in yields signaled safe haven buying and a rapid change in expectations for the near-term path of Fed interest rate policy.
Perhaps even more important, as I explained in “Accidents, the Yield Curve and Recession,” the fall in short-term government bond yields also led to a rapid yield curve re-steepening after a long period of inversion, historically a reliable harbinger of recession.
Commodity markets also saw plenty of volatility with Brent oil prices down more than 15% from March 6th through March 17. Declines of that magnitude are rare; using weekly data since June 1988 (1811 observations) there have been only 30 similar declines, most either immediately before, during or following a recession.
However, equity market investors couldn’t care less.
Through yesterday’s close, the S&P 500 remains down less than 1% this month and up 3% this year while the Nasdaq Composite is up about 2% and 11.75% over the same time frames respectively.
You could argue bullish stock speculation continues to run rampant.
Even “meme” stock darling GameStop (NYSE: GME) soared more than 50% at the open on Wednesday after announcing it actually turned a profit in the fourth quarter of last year:
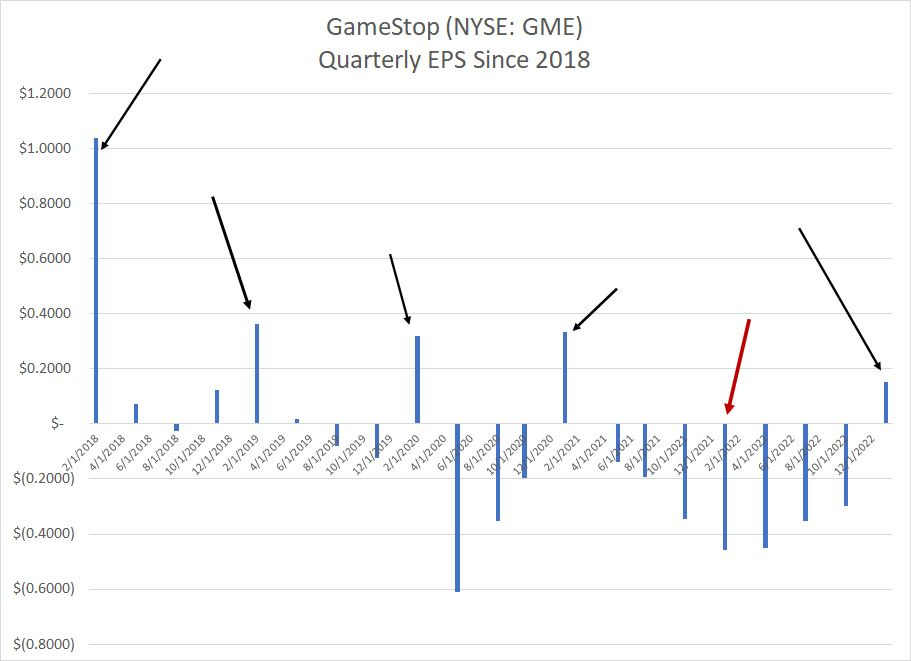
Source: Bloomberg
Let’s examine this.
GameStop’s fiscal year-end is January, so their fourth quarter includes the months of November, December and January; you’ll notice the Christmas shopping season falls right in the middle of that quarter.
It’s rare for a retailer to lose money in the most important quarter of the year for retail sales, though as you can see from the red arrow above, GameStop managed that feat a year ago.
Also, never mind the company still lost $0.95 per share last year and is expected to do so through at least the next two fiscal years as well. Indeed, Wall Street analysts that still bother to cover the stock appear to be focused primarily on predicting how many quarters GME can continue operating before they run out of cash.
And lest we forget, GameStop is still a retailer, specializing in selling physical video game products, into a market increasingly dominated by downloads. Most of its retail locations are in shopping malls, which have experienced a steady decline in foot traffic for many years.
What could possibly go wrong?
Let’s take a closer look at the stock market’s complacency so far this year:
This Rally is Shakier than it Looks
In “Wall Street’s Not-so-Free Lunch” I explained how the S&P 500 is increasingly dominated by a small number of large-cap stocks and price moves across stocks and sectors are increasingly correlated.
That’s due, in part, to the increased dominance of passive indexing strategies and 15 years of easy money stimulus from the Fed that’s inflated valuations for tech and growth stocks. Just consider the 10 largest stocks in the index — 7 of which are tech/growth stocks — have a higher weight in the S&P 500 than the bottom 400 stocks.
Investors seem to be saying it doesn’t matter what’s happening to the economy and corporate profits. If there’s any hope of Fed easing, or a restart of quantitative easing, growth stocks should soar based on a falling discount factor and that alone should be enough to keep the broader averages in the green.
Let’s take a closer look under the hood of the most recent market advance:
Source: Bloomberg
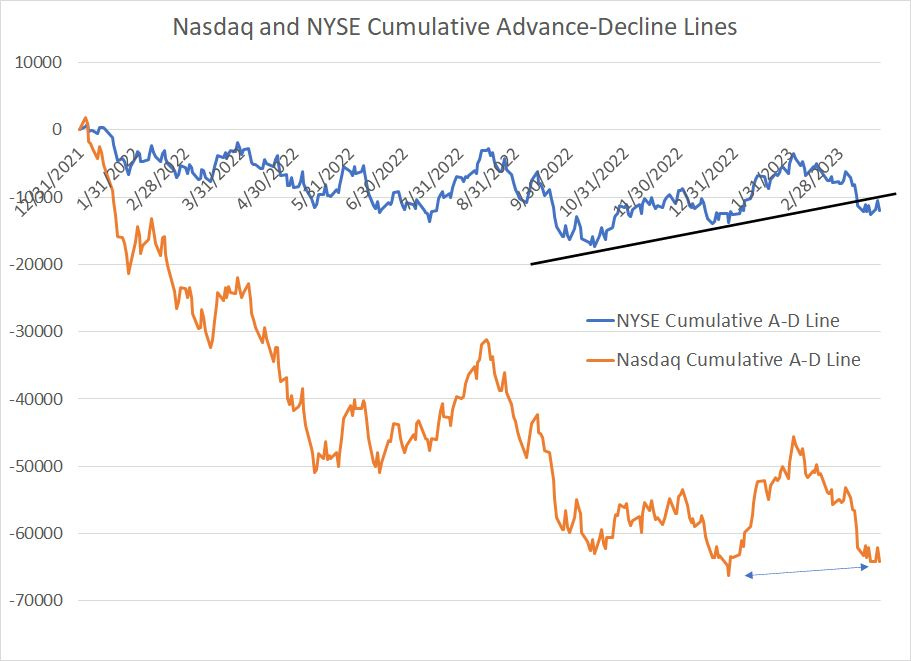
This chart shows the Cumulative A-D Lines for both the NYSE (blue) and Nasdaq (orange) since the end of 2021 – I rebased both lines to start at zero on December 31, 2021.
These lines are created starting with the number of stocks advancing in price on a given trading day and subtracting the stocks declining in price. That number is then added to the running, cumulative total of all prior trading days.
Simply put, when this line is rising, most stocks on the associated exchange are rising and vice versa.
The Nasdaq Composite bottomed on December 28th and was up about 14.5% through Wednesday’s market close. The Nasdaq A-D line also bottomed on December 28th, but it’s now close to breaking down BELOW that low.
While the index is rising, that’s largely driven by a handful of large-cap tech stocks – most Nasdaq issues are much, much weaker than the index itself.
Just consider, year-to-date the Nasdaq Composite is up more than 11%; however only about 48% of the roughly 3,600 stocks in that index are up year to date and the average gain is under 0.4%.
Breadth on the NYSE looks a bit better; however, note that the NYSE’s A-D Line bottomed on October 14th and reached a peak on February 2nd. Recently it clearly broke down below the trendline established from that mid-October low.
You can see a similar trend watching these ratios:
Source: Bloomberg
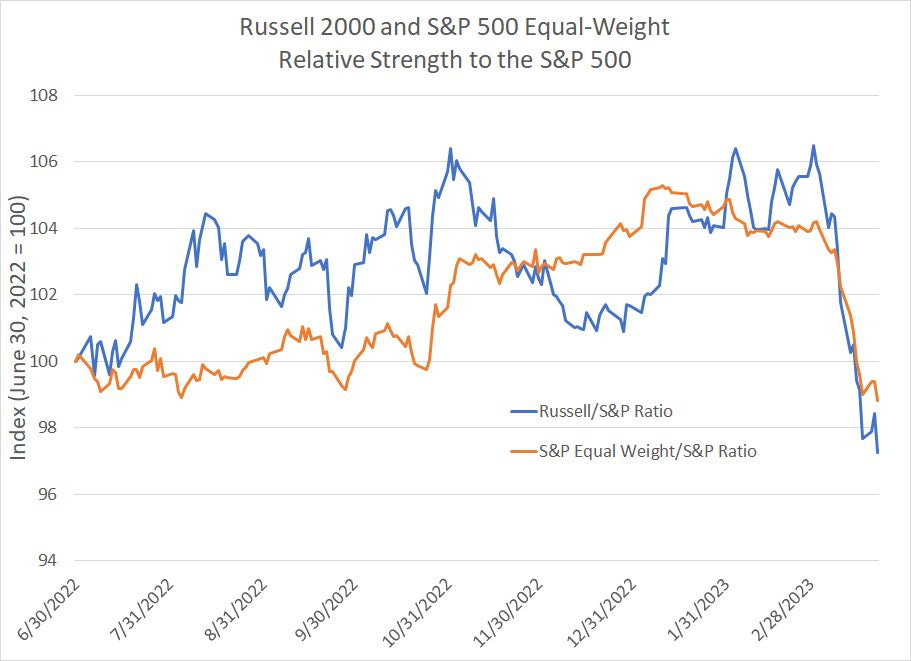
The blue line shows the relative strength of the Russell 2000 Index of small-caps to the broader S&P 500 while the orange line shows relative strength of the Equal-Weight S&P 500 to the traditional market cap-weighted version. Both lines are presented since the middle of last year, June 30, 2022.
As you can see, both the small-caps and the equal-weighted S&P 500 handily outperformed the broader market through the second half of last year and held their own through February this year.
March, however, has been an unmitigated disaster for both on a relative basis — both the Equal Weight S&P 500 and the Russell 2000 have more than given back all their relative gains over the past nine months in the space of less than three weeks.
You can see similar trends in market volume:
Source: Bloomberg
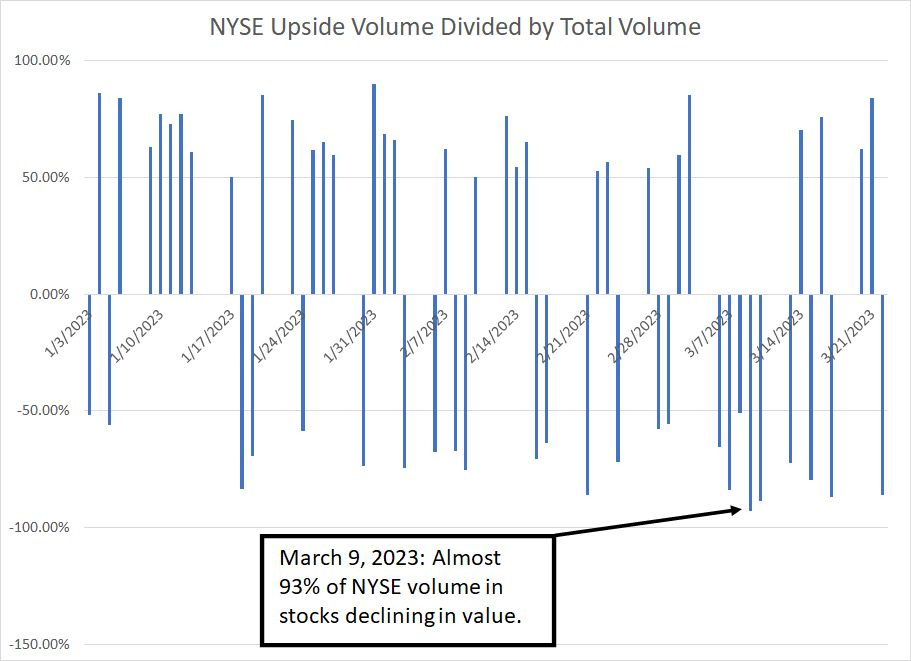
This charts shows the upside/downside volume ratio on the NYSE.
Simply put, it’s calculated by comparing the daily volume in NYSE stocks advancing in price to the total volume traded in stocks both advancing and declining in price.
A 90% upside day is a trading day where 90% of volume is in stocks advancing in price; a 90% downside day is the opposite. Typically 90% upside and downside days indicate strong broad-based buying and selling pressure respectively. When you see a 90% downside day that’s historically a flashing red warning sign as such days often precede at least a meaningful correction in the broader stock market.
As you can see from my chart above, March 9th was a 93% downside day. We also saw an 88.5% downside day on March 10th, an 87.0% downside day on March 17th and an 86% downside day just yesterday. Even through the broader averages are trending higher so far this month, there’s a good deal of pain just below the surface.
Unless or until we get a 90% upside day, I’ll remain on high alert for an additional leg lower in stocks.
2021 Nostalgia
Equity market investors appear to be contemplating a return to an environment similar to 2021:

Source: Bloomberg
In 2021 Nasdaq breadth, as measured by the cumulative Advance-Decline line, peaked on February 9, 2021 and most Nasdaq stocks peaked and started falling at that time.
However, the Nasdaq Composite rallied an additional 14.8% to its peak on November 19th the same year powered higher by a shrinking cadre of mega-cap components. By the time the Nasdaq peaked in November 2021 most stocks were already in bear markets.
After that experience, it’s not a huge surprise equity markets might look to hide in the very same large-cap tech and growth stocks that propped up the major averages from February to November 2021.
The timing of deterioration in breadth suggests the recent bank crisis is the catalyst for a rotation out of most sectors and stocks and back into large cap tech and growth stocks like Microsoft (NSDQ: MSFT) and Apple (NSDQ: AAPL).
The most plausible explanation is that growing market optimism about the potential for a Fed pivot — and a new wave of quantitative easing — prompted many investors to open up their stimulus playbook from 2020-21 when large-cap growth triumphed.
Ultimately, however, 2023 isn’t 2021, not even close.
Back in February 2021 few were talking about inflation and the Federal Reserve still had interest rates pegged at zero and more than a year of quantitative easing ahead. Incoming President Joe Biden was pushing ahead with yet another round of stimulus checks, part of the $1.9 trillion American Rescue Plan signed into law on March 11, 2021 and many states still had significant COVID-related lockdown restrictions in place.
With the economy growing at a blistering 6.3% annualized pace in Q1 2021, a recession wasn’t even on the proverbial radar screen.
Today, however, the Fed Funds rate is back at 5% for the first time since 2007, quantitative tightening continues despite what you may have heard, core inflation is at 5.5% annualized, a regional banking crisis is tightening credit conditions and a recession (and profits recession for the S&P 500) looks imminent:
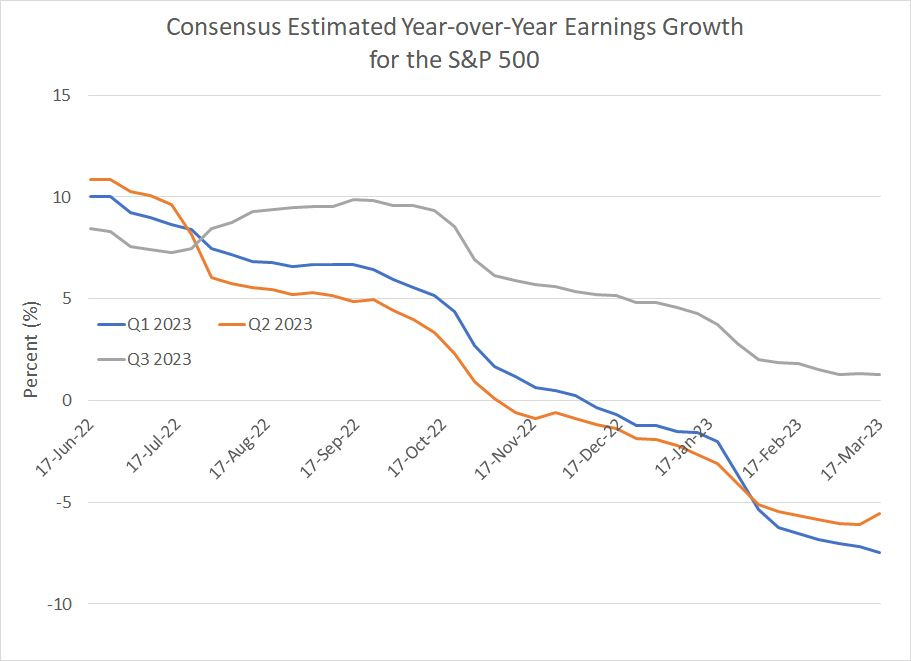
Source: Bloomberg
That leaves the Fed, and the federal government, little maneuvering room to apply stimulus without reigniting the generational surge in inflation. Indeed, I suspect when the Fed does pivot it’ll be the result of a deepening recession and it will be bad news, NOT good news, for the stock market.
Bottom Line: The recent rally in the stock market has come on weaker breadth, meaning it’s driven by a shrinking number of large cap stocks with large index weights in the S&P 500 and Nasdaq Composite.
Such rallies are notoriously prone to failure; given deteriorating economic conditions, instability in the financial system and a weakening technical trend, I believe we may be approaching a sell everything moment in stocks.
DISCLAIMER: This article is not investment advice and represents the opinions of its author, Elliott Gue. The Free Market Speculator is NOT a securities broker/dealer or an investment advisor. You are responsible for your own investment decisions. All information contained in our newsletters and posts should be independently verified with the companies mentioned, and readers should always conduct their own research and due diligence and consider obtaining professional advice before making any investment decision.